
Everyone knows that in big U. S. cities, street parking can be extremely difficult to find. For many potential buyers and renters, the price and availability of parking could make or break a housing decision.
To help provide some insight, we dug into the data for some of the densest, most notoriously-crowded U.S. cities to identify those neighborhoods where finding a spot for your car was just as, or maybe even more, difficult than finding a place to live.
Trulia and Parknav, a leading provider of real-time street parking data, teamed up to find the best and worst neighborhoods for street parking in seven major cities at peak weekday and weekend times. Then, we looked through all the homes for rent on Trulia to find out where renters stood the best chance of landing a garage or other private parking spot as part of the property.
We found interesting trends in the seven cities that we analyzed: Houston, New York (Manhattan and Brooklyn), Philadelphia, Portland, Ore., San Francisco, Seattle and Washington, D.C.
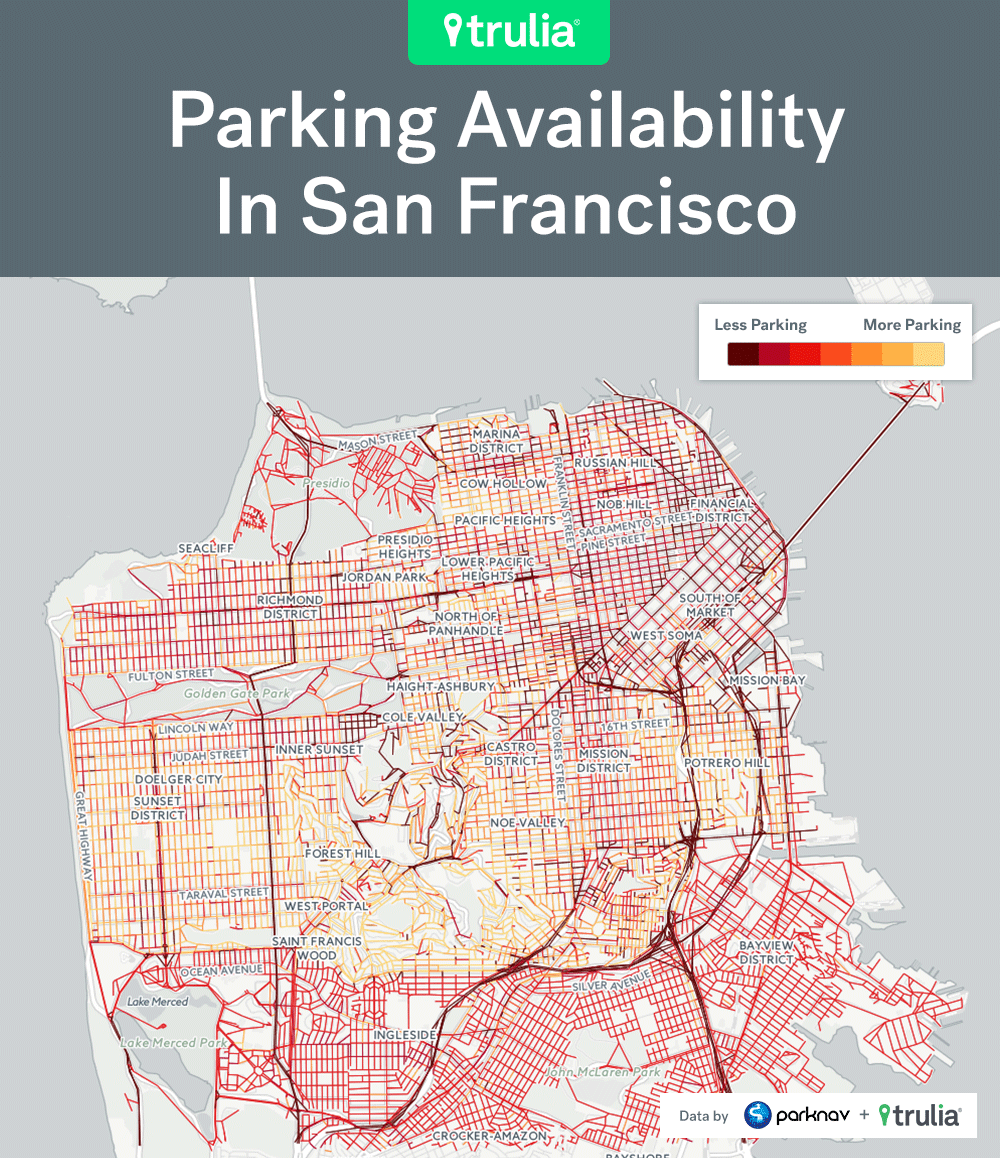
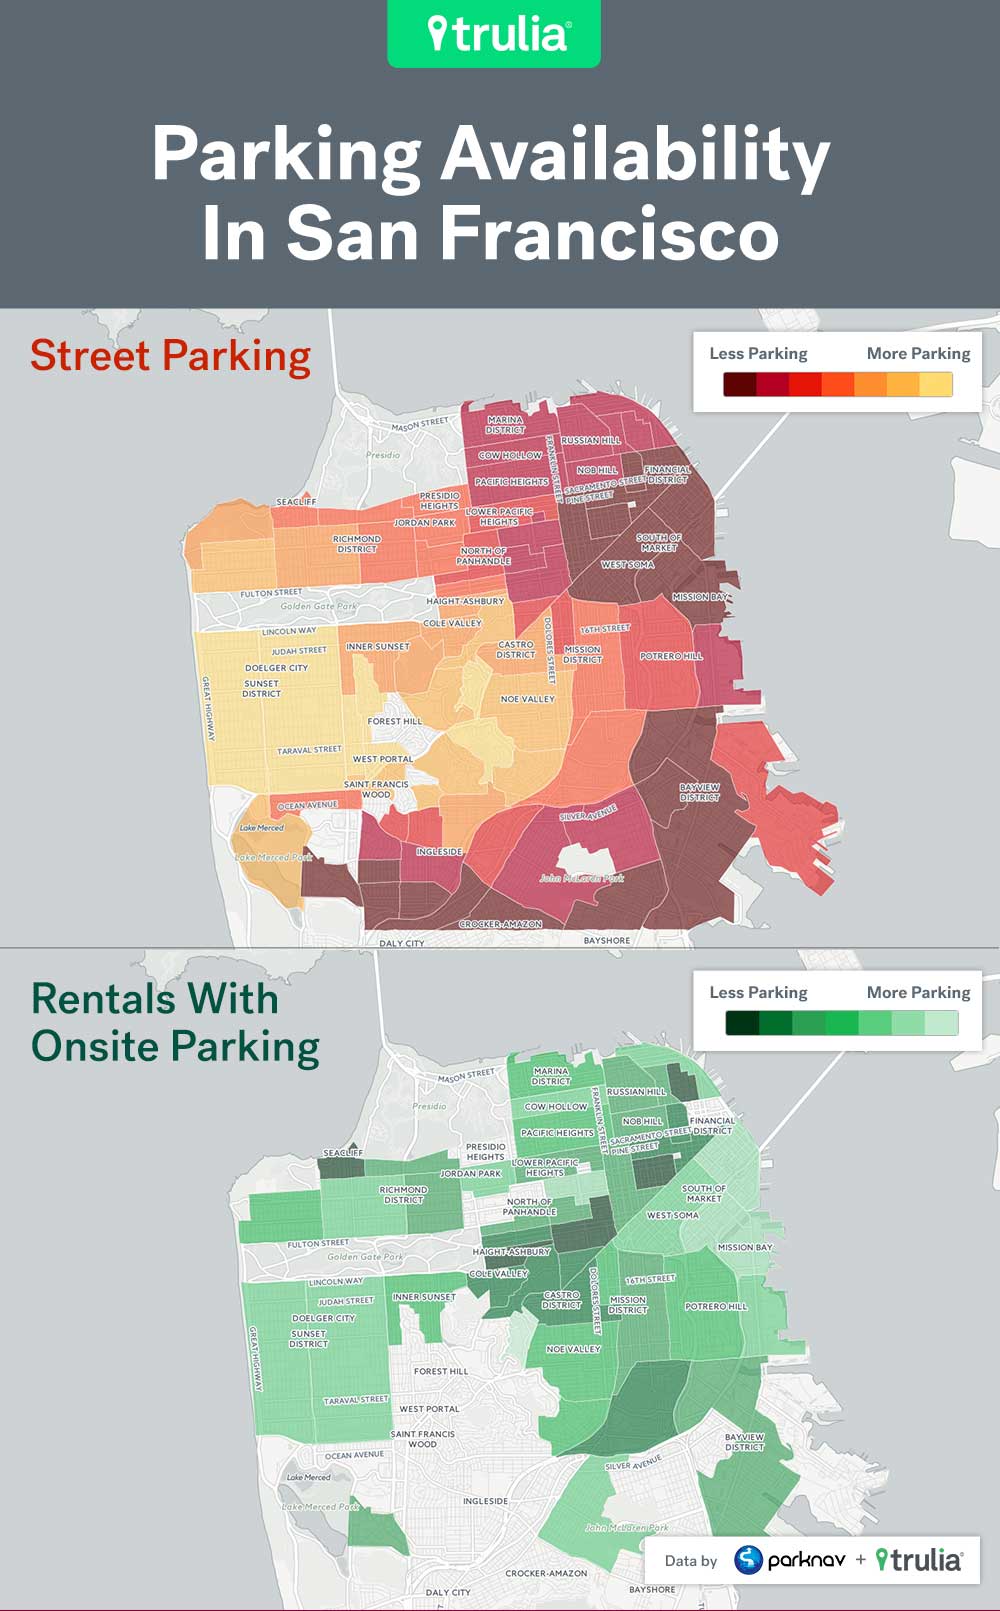
- For example, San Francisco’s exclusive Noe Valley neighborhood actually had relatively accommodating parking, and ample listings with private parking, while Sea Cliff, Potrero Hill and the Mission neighborhoods were stingy even by San Francisco standards.
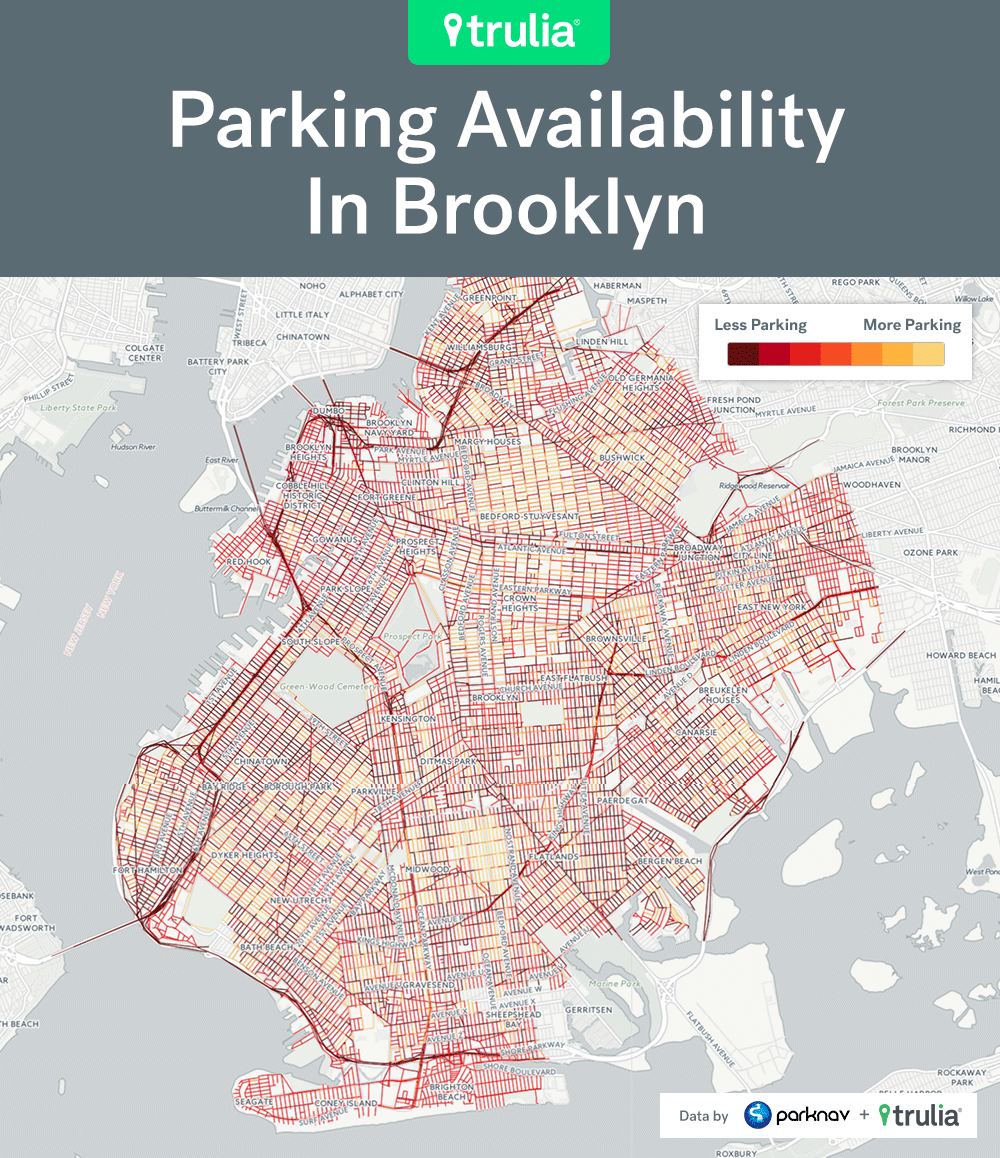
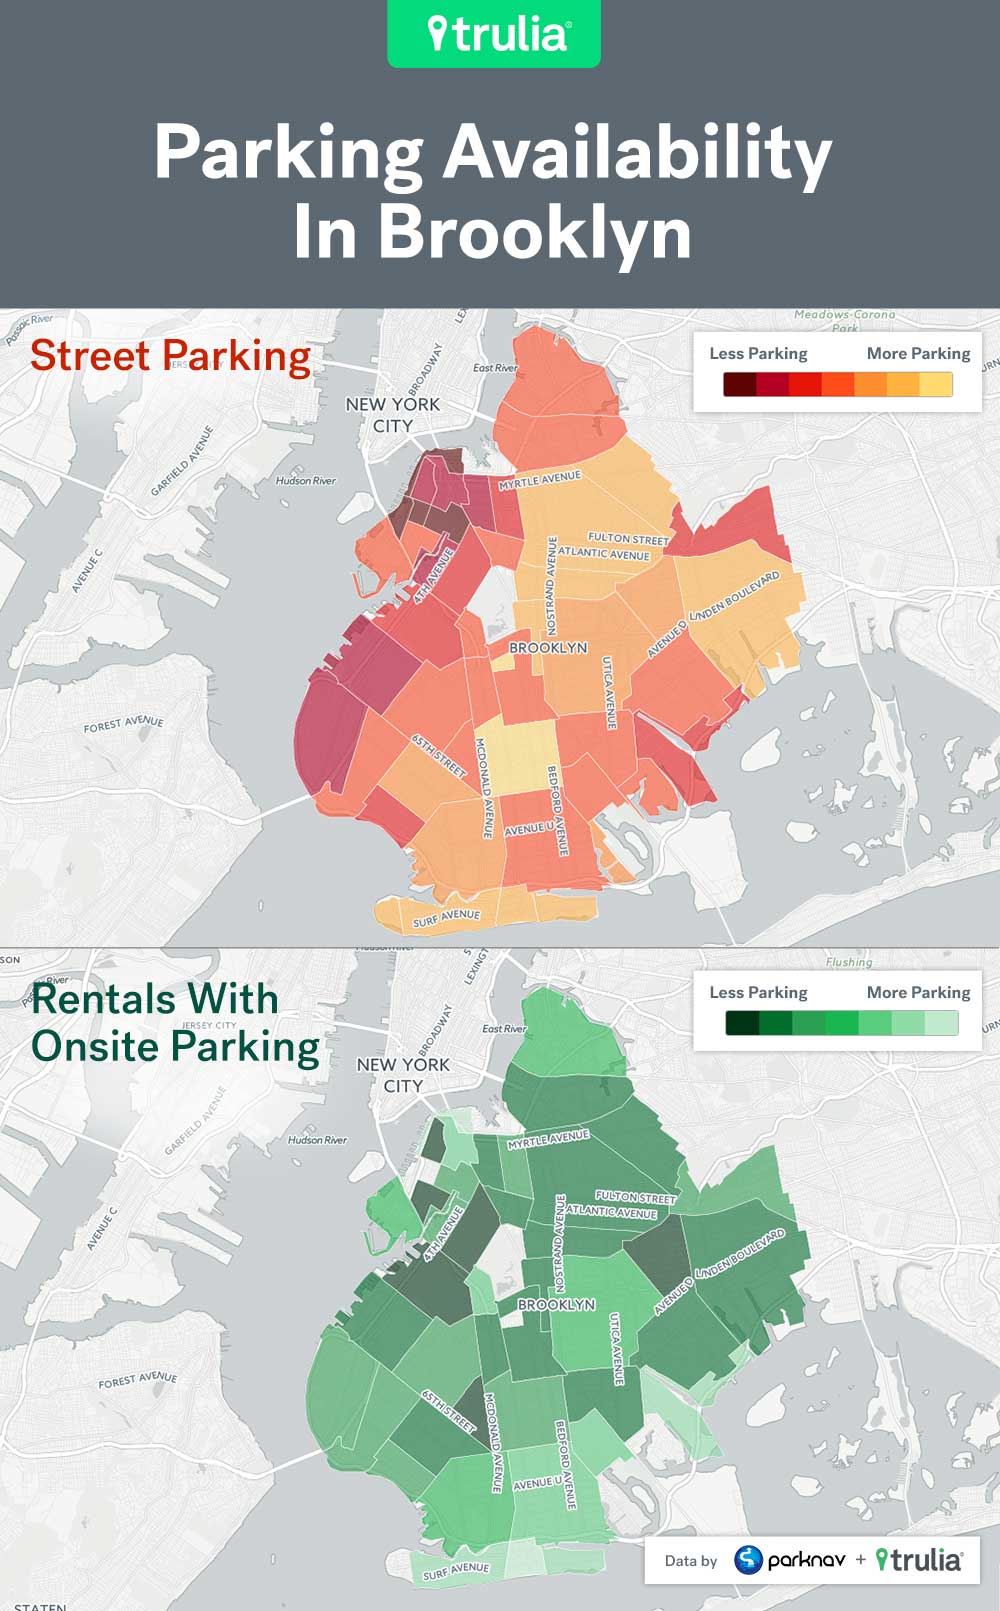
- Meanwhile, in New York, Brooklyn neighborhoods such as Dumbo, Coney Island and Sheepshead Bay offered scant street parking, but rentals advertised there were more likely than average to offer parking spaces. Contrast those neighborhoods with Cobble Hill, Fort Greene and Park Slope where parking – private or public is precious.
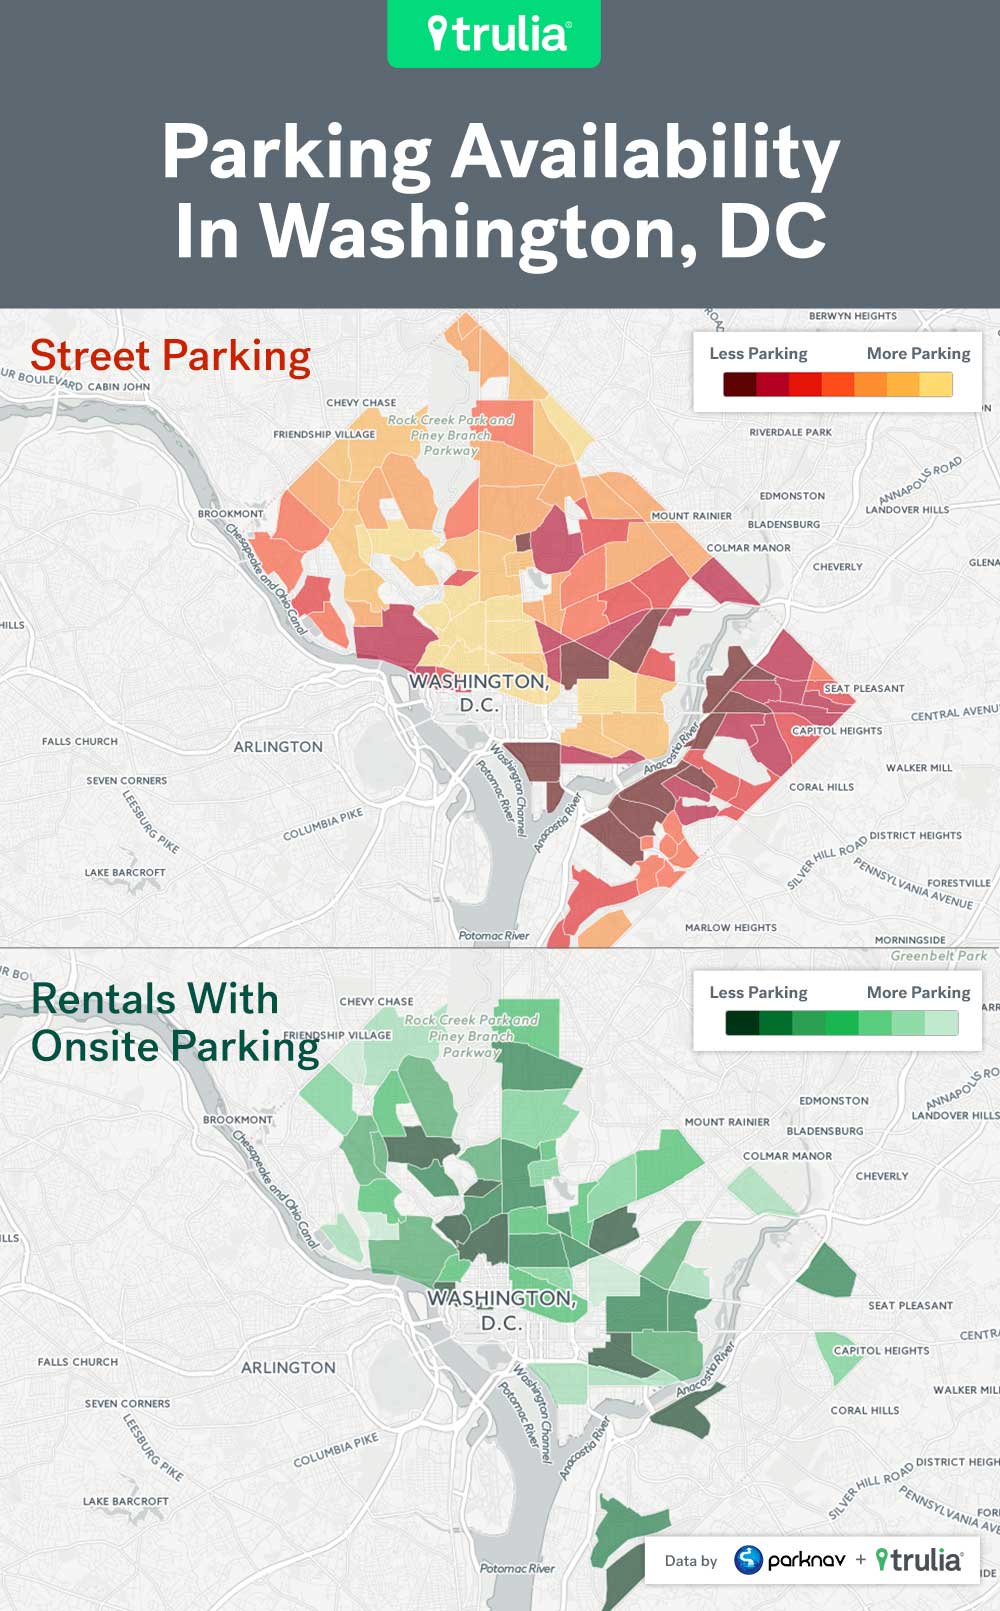
- And in Washington, D.C., which ranked as the second worst, after Manhattan, of the seven cities we looked at for parking, we found a couple of neighborhoods such as Lower Central NE and Fairlawn not only short on public parking, but on private parking too.
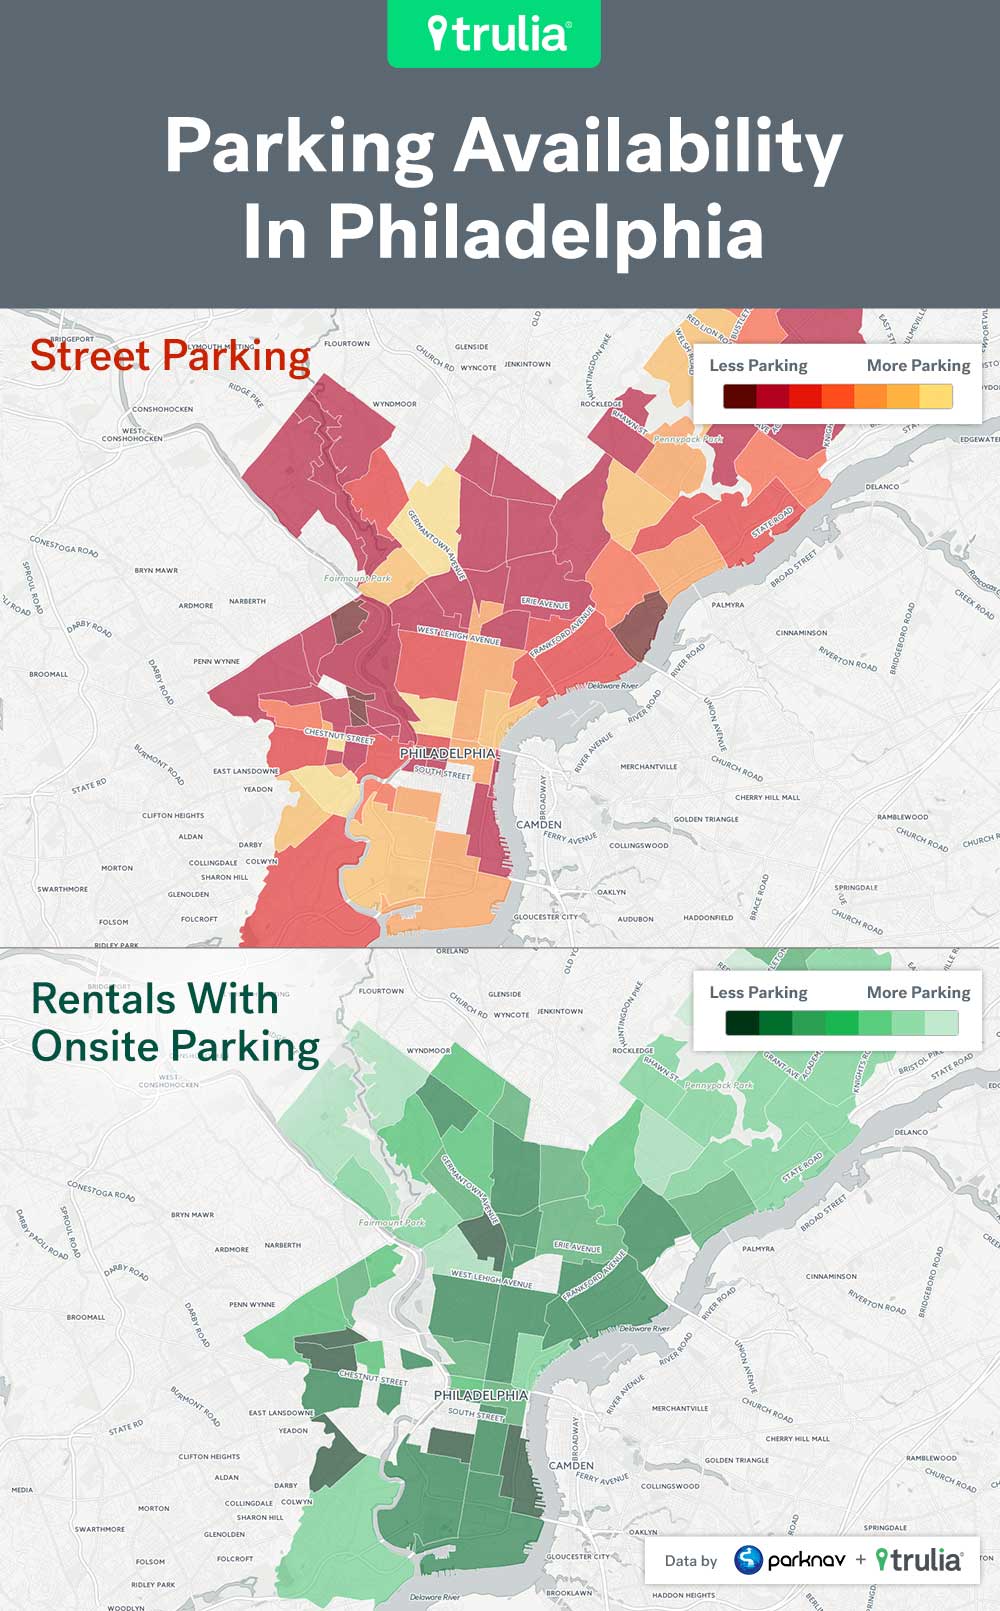
- In Philadelphia, the 10 neighborhoods with the worst street parking have very low percentage of homes that offer a dedicated parking space. Renters may want to avoid these areas if they own a car and need to drive to work.
How We Measured Parking Availability
We calculated a Parking Score, from 0 to 100, for each Trulia rental listing that we used to conduct this study. You can think of the Parking Score as a number that tells you how easy it is to find street parking within walking distance of a given listing. On this scale, 0 means parking is impossible and 100 means parking is easy. You can also drill down into some of our block-by-block listing and parking data in the methodology section at the end of this report.
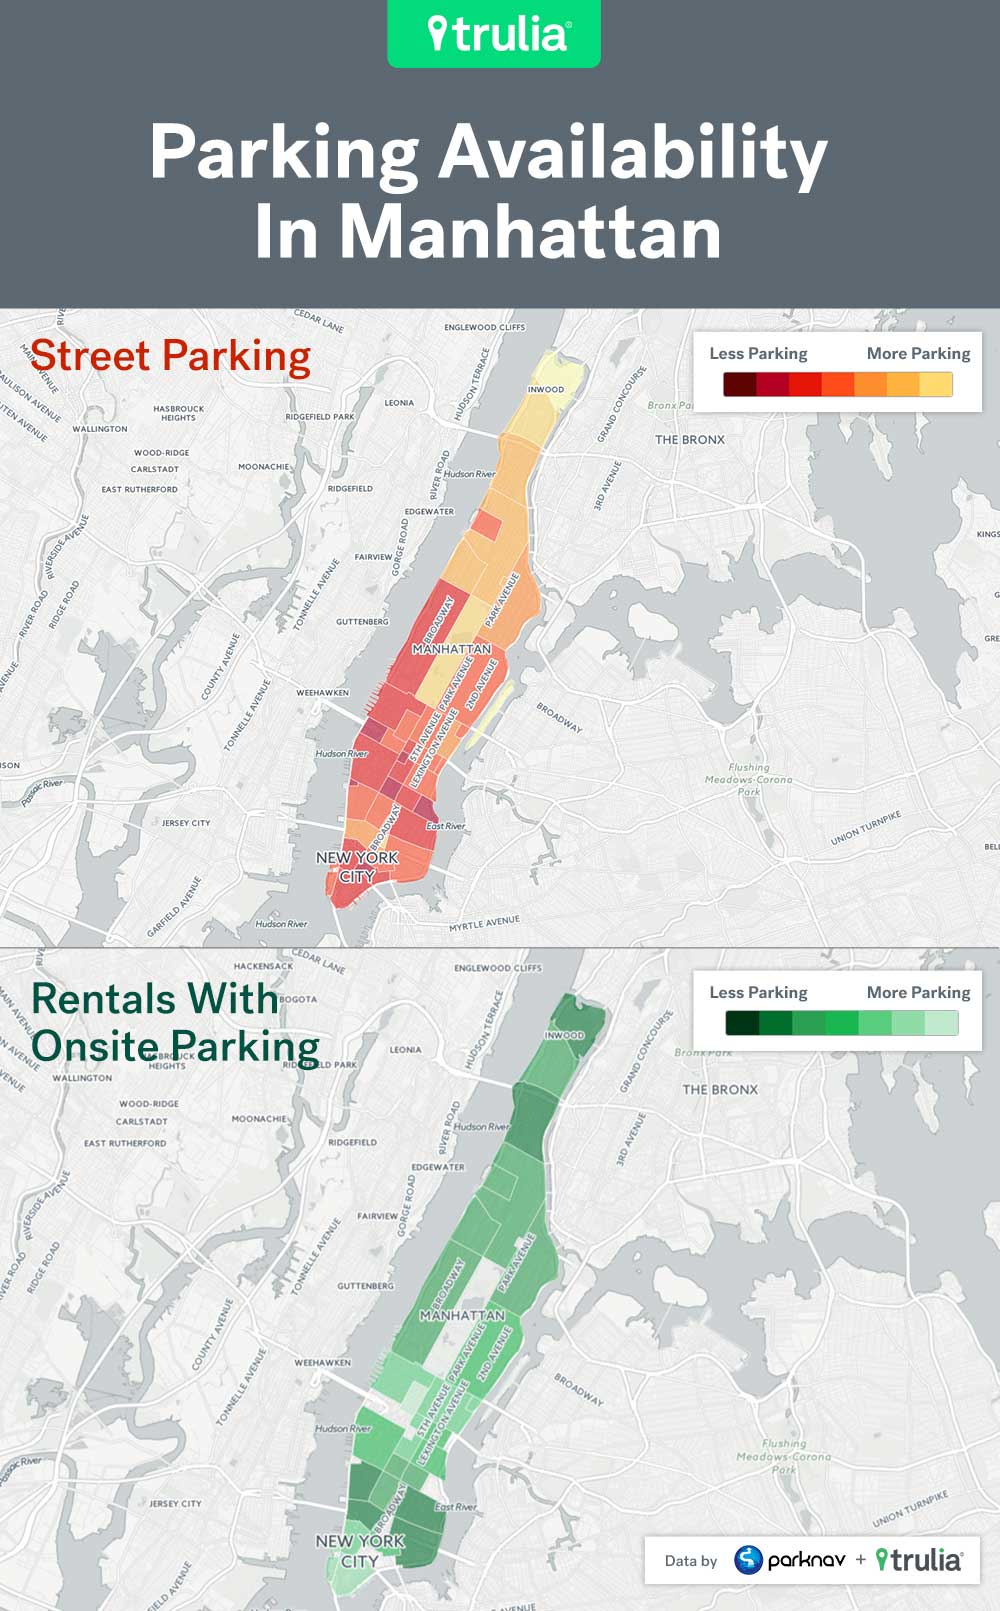
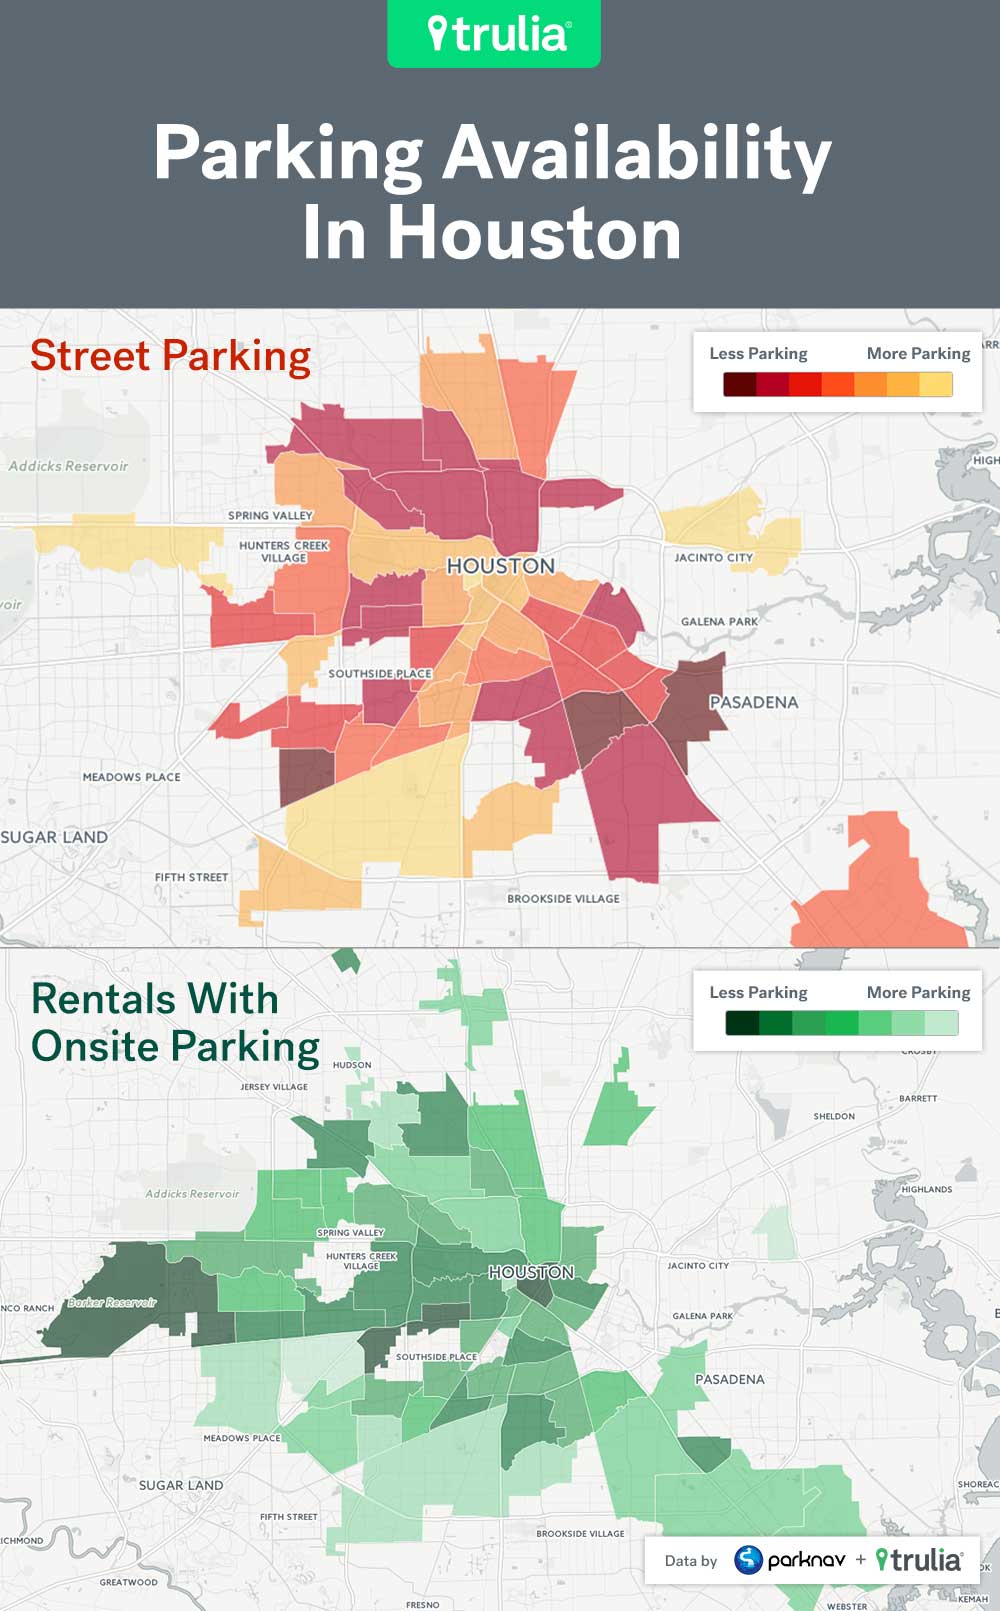
Using the Parking Score for each rental listing, we were able to determine which neighborhoods in each of the seven cities that we studied had the easiest or toughest street parking. In the maps below, the darker the shaded area, the more difficult it is to find street parking in that neighborhood. Neighborhoods and areas not color-coded did not have enough data to assign a score.
Not All Neighborhood Parking in a City Is Created Equally
Every city handles its parking resources differently. So renters and buyers should consider local rules and regulations when making parking choices.
In addition, the cost of a private parking space can vary greatly city by city, neighborhood by neighborhood. For instance, even though Washington D.C. had the biggest shortage of parking, monthly prices advertised recently on Craigslist ranged from $75 to $225 for a parking space, depending on the neighborhood. In San Francisco, where parking is more plentiful, prices ranged from $200 to $400. And in Seattle, a parking spot in bustling Pike Market costs roughly $70 to $100.
San Francisco also offers residents parking permits (at an annual cost of $111) that gives locals priority for neighborhood spots. Because each city has its own varying rules regarding parking – everything from permits to time limits – renters are encouraged to contact city parking authorities for permit options.
| Top 10 Worst Manhattan Neighborhoods for Street Parking | |||
| # | Neighborhood | Parking Score | % Rentals Listed as Having Parking |
| 1 | Koreatown | 12 | 4% |
| 2 | Hell’s Kitchen | 12 | 3% |
| 3 | Flatiron District | 13 | 2% |
| 4 | Civic Center | 14 | 3% |
| 5 | Financial District | 15 | 5% |
| 6 | Clinton | 16 | 4% |
| 7 | Gramercy Park | 16 | 2% |
| 8 | Midtown South Central | 17 | 4% |
| 9 | Tribeca | 17 | 4% |
| 10 | Chelsea | 17 | 3% |
| Note: Parking scores ranged from 0 to 100, where 0 means parking is impossible and 100 means parking is easy. | |||
| Top 10 Best Manhattan Neighborhoods for Finding a Rental with Dedicated Parking | |||
| # | Neighborhood | Parking Score | % Rentals Listed as Having Parking |
| 1 | Tudor City | 18 | 33% |
| 2 | Garment District | 19 | 7% |
| 3 | Theater District – Times Square | 18 | 6% |
| 4 | Battery Park City | 18 | 5% |
| 5 | Financial District | 15 | 5% |
| 6 | Roosevelt Island | 38 | 4% |
| 7 | Midtown East | 21 | 4% |
| 8 | Sutton Place | 19 | 4% |
| 9 | Midtown Center | 18 | 4% |
| 10 | Midtown South Central | 17 | 4% |
| Note: Parking scores ranged from 0 to 100, where 0 means parking is impossible and 100 means parking is easy. | |||
| Top 10 Worst Brooklyn Neighborhoods for Street Parking | |||
| # | Neighborhood | Parking Score | % Rentals Listed as Having Parking |
| 1 | Vinegar Hill | 19 | 27% |
| 2 | Columbia Street Waterfront District | 22 | 3% |
| 3 | Boerum Hill | 23 | 9% |
| 4 | Cobble Hill | 23 | 3% |
| 5 | Downtown/DUMBO | 24 | 17% |
| 6 | Bay Ridge and Fort Hamilton | 26 | 7% |
| 7 | Sunset Park | 26 | 5% |
| 8 | Fort Greene | 28 | 6% |
| 9 | Gowanus | 28 | 7% |
| 10 | Brooklyn Heights | 28 | 3% |
| Note: Parking scores ranged from 0 to 100, where 0 means parking is impossible and 100 means parking is easy. | |||
| Top 10 Best Brooklyn Neighborhoods for Finding a Rental with Dedicated Parking | |||
| # | Neighborhood | Parking Score | % Rentals Listed as Having Parking |
| 1 | Brighton Beach | 40 | 30% |
| 2 | Vinegar Hill | 19 | 27% |
| 3 | Manhattan Beach | 40 | 26% |
| 4 | Coney Island | 38 | 23% |
| 5 | Bergen Beach | 30 | 23% |
| 6 | Downtown/DUMBO | 24 | 17% |
| 7 | Sheepshead Bay | 33 | 15% |
| 8 | Windsor Terrace | 34 | 14% |
| 9 | Marine Park | 33 | 12% |
| 10 | East Flatbush | 35 | 11% |
| Note: Parking scores ranged from 0 to 100, where 0 means parking is impossible and 100 means parking is easy. | |||
| Top 10 Worst San Francisco Neighborhoods for Street Parking | |||
| # | Neighborhood | Parking Score | % Rentals Listed as Having Parking |
| 1 | Stonestown Apartments | 19 | 25% |
| 2 | SoMa | 20 | 37% |
| 3 | South Beach | 20 | 44% |
| 4 | Financial District | 20 | 24% |
| 5 | Mission Bay | 21 | 40% |
| 6 | Ingleside Heights | 22 | 50% |
| 7 | Chinatown | 23 | 20% |
| 8 | Tenderloin | 23 | 6% |
| 9 | Downtown | 23 | 20% |
| 10 | Civic Center | 23 | 27% |
| Note: Parking scores ranged from 0 to 100, where 0 means parking is impossible and 100 means parking is easy. | |||
| Top 10 Best San Francisco Neighborhoods for Finding a Rental with Dedicated Parking | |||
| # | Neighborhood | Parking Score | % Rentals Listed as Having Parking |
| 1 | Presidio | 35 | 63% |
| 2 | Merced Manor | 37 | 60% |
| 3 | Ingleside Heights | 22 | 50% |
| 4 | Twin Peaks | 53 | 48% |
| 5 | South Beach | 20 | 44% |
| 6 | Diamond Heights | 63 | 43% |
| 7 | Miraloma | 51 | 43% |
| 8 | Ingleside | 26 | 41% |
| 9 | Sunnyside | 42 | 41% |
| 10 | Mission Bay | 21 | 40% |
| Note: Parking scores ranged from 0 to 100, where 0 means parking is impossible and 100 means parking is easy. | |||
|
Top 10 Worst Washington, D.C. Neighborhoods for Street Parking |
|||
| # | Neighborhood | Parking Score | % Rentals Listed as Having Parking |
| 1 | Barry Farm | 12 | 37% |
| 2 | Southwest – Waterfront | 13 | 31% |
| 3 | Trinidad | 13 | 20% |
| 4 | Fairlawn | 13 | 7% |
| 5 | Historic Anacostia | 13 | 13% |
| 6 | Near Northeast | 14 | 57% |
| 7 | Park View | 14 | 24% |
| 8 | Ivy City | 14 | 0% |
| 9 | Near Southeast | 14 | 34% |
| 10 | Randle Highlands | 14 | 27% |
| Note: Parking scores ranged from 0 to 100, where 0 means parking is impossible and 100 means parking is easy. | |||
| Top 10 Best Washington, D.C Neighborhoods for Finding a Rental with Dedicated Parking | |||
| # | Neighborhood | Parking Score | % Rentals Listed as Having Parking |
| 1 | Near Northeast | 14 | 57% |
| 2 | Douglass | 16 | 50% |
| 3 | Friendship Heights | 16 | 48% |
| 4 | Burleith – Hillandale | 16 | 46% |
| 5 | North Michigan Park | 16 | 43% |
| 6 | Fort Totten | 16 | 40% |
| 7 | Stronghold | 14 | 40% |
| 8 | Barry Farm | 12 | 37% |
| 9 | Tenleytown | 16 | 35% |
| 10 | Fort Lincoln | 15 | 35% |
| Note: Parking scores ranged from 0 to 100, where 0 means parking is impossible and 100 means parking is easy. | |||
| Top 10 Worst Houston Neighborhoods for Street Parking | |||
| # | Neighborhood | Parking Score | % Rentals Listed as Having Parking |
| 1 | Northshore | 3 | 38% |
| 2 | Clinton Park Tri-Community | 15 | 14% |
| 3 | Memorial | 16 | 30% |
| 4 | Central Southwest | 16 | 54% |
| 5 | Fourth Ward | 17 | 53% |
| 6 | Downtown | 18 | 10% |
| 7 | Midtown | 19 | 31% |
| 8 | Fort Bend Houston | 19 | 57% |
| 9 | Binz | 20 | 44% |
| 10 | Washington Ave.- Memorial Park | 20 | 23% |
| Note: Parking scores ranged from 0 to 100, where 0 means parking is impossible and 100 means parking is easy. | |||
| Top 10 Best Houston Neighborhoods for Finding a Rental with Dedicated Parking | |||
| # | Neighborhood | Parking Score | % Rentals Listed as Having Parking |
| 1 | South Acres- Crestmont Park | 20 | 64% |
| 2 | Westbury | 33 | 62% |
| 3 | Lawndale- Wayside | 28 | 62% |
| 4 | Langwood | 31 | 59% |
| 5 | Fort Bend Houston | 19 | 57% |
| 6 | Central Southwest | 16 | 54% |
| 7 | Fourth Ward | 17 | 53% |
| 8 | Oak forest- Garden Oaks | 30 | 51% |
| 9 | Pecan Park | 27 | 48% |
| 10 | Braeburn | 26 | 47% |
| Note: Parking scores ranged from 0 to 100, where 0 means parking is impossible and 100 means parking is easy. | |||
| Top 10 Worst Philadelphia Neighborhoods for Street Parking | |||
| # | Neighborhood | Parking Score | % Rentals Listed as Having Parking |
| 1 | East Parkside | 21 | 11% |
| 2 | Belmont | 28 | 2% |
| 3 | Bridesburg | 29 | 9% |
| 4 | Center City West | 29 | 6% |
| 5 | Wynnefield Heights | 30 | 19% |
| 6 | Haverford North | 31 | 20% |
| 7 | Mill Creek | 32 | 24% |
| 8 | Fitler Square | 32 | 12% |
| 9 | Juniata Park- Feltonville | 33 | 15% |
| 10 | Tioga- Nicetown | 33 | 2% |
| Note: Parking scores ranged from 0 to 100, where 0 means parking is impossible and 100 means parking is easy. | |||
| Top 10 Best Philadelphia Neighborhoods for Finding a Rental with Dedicated Parking | |||
| # | Neighborhood | Parking Score | % Rentals Listed as Having Parking |
| 1 | Penn’s Landing | 90 | 45% |
| 2 | Oxford Circle- Castor | 48 | 38% |
| 3 | Fairmount Park | 34 | 33% |
| 4 | Torresdale | 40 | 32% |
| 5 | Bustleton | 46 | 31% |
| 6 | Mayfair | 38 | 30% |
| 7 | Roxborough | 33 | 29% |
| 8 | Northeast Philadelphia | 33 | 28% |
| 9 | Holmesburg | 37 | 28% |
| 10 | East Falls | 46 | 27% |
| Note: Parking scores ranged from 0 to 100, where 0 means parking is impossible and 100 means parking is easy. | |||
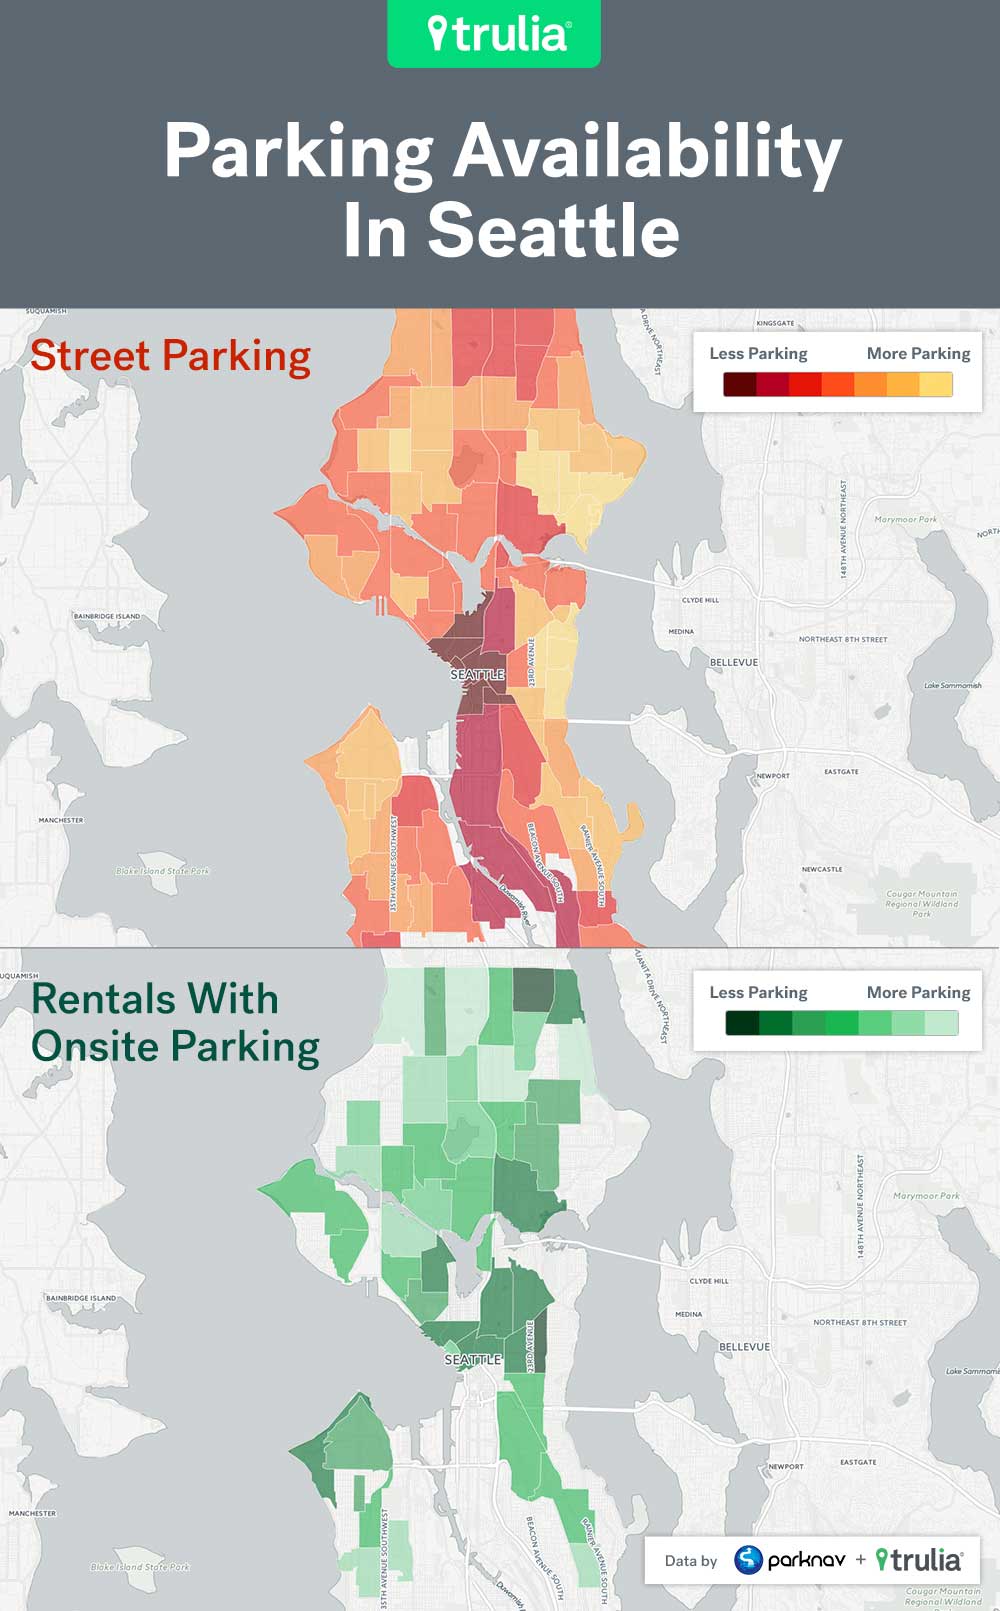
| Top 10 Worst Seattle Neighborhoods for Street Parking | |||
| # | Neighborhood | Parking Score | % Rentals Listed as Having Parking |
| 1 | Pioneer Square | 16 | 13% |
| 2 | International District | 20 | 30% |
| 3 | Central Business District | 22 | 25% |
| 4 | Pike Market | 22 | 44% |
| 5 | Belltown | 26 | 29% |
| 6 | Yesler Terrace | 30 | 32% |
| 7 | South-Lake Union | 33 | 18% |
| 8 | South Park | 37 | 19% |
| 9 | Broadway | 38 | 25% |
| 10 | Portage Bay | 42 | 45% |
| Note: Parking scores ranged from 0 to 100, where 0 means parking is impossible and 100 means parking is easy. | |||
| Top 10 Best Seattle Neighborhoods for Finding a Rental with Dedicated Parking | |||
| # | Neighborhood | Parking Score | % Rentals Listed as Having Parking |
| 1 | Broadview | 55 | 62% |
| 2 | Haller Lake | 43 | 58% |
| 3 | Maple Leaf | 57 | 56% |
| 4 | Matthews Beach | 56 | 56% |
| 5 | Victory Heights | 45 | 55% |
| 6 | View Ridge | 61 | 54% |
| 7 | South Delridge | 54 | 55% |
| 8 | Gatewood | 55 | 52% |
| 9 | North Queen Anne | 49 | 52% |
| 10 | Seaview | 58 | 51% |
| Note: Parking scores ranged from 0 to 100, where 0 means parking is impossible and 100 means parking is easy. | |||
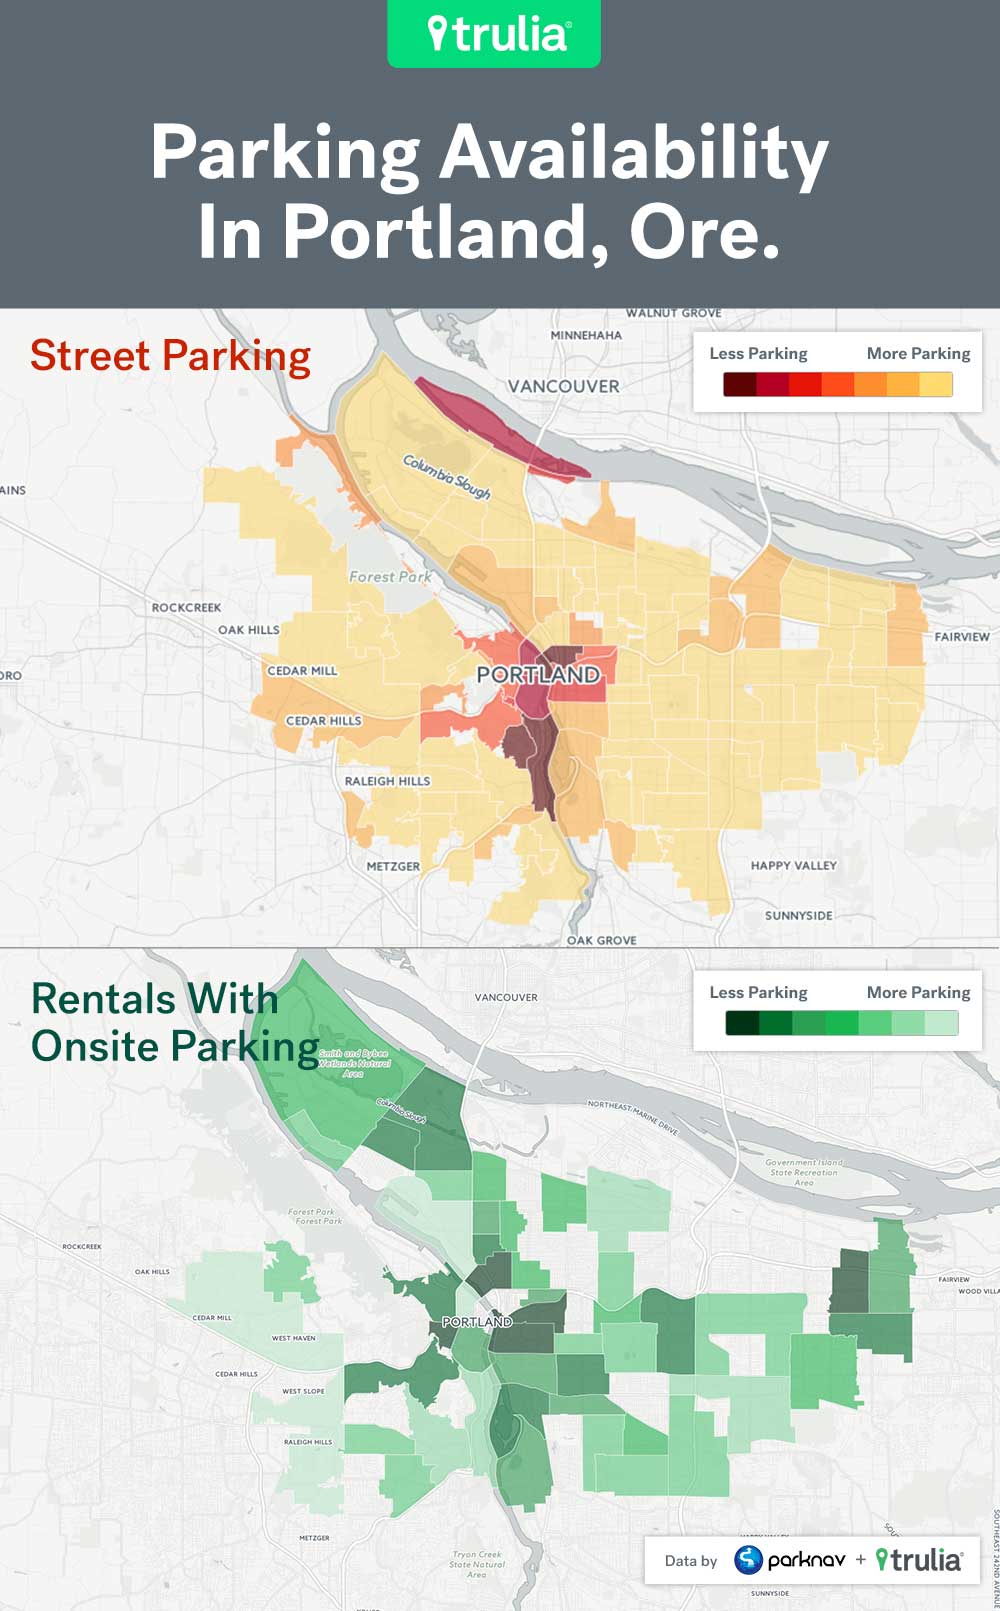
| Top 10 Worst Portland Neighborhoods for Street Parking | |||
| # | Neighborhood | Parking Score | % Rentals Listed as Having Parking |
| 1 | Homestead | 17 | 31% |
| 2 | Chinatown-Old Town | 17 | 39% |
| 3 | Corbett-Terwilliger Lair Hill | 18 | 33% |
| 4 | Pearl | 19 | 48% |
| 5 | Downtown | 22 | 19% |
| 6 | Hayden Island | 22 | 38% |
| 7 | Buckman | 24 | 6% |
| 8 | Southwest Hills | 26 | 13% |
| 9 | Kerns | 26 | 10% |
| 10 | Goose Hollow | 26 | 12% |
| Note: Parking scores ranged from 0 to 100, where 0 means parking is impossible and 100 means parking is easy. | |||
| Top 10 Best Portland Neighborhoods for Finding a Rental with Dedicated Parking | |||
| # | Neighborhood | Parking Score | % Rentals Listed as Having Parking |
| 1 | South Burlingame | 31 | 59% |
| 2 | Alameda | 33 | 50% |
| 3 | Cedar Hills – Cedar Mill | 32 | 49% |
| 4 | Pearl | 19 | 48% |
| 5 | Cedar Hills – Cedar Mill North | 31 | 45% |
| 6 | Sumner | 30 | 43% |
| 7 | Ashcreek | 32 | 42% |
| 8 | Wilkes | 33 | 42% |
| 9 | Garden Home – Raleigh Hills | 33 | 40% |
| 10 | Overlook | 31 | 40% |
| Note: Parking scores ranged from 0 to 100, where 0 means parking is impossible and 100 means parking is easy. | |||
Methodology
To determine the best neighborhoods for street parking in Manhattan, Brooklyn, Washington, D.C., San Francisco, Portland, Seattle, and Houston, we created parking scores for neighborhoods, streets and actual Trulia rental listings using Parknav’s proprietary street parking availability data. We did this by looking at how difficult or easy it is to park on five typical days including weekdays and a Saturday, during evening and morning times, on a street-by-street level. Parking scores ranged from 0 to 100, where 0 means parking is impossible and 100 means parking is easy.
We calculated street parking scores by averaging all of the parking probability samples assigned to a given street within a city.
We then calculated listing parking scores by averaging the street parking score of each street that was within a mile distance from actual homes for rent on Trulia between January 2015 and October 2015.
Neighborhood parking scores were calculated by taking the median of listing parking scores belonging to each given neighborhood. For certain cities where listing parking scores were not calculable, we took the median of the street parking scores belonging to each neighborhood. These neighborhood-parking scores were used to power the street parking neighborhood maps that are colored in red-orange.
Maps colored in green, which show the percentage of rental listings purporting to have onsite parking, were created using rental listed on Trulia from January 2015 to October 2015. Neighborhoods with insufficient sample size were not colored/populated.
If you would like to see street-level parking scores that are used in calculating some of our neighborhood-level parking scores, you can click on the following links (embed codes are available for each interactive maps):
New York: Manhattan
https://trulia.cartodb.com/u/cartodb-trulia/viz/18751076-a43d-11e5-9a04-0e31c9be1b51/public_map
New York: Brooklyn
https://trulia.cartodb.com/u/cartodb-trulia/viz/15d545d8-a5dd-11e5-b2ae-0e31c9be1b51/public_map
San Francisco
https://trulia.cartodb.com/u/cartodb-trulia/viz/f6c4176c-a43f-11e5-95bc-0e674067d321/public_map
Seattle
https://trulia.cartodb.com/u/cartodb-trulia/viz/f3cbf8bc-84d8-11e5-a5ed-0e8c56e2ffdb/public_map
Washington DC
https://trulia.cartodb.com/u/cartodb-trulia/viz/5a7b546a-a43f-11e5-a99a-0e787de82d45/public_map
Portland
https://trulia.cartodb.com/u/cartodb-trulia/viz/521fbeae-a440-11e5-8259-0e3ff518bd15/public_map
Houston
https://trulia.cartodb.com/u/cartodb-trulia/viz/0d951c7e-a441-11e5-9ffc-0e674067d321/public_map
Philadelphia
https://trulia.cartodb.com/u/cartodb-trulia/viz/d15b4e92-a43e-11e5-855a-0ecd1babdde5/public_map

