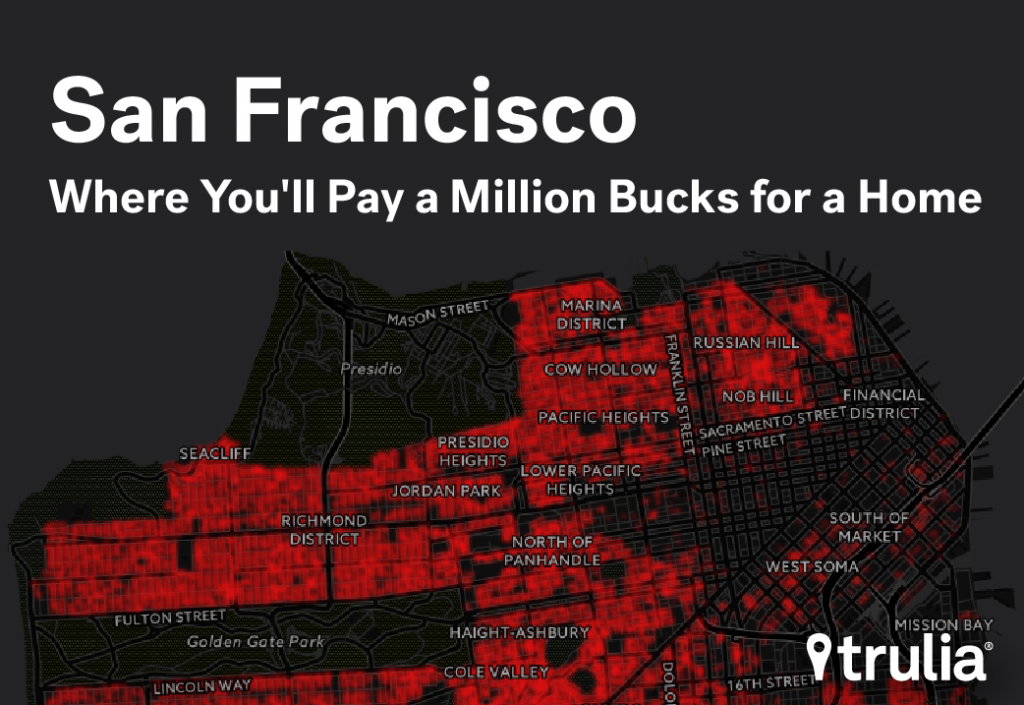
San Francisco is the City by the Bay, and home to the Golden Gate Bridge, sourdough bread, Alcatraz, and more recently, a lot of million dollar homes. Amongst the largest metros, San Francisco metro has the highest share of million dollar homes in the country at 58%. And not surprisingly, the other two Bay Area metros rank #2 (San Jose) and #3 (Oakland). Within the city of San Francisco itself, more than 63% of homes are valued above the $1 million mark.
To find out where million dollar homes have spread the most in the City by the Bay, we calculated the value for every home in San Francisco between January 2010 and September 2015. We define a million dollar home as any home – regardless of whether it’s listed or not – with a value of $1,000,000 or more. As you can see from the map below, the number of homes worth more than a million dollars has grown exponentially in just five years. (Click here to see and get the embed code for animated map of San Francisco below).

At the start of 2010, there were already several hotspots for million dollar homes in San Francisco. The posh neighborhoods of Nob Hill, Noe Valley, Pacific Heights, Potrero Hill, St. Francis Wood, and the Richmond District had some of the largest concentrations of million dollar homes in 2010. However, there were several neighborhoods where most home values were below the million-dollar mark, including the Sunset, the Mission, SOMA, and the Bayview.
| San Francisco Neighborhoods with Largest Share of Million Dollar Homes in 2010 | |||
| # | SF Neighborhood | Share of Million Dollar Homes within San Francisco among all neighborhood, January 2010 | % of million dollar homes within each neighborhood, January 2010 |
| 1 | Pacific Heights | 6.93% | 65.74% |
| 2 | Noe Valley | 6.37% | 54.36% |
| 3 | Russian Hill | 5.04% | 66.67% |
| 4 | Central Richmond | 4.67% | 44.75% |
| 5 | Eureka Valley – Dolores Heights – Castro | 4.67% | 58.44% |
| 6 | Marina | 4.14% | 76.56% |
| 7 | Inner Richmond | 4.06% | 62.31% |
| 8 | South Beach | 3.67% | 28.74% |
| 9 | Cow Hollow | 3.45% | 76.00% |
| 10 | Lake | 3.35% | 80.73% |
| Click here for the complete list of all SF neighborhoods | |||
By September of this year, the number of neighborhoods with sub-million dollar neighborhoods were slim-pickings. Among the top 10 neighborhoods with the highest share of San Francisco’s million dollar homes, only four of the top 10 neighborhoods in 2010 made the list in 2015 – Pacific Heights, Noe Valley, Central Richmond, and South Beach. The new entrants to the list in 2015 are pack-leading Bernal Heights, the Mission, Central Sunset, Parkside, Outer Richmond, and the Inner Sunset.
| San Francisco Neighborhoods with Largest Share of Million Dollar Homes in 2015 | |||
| # | SF Neighborhood | Share of Million Dollar Homes within San Francisco among all neighborhood, September 2015 | % of million dollar homes in each neighborhood, September 2015 |
| 1 | Bernal Heights | 5.46% | 86.56% |
| 2 | Mission | 5.11% | 80.95% |
| 3 | Central Sunset | 4.36% | 82.52% |
| 4 | Noe Valley | 4.26% | 94.65% |
| 5 | Parkside | 3.86% | 72.31% |
| 6 | Central Richmond | 3.82% | 95.64% |
| 7 | Pacific Heights | 3.58% | 88.24% |
| 8 | South Beach | 3.35% | 68.77% |
| 9 | Outer Richmond | 3.13% | 82.19% |
| 10 | Inner Sunset | 3.08% | 95.67% |
| Click here for the complete list of all SF neighborhoods | |||
Now let’s take a look at the neighborhoods that have seen the largest percentage point increase in the share of million dollar homes.
| Neighborhoods with Largest Increase in Share of Million Dollar Homes | ||||
| # | SF Neighborhood | Share of Million Dollar Homes within San Francisco among all neighborhood, January 2010 | Share of Million Dollar Homes within San Francisco among all neighborhood, September 2015 | Percentage Point Change, 2010-2015 |
| 1 | Bernal Heights | 1.15% | 5.46% | +4.30% |
| 2 | Central Sunset | 0.71% | 4.36% | +3.65% |
| 3 | Parkside | 0.40% | 3.86% | +3.46% |
| 4 | Mission | 2.14% | 5.11% | +2.97% |
| 5 | SoMa | 0.63% | 2.23% | +1.59% |
| 6 | Outer Sunset | 0.36% | 1.71% | +1.35% |
| 7 | Outer Richmond | 1.91% | 3.13% | +1.22% |
| 8 | Miraloma Park | 0.53% | 1.70% | +1.17% |
| 9 | Outer Parkside | 0.11% | 1.17% | +1.07% |
| 10 | Inner Parkside | 0.50% | 1.47% | +0.97% |
| Click here for the complete list of all SF neighborhoods | ||||
Bernal Heights also tops the list of neighborhoods that have seen the largest increase in the share of million dollar homes since 2010, increasing nearly fourfold from 1.15% to 5.46%. (Click here to see and get the embed code for animated map of Bernal Heights below).

The Central Sunset comes in a close second, increasing from 0.71% to 4.36%. (Click here to see and get the embed code for animated map of Central Sunset below).

Other notable neighborhoods with significant increases include Parkside, Mission and SOMA. (Click here to see and get the embed code for animated map of Parkside, Mission, and SOMA below).


