


Home Value
Trulia Estimate
$1.49MSince last month
Decreased$480K (-24.4%)Since last year
Decreased$153K (-9.3%)Learn more about this home's value by checking out its Trulia Estimate, the value of nearby homes, and how much similar homes have sold for.
Trulia Estimate
The of this home's value increased by +90% in the last 10 years
| Month | Estimated value |
|---|---|
2026 | |
| October 2026 | $1.49M |
| September 2026 | $1.97M |
| August 2026 | $1.59M |
| July 2026 | $1.8M |
| June 2026 | $1.76M |
| May 2026 | $1.7M |
| April 2026 | $1.63M |
| March 2026 | $1.6M |
| February 2026 | $1.52M |
| January 2026 | $1.67M |
2025 | |
2024 | |
2023 | |
2022 | |
2021 | |
2020 | |
2019 | |
2018 | |
2017 | |
2016 | |
Comparable sales
These are recently sold homes that have a similar location or other similar features to this home, like bedrooms, bathrooms, and square footage. Get a sense of the expected prices in the area by viewing these homes.Address | Distance | Property Type | Sold Price | Sold Date | Bed | Bath | Sqft |
|---|---|---|---|---|---|---|---|
0.13 | Multi-Family Home | $2,450,000 | 03/13/26 | 3 | 1 | 2,769 | |
0.55 | Multi-Family Home | $4,000,000 | 03/26/26 | 1 | 1 | 972 | |
0.03 | Multi-Family Home | $2,337,200 | 03/06/26 | 3 | 2 | 3,130 | |
0.68 | Multi-Family Home | $640,000 | 05/22/26 | 2 | 1 | 956 | |
0.27 | Multi-Family Home | $2,100,000 | 07/31/26 | 4 | 3 | 2,402 | |
0.31 | Multi-Family Home | $1,610,000 | 01/23/26 | 4 | 3.5 | 1,842 | |
0.41 | Multi-Family Home | $1,025,000 | 09/09/26 | 4 | 2.5 | 2,040 | |
0.14 | Multi-Family Home | $2,778,750 | 08/14/26 | 4 | 4.5 | 3,558 | |
0.46 | Multi-Family Home | $3,040,000 | 04/14/26 | 4 | 3 | 3,050 | |
0.65 | Multi-Family Home | $1,375,000 | 11/17/25 | 3 | 3 | 2,327 |
Nearby home prices
Get a sense of expected prices in the area by checking the value of nearby homes.Address | Distance | Price | Bed | Bath | Sqft | Status |
|---|---|---|---|---|---|---|
0.00 | - | 1 | 1 | 675 | Off Market | |
0.00 | - | 1 | 1 | 675 | Off Market | |
0.00 | - | Studio | - | - | Off Market | |
0.00 | - | 1 | 1 | 600 | Off Market | |
0.00 | $1,004,300 | 1 | 1 | 800 | Off Market | |
0.00 | - | 1 | 1 | 800 | Off Market | |
0.00 | - | Studio | - | - | Off Market | |
0.00 | - | 1 | 1 | - | Off Market | |
0.00 | - | 2 | 2 | 1,400 | Off Market | |
0.00 | - | 2 | 2 | 1,000 | Off Market | |
0.00 | - | 1 | 1 | - | Off Market | |
0.00 | $1,678,300 | 2 | 2 | 1,400 | Off Market | |
0.00 | - | 2 | 2 | 1,200 | Off Market | |
0.00 | $1,596,500 | 1 | 1 | - | Off Market | |
0.00 | - | 1 | 1 | - | Off Market | |
0.00 | - | 2 | 2 | - | Off Market | |
0.00 | $2,023,300 | 2 | 2 | - | Off Market | |
0.00 | - | Studio | - | - | Off Market | |
0.00 | - | Studio | - | - | Off Market | |
0.00 | - | 1 | 1 | 750 | Off Market |
Local Information
- Map ViewExplore the area around 52 Appleton St.

- Schools30 Preschool Schools31 Elementary Schools20 Middle Schools19 High Schools

- Shop & Eat

-- mins to
Home Highlights

Multi-Family

1,400 sqft

$1,063/sqft
About this House
This multi-family home is located at 52 Appleton St, Boston, MA. 52 Appleton St is in the South End neighborhood in Boston, MA and in ZIP code 02116. This property has 1 bedroom, 1 bathroom and approximately 1,400 sqft of floor space.
52 Appleton St, Boston, MA 02116 is a 1 bedroom, 1 bathroom, 1,400 sqft multi-family in South End. More recently, it was listed as a rental in August 2019 with an asking price of $3,575 per month. That rental listing was removed on August 22, 2019. This property is not currently displayed as for sale or rent on Trulia. The Trulia Estimate is $1,488,700, with a rent estimate of $4,077/month.
Home Details for 52 Appleton St

|
|---|
Heating & Cooling Heating: Forced AirHeating Fuel: Forced Air |
Appliances & Utilities DishwasherDryerMicrowaveRefrigeratorWasher |
Levels, Entrance, & Accessibility Floors: Hardwood |

|
|---|
Property Type / Style Property Type: Multi Family |

|
|---|
Exterior Home Features Deck |
Parking & Garage Parking: On Street |

|
|---|
Units in Building: 1 |
Price and Tax history
| Date | Event | Price |
|---|---|---|
Aug 22, 2019 Source: Agent Provided | ListingRemoved | $3,575 |
Aug 8, 2019 Source: Agent Provided | Listed For Rent | $3,575 |
Jun 30, 2019 Source: Agent Provided | ListingRemoved | $4,750 |
Jun 25, 2019 Source: Agent Provided | PriceChange | $4,750 Price decreased by 1% |
Mar 13, 2019 Source: Agent Provided | PriceChange | $4,800 Price increased by 33% |
Jan 11, 2019 Source: Agent Provided | PriceChange | $3,600 Price decreased by 25% |
Dec 7, 2018 Source: Agent Provided | PriceChange | $4,800 Price decreased by 1% |
Oct 1, 2018 Source: Agent Provided | PriceChange | $4,850 Price increased by 1% |
Aug 17, 2018 Source: Agent Provided | Listed For Rent | $4,800 |
Apr 10, 2018 Source: Agent Provided | ListingRemoved | $3,350 |
Feb 21, 2018 Source: Agent Provided | Listed For Rent | $3,350 |
Jun 3, 2017 Source: Agent Provided | ListingRemoved | $4,750 |
May 26, 2017 Source: Agent Provided | PriceChange | $4,750 Price increased by 44% |
Apr 25, 2017 Source: Agent Provided | PriceChange | $3,300 Price decreased by 31% |
Apr 10, 2017 Source: Agent Provided | PriceChange | $4,750 Price increased by 48% |
Feb 8, 2017 Source: Agent Provided | Listed For Rent | $3,200 |
Sep 26, 2016 Source: Agent Provided | ListingRemoved | $4,750 |
Apr 23, 2016 Source: Agent Provided | ListingRemoved | $3,400 |
Feb 29, 2016 Source: Agent Provided | Listed For Rent | $3,400 |
Jul 23, 2015 Source: Agent Provided | ListingRemoved | $3,300 |
Jun 12, 2015 Source: Agent Provided | PriceChange | $3,300 Price increased by 3% |
May 21, 2015 Source: Agent Provided | PriceChange | $3,200 Price decreased by 3% |
May 5, 2015 Source: Agent Provided | Listed For Rent | $3,300 |
Market trends in South End
Last updated September 2026
Avg. sale price
$1.25M
$183KMoM
Sale-to-List Price
—
Price per sq ft
$1.2K
$53MoM
Available listings
220
55MoM
Sourced by Trulia Market Trends
Around this home
- Baldwin Early Learning Center
- PK-1
- Public
- 151 Students
NAGreatSchools RatingParent Rating Average No reviews available for this school.
- Blackstone Elementary School
- PK-6
- Public
- 572 Students
3/10GreatSchools RatingParent Rating AverageNo reviews available for this school. - Taylor Elementary School
- PK-6
- Public
- 343 Students
NAGreatSchools RatingParent Rating AverageNo reviews available for this school. - Guild Elementary School
- PK-6
- Public
- 243 Students
4/10GreatSchools RatingParent Rating AverageNo reviews available for this school. - David A. Ellis Elementary School
- PK-6
- Public
- 418 Students
3/10GreatSchools RatingParent Rating AverageNo reviews available for this school. - Haley Pilot School
- PK-8
- Public
- 352 Students
4/10GreatSchools RatingParent Rating AverageEsta escuela es maravillosa!!!!!! Aprender, se divierten, y comparte!Parent Review1y ago - Everett Elementary School
- PK-6
- Public
- 283 Students
5/10GreatSchools RatingParent Rating AverageNo reviews available for this school. - Mendell Elementary School
- PK-6
- Public
- 312 Students
6/10GreatSchools RatingParent Rating AverageNo reviews available for this school. - Franklin D. Roosevelt K-8 School
- PK-8
- Public
- 372 Students
4/10GreatSchools RatingParent Rating AverageNo reviews available for this school. - Harvard-Kent Elementary School
- PK-6
- Public
- 315 Students
4/10GreatSchools RatingParent Rating AverageI did not want to like this school, it was certainly not our top choice. And I still don't like it, I LOVE it and so does my child. I had the choice to put my child back in the lottery for next year, but we are home at Harvard Kent. The principal is amazing. He's so clearly cares about the children and educators. He is engaging, transparent, responsive and only wants the very best for the school in general. Every teacher I meet is kind, caring and invested. I wish I went to a school like this when I was a child. I know Harvard Kent doesn't look that great on paper yet, but the reality of the school is beautiful.Just wait, they are going to be the number one school in Boston in no time.Parent Review4mo ago - James F. Condon School
- PK-8
- Public
- 448 Students
3/10GreatSchools RatingParent Rating AverageThis is the worst i have ever experienced in a learning environement. They have allowed other kids to beat my daughter without giving her any support. If you are looking for a school for your kids to feel unsafe be my guest and let your kids go there.Parent Review6mo ago - Chittick Elementary School
- PK-6
- Public
- 275 Students
4/10GreatSchools RatingParent Rating AverageNo reviews available for this school. - Philbrick Elementary School
- PK-6
- Public
- 131 Students
6/10GreatSchools RatingParent Rating AverageNo reviews available for this school. - John F Kennedy Elementary School
- PK-6
- Public
- 366 Students
5/10GreatSchools RatingParent Rating AverageNo reviews available for this school. - Holland Elementary School
- PK-6
- Public
- 628 Students
5/10GreatSchools RatingParent Rating AverageNo reviews available for this school. - Hurley K-8 School
- PK-8
- Public
- 337 Students
6/10GreatSchools RatingParent Rating AverageNo reviews available for this school. - Lee K-8 School
- PK-8
- Public
- 582 Students
3/10GreatSchools RatingParent Rating AverageSchool is horrible and confusing. First off they allow the 6th grade math teacher to swear at the students, the specials program is super confusing it’s the same special for 4 months everyday And middle school isn't supposed to have the same special everyday. Bullying has became a daily problem at the school. Apparently the period programs are as confusing as the specials program. Because why do the students have double periods, its confusing like really. And the administration team has the absolute guts to blame you for the most wildest thing ever just because of they think you did something but they dont even let you explain from your side of the story. This school sets bad examples and they just like to do their own thing over there. I am mostly speaking for the middle school students, For kindergarten and elementary this school is Average but for middle school its just horrible.Other Review2y ago - Manning Elementary School
- PK-6
- Public
- 150 Students
8/10GreatSchools RatingParent Rating AverageNo reviews available for this school. - Joseph P. Tynan Elementary School
- PK-6
- Public
- 218 Students
5/10GreatSchools RatingParent Rating AverageNo reviews available for this school. - Kilmer K-8 School
- PK-8
- Public
- 391 Students
6/10GreatSchools RatingParent Rating AverageNo reviews available for this school. - Bradley Elementary School
- PK-6
- Public
- 295 Students
9/10GreatSchools RatingParent Rating AverageNo reviews available for this school. - Henderson Inclusion Elementary School
- PK-1
- Public
- 185 Students
NAGreatSchools RatingParent Rating AverageMan I used to go to this school and it was so bad to me, I used to get bullied and punished with my bulliesOther Review1y ago - Dr. Catherine Ellison-Rosa Parks Early Ed School
- PK-3
- Public
- 183 Students
3/10GreatSchools RatingParent Rating AverageNo reviews available for this school. - East Boston Early Childhood Center
- PK-1
- Public
- 139 Students
NAGreatSchools RatingParent Rating AverageNo reviews available for this school. - Haynes Early Education Center
- PK-1
- Public
- 191 Students
NAGreatSchools RatingParent Rating AverageNo reviews available for this school. - Lee Academy
- PK-3
- Public
- 197 Students
2/10GreatSchools RatingParent Rating AverageSchools bullying policy is basically non existent, school sweeps alot under the rugs . Not best for children's mental healthParent Review1y ago - Orchard Gardens K-8 School
- PK-8
- Public
- 716 Students
3/10GreatSchools RatingParent Rating AverageThis school is terrible.The student body has extreme behavior issues that prevent most teaching and learning from happening. In classrooms you will see kids throwing things and screaming, and ignoring staff. Students are mean to each other and disrespectful to adults. Academic performance is very low - only 5-10% of students are at grade level.There are no real consequences for student misbehavior or academic failure. Safety is a serious concern. There are constant student fights, property damage, and acts of violence against other students and staff. Used needles are regularly found on school grounds (staff does their best to mitigate this, but it is still extremely unsafe). I recommend that parents send their children elsewhere.Other Review1y ago - Elc - West Zone
- PK-1
- Public
- 76 Students
NAGreatSchools RatingParent Rating AverageNo reviews available for this school. - Holmes Elementary School
- PK-6
- Public
- 301 Students
5/10GreatSchools RatingParent Rating AverageThere is a new principal this year named Dr. Odom who is working so hard to change the school for the better.Parent Review2y ago - Curley K-8 School
- PK-8
- Public
- 955 Students
4/10GreatSchools RatingParent Rating AverageThis school is the very reason as to why i had an IEP. No, i never have been diagnosed with any autism, adhd, or anything neurodivergent related. My only issue was focusing in class. When i was in kindergarden, my teacher would have ZERO patience for me. When ever i would have trouble understanding in class, she would email my mother, call her, telling her that i have disabilities, and that i need a doctor, and that i need an iep. And soon enough, they had my mother go and sign these papers that allowed me to be pulled out of class by these teachers before and after transferring from this school. The worst part about all of this is that this specific teacher still teaches in this school, and sadly i cannot release her name. These teachers have no patience whatsoever. It was a hassle to get me out of this iep. It took until the 10th grade to get rid of it. So no, i do not recommend this school, especially if your child has issues focusing. Not everything is neurodivergent related. Everybody learns in different ways.Other Review4mo ago
Neighborhood Overview

Neighborhood stats provided by third party data sources.
What Locals Say about South End
This October
Trick-or-Treat Score
Built from what locals say about South End.- 95% say there are sidewalks
- 61% say there's holiday spirit
- 58% say neighbors are friendly
Trulia Trick or TreatStart Ghost Hunt
At least 270 Trulia users voted on each feature.

95 % Say there are sidewalks

95 % Say it's dog friendly

94 % Say it's walkable to restaurants

92 % Say it's walkable to grocery stores

86 % Say streets are well-lit

77 % Say people would walk alone at night

65 % Say kids play outside

61 % Say there's holiday spirit

58 % Say neighbors are friendly

50 % Say they plan to stay for at least 5 years

46 % Say there are community events

39 % Say it's quiet

38 % Say parking is easy

37 % Say yards are well-kept

28 % Say there's wildlife

23 % Say car is needed
Sourced by Trulia users. Learn more about our methodology.
LGBTQ Local Legal Protections
LGBTQ Local Legal Protections


Frequently asked questions about 52 Appleton St
- What is 52 Appleton St estimated to be worth?Trulia's estimated value for 52 Appleton St in Boston, MA is $1,488,700.
- Is Boston a buyer's or seller's market?Boston is currently a buyer's market, based on recent for-sale activity.
- What's the median sale price in Boston?The median sale price in Boston is $1.25M. That is down $183K from the prior month.
- What do residents say about the South End neighborhood?Residents describe the South End neighborhood in Boston, MA as pedestrian-friendly, dog-friendly, and walkable to restaurants. See recently sold homes in South End, Boston.
- Does 52 Appleton St have laundry facilities?Yes, 52 Appleton St in Boston, MA has in-unit laundry.
- Does 52 Appleton St have parking?Yes, 52 Appleton St in Boston, MA has on-site parking.
Explore by feature - Pet Friendly
 SPECIAL OFFERPET FRIENDLY
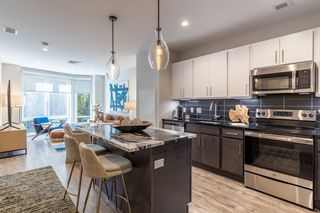 SPECIAL OFFERPET FRIENDLY
 SPECIAL OFFERPET FRIENDLY
 SPECIAL OFFERPET FRIENDLY$3,150 - $6,410/moFees may apply
 1-2 bd
 1-3 baThe Franklin at Hancock Village | 201 Sherman Rd,
Chestnut Hill, MA 02467 SPECIAL OFFERPET FRIENDLY
 SPECIAL OFFERPET FRIENDLY
- SPECIAL OFFERPET FRIENDLY
 PET FRIENDLYTotal price$2,899 - $4,779/moStudio-3 bd1-2 baThe Charley | 46 Soldiers Field Pl,
Brighton, MA 02135 PET FRIENDLY
 NEW - 1 DAY AGOSPECIAL OFFERPET FRIENDLY
Explore by feature - Garage
- SPECIAL OFFERPET FRIENDLY
- SPECIAL OFFERPET FRIENDLY
- SPECIAL OFFERPET FRIENDLY$3,150 - $6,410/moFees may apply1-2 bd1-3 baThe Franklin at Hancock Village | 201 Sherman Rd,
Chestnut Hill, MA 02467  SPECIAL OFFERPET FRIENDLY
 SPECIAL OFFERPET FRIENDLYFURNISHED
 NEW - 1 DAY AGOSPECIAL OFFER
 NEW - 1 DAY AGOSPECIAL OFFER
 SPECIAL OFFERTotal price$3,650 - $6,450/moStudio-2 bd1-2 baThe Lofts at Atlantic Wharf | 530 Atlantic Ave,
Boston, MA 02110 SPECIAL OFFERPET FRIENDLYFURNISHED
 NEW - 1 DAY AGOSPECIAL OFFERFURNISHED
Explore by feature - Air Conditioning
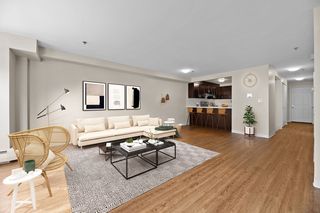 SPECIAL OFFERINCOME RESTRICTED
- SPECIAL OFFERPET FRIENDLY$3,150 - $6,410/moFees may apply1-2 bd1-3 baThe Franklin at Hancock Village | 201 Sherman Rd,
Chestnut Hill, MA 02467 - SPECIAL OFFERPET FRIENDLY
- SPECIAL OFFERPET FRIENDLY
- SPECIAL OFFERPET FRIENDLY
- PET FRIENDLYTotal price$2,899 - $4,779/moStudio-3 bd1-2 baThe Charley | 46 Soldiers Field Pl,
Brighton, MA 02135 - SPECIAL OFFERPET FRIENDLYFURNISHED
- NEW - 1 DAY AGOSPECIAL OFFER
- NEW - 1 DAY AGOSPECIAL OFFER
 $2,300 - $3,695/moFees may applyStudio-2 bd1 baParker Hill | 170 Parker Hill Ave,
Roxbury Crossing, MA 02120
Explore by feature - Pool
 NEW - 51 MIN AGOSPECIAL OFFERPET FRIENDLY
 SPECIAL OFFERPET FRIENDLY
 NEW - 5 HRS AGOSPECIAL OFFERPET FRIENDLY
 NEW - 6 HRS AGOPET FRIENDLY
 NEW - 7 HRS AGOSPECIAL OFFERTotal price$2,958 - $6,042/moStudio-3 bd1-3 baOverlook at St. Gabriel's | 175 Washington St,
Brighton, MA 02135 NEW - 10 HRS AGO
 APPLY INSTANTLY
 NEW - 1 DAY AGOSPECIAL OFFERPET FRIENDLY
 NEW - 1 DAY AGOPET FRIENDLY$3,630 - $6,925/moFees may applyStudio-2 bd1-2 baPierce Boston | 200 Brookline Ave,
Boston, MA 02215 NEW - 1 DAY AGOSPECIAL OFFERPET FRIENDLY
Explore by feature - Washer/dryer
- SPECIAL OFFERPET FRIENDLY
- SPECIAL OFFERINCOME RESTRICTED
- SPECIAL OFFERPET FRIENDLY$3,150 - $6,410/moFees may apply1-2 bd1-3 baThe Franklin at Hancock Village | 201 Sherman Rd,
Chestnut Hill, MA 02467 - SPECIAL OFFERPET FRIENDLY
- SPECIAL OFFERPET FRIENDLY
- SPECIAL OFFERPET FRIENDLY
- PET FRIENDLYTotal price$2,899 - $4,779/moStudio-3 bd1-2 baThe Charley | 46 Soldiers Field Pl,
Brighton, MA 02135 - PET FRIENDLY
- NEW - 1 DAY AGOSPECIAL OFFERPET FRIENDLY
- SPECIAL OFFERPET FRIENDLY
Explore by feature - Outdoor Space

 NEW - 2 DAYS AGOAPPLY INSTANTLYPET FRIENDLY
 NEW - 2 DAYS AGOAPPLY INSTANTLYPET FRIENDLY
 NEW - 2 DAYS AGOAPPLY INSTANTLYPET FRIENDLY
 NEW - 1 DAY AGOAPPLY INSTANTLYPET FRIENDLY
 NEW - 1 DAY AGOAPPLY INSTANTLYPET FRIENDLY
 PET FRIENDLY
 APPLY INSTANTLY
 NEW - 1 DAY AGOAPPLY INSTANTLY
 NEW - 2 DAYS AGOAPPLY INSTANTLYPET FRIENDLY
Apartments for Rent
- NEW - 1 DAY AGO

- NEW - 1 DAY AGO
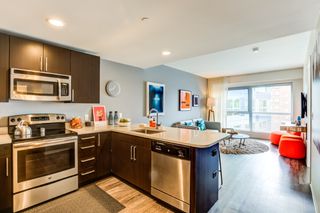 NEW - 1 DAY AGO
- NEW - 1 DAY AGOPET FRIENDLY
 NEW - 2 DAYS AGOPET FRIENDLY
- INCOME RESTRICTED
 PET FRIENDLY$2,650 - $4,650/moFees may applyStudio-2 bd1-2 baVerge Residences | 16-20 Medford St,
Somerville, MA 02143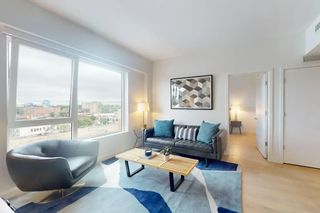 $3,450 - $4,950/moFees may apply1-2 bd1-2 ba55 BRIGHTON AT PACKARD CROSSING | 55 Brighton Ave,
Allston, MA 02134- PET FRIENDLYFURNISHED
 PET FRIENDLYTotal price$2,890 - $3,637/moStudio-1 bd1 baForte at 1440 Beacon | 1440 Beacon St,
Brookline, MA 02446 PET FRIENDLY
- $2,300 - $3,695/moFees may applyStudio-2 bd1 baParker Hill | 170 Parker Hill Ave,
Roxbury Crossing, MA 02120  PET FRIENDLY
- PET FRIENDLY
 See more homes for rent inBoston
Off Market Homes Near 52 Appleton St
 SOLDOCT 23, 2026Lauren Holleran Team, Gibson Sotheby's International Realty
 SOLDOCT 23, 2026Ricardo Rodriguez & Associates Group, Coldwell Banker Realty - Boston
 SOLDOCT 23, 2026Christine McConville, Coldwell Banker Realty - Boston
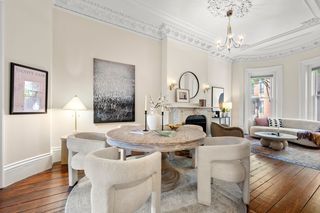 SOLDOCT 23, 2026Sprogis Neale Doherty Team, Sprogis & Neale Real Estate
 SOLDOCT 23, 2026Angelique Stanley, HomeSmart First Class Realty
 SOLDOCT 23, 2026Maureen McElroy, Jamaica Hill Realty, Inc.
 SOLDOCT 23, 2026Fine Homes Group, Keller Williams Realty Boston-Metro | Back Bay
 SOLDOCT 23, 2026Kirtan Patel, Coldwell Banker Realty - Westford
 SOLDOCT 23, 2026Prospect Boston Team, Efron Property Group, LLC
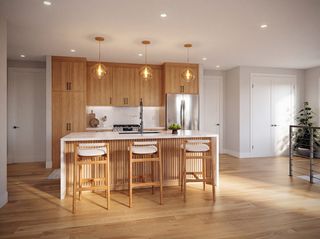 SOLDOCT 23, 2026Elevated Boston Team, Elevated Realty, LLC
 See more homes for sale inBoston
Homes for sale near 52 Appleton St
 Brian Tierney, Rondeau/Tierney Real Estate, LLC
 Vena Priestly, Rise Signature Homes
 Tana Bramley, Boston Realty Advisors
 Saad Munir, ENRG Global Realty, LLC
- See more homes for sale inBoston


- Results are loading