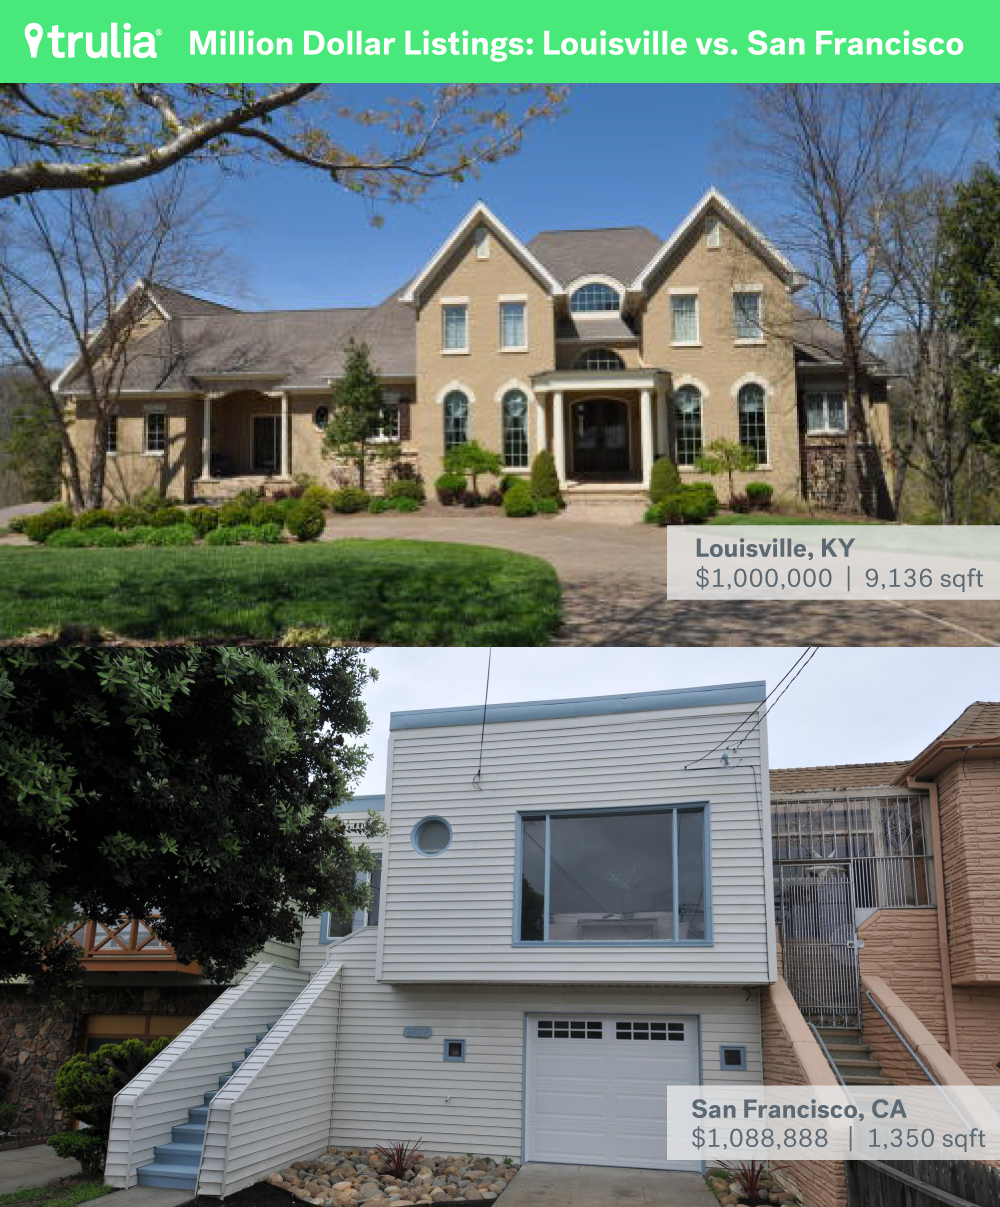
The million-dollar home used to be a rarity in the United States, but is now becoming commonplace in several of America’s largest housing markets. Among the 100 largest metros, San Francisco has seen the largest increase in the share of million dollar homes in the country, growing to 57.4% in 2016 from 19.6% of homes in 2012. It’s followed by two other Bay Area metros, No. 2 San Jose and No. 3 Oakland. But the phenomenon is not limited to the SF Bay Area: metros in Southern California, Hawaii, and the Northeast have also seen noticeable gains, having nearly doubled the share of million dollar homes in just four years.
| Rank | U.S. Metro | % of $1 million+ Homes in Metro, May 2012 | % of $1 million+ Homes in Metro, May 2016 | Percentage Point Change | |
|---|---|---|---|---|---|
| Click here to download the data for the 100 biggest metros. | |||||
| 1 | San Francisco, CA | 19.6% | 57.4% | +37.8 | |
| 2 | San Jose, CA | 17.4% | 46.3% | +28.9 | |
| 3 | Oakland, CA | 5.2% | 19.7% | +14.5 | |
| 4 | Orange County, CA | 7.1% | 16.1% | +8.9 | |
| 5 | Los Angeles, CA | 8.0% | 16.3% | +8.3 | |
| 6 | Honolulu, HI | 8.1% | 15.4% | +7.3 | |
| 7 | San Diego, CA | 5.4% | 10.7% | +5.2 | |
| 8 | New York, NY | 7.0% | 12.0% | +4.9 | |
| 9 | Ventura County, CA | 4.3% | 9.0% | +4.6 | |
| 10 | Seattle, WA | 2.5% | 7.0% | +4.5 | |
We also wanted to find out where million dollar homes have spread the most within these regions, so we calculated the value for every home in each region’s neighborhoods between May 2012 and May 2016. We define a million-dollar home as any home – regardless of whether it’s listed for sale or not – with a value of $1 million or more. Here is the breakdown of neighborhoods experiencing the largest increase within each region.
San Francisco Bay Area
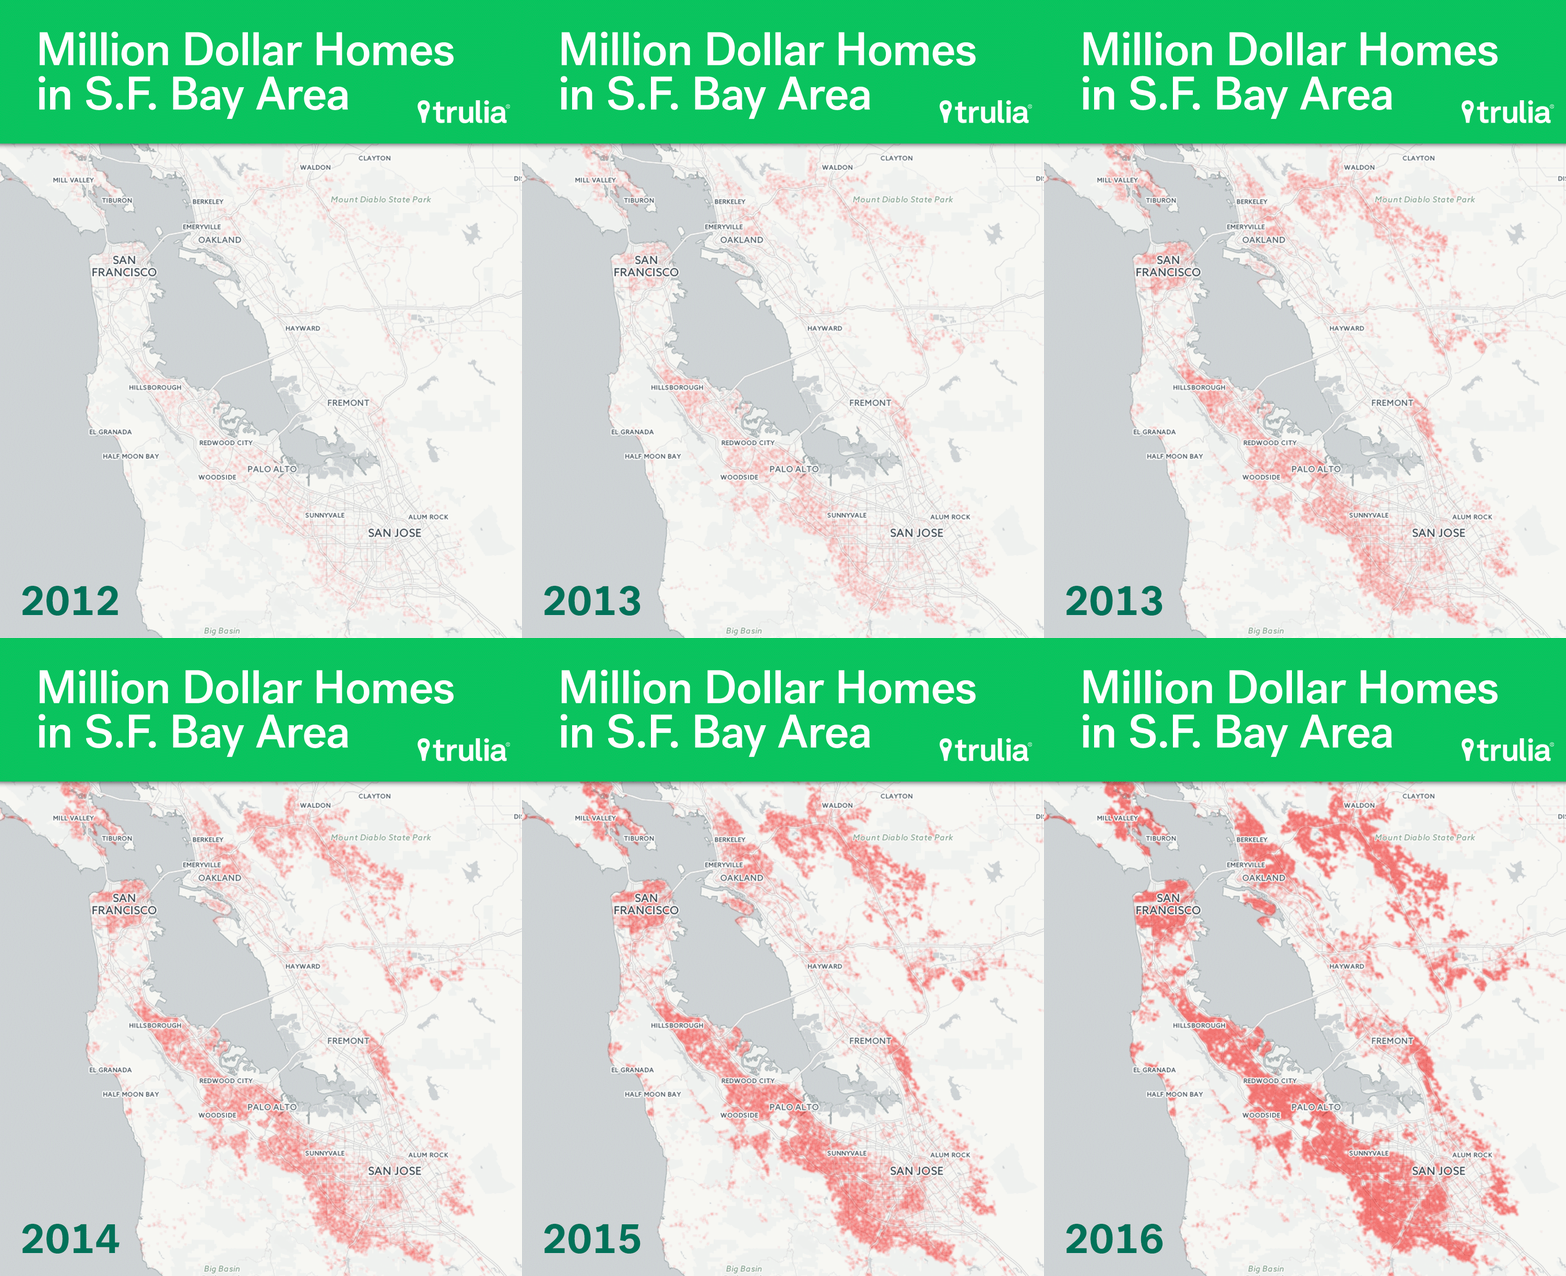
Each of the three biggest Bay Area metros – San Francisco, San Jose, and Oakland – have seen massive increases in the share of seven figure homes. There are over twice as many in San Francisco and San Jose, and nearly four times as many in Oakland. While the neighborhood with the largest increase over the past four years is actually in the City of San Francisco – Westwood Park – the other four of the top five are in the small suburb of San Mateo, which is sandwiched between job-rich San Jose and San Francisco.
| Bay Area Neighborhoods with largest Increase of Million Dollar Homes, 2012-2016 | ||||
| Bay Area Neighborhood | % of Million Homes in Neighborhood, May 2012 | % of Million Homes in Neighborhood, May 2016 | Percentage Point Change | |
| 1 | Westwood Park, San Francisco | 2.9% | 96.0% | +93.0 |
| 2 | Nineteenth Avenue, San Mateo | 10.3% | 100% | +89.7 |
| 3 | Southeast Hillsdale, San Mateo | 12.9% | 98.8% | +85.9 |
| 4 | Northwest Hillsdale, San Mateo | 17.5% | 98.2% | +80.7 |
| 5 | Fiesta Gardens, San Mateo | 4.9% | 85.4% | +80.5 |
| Click here for the complete list of all Bay Area neighborhoods | ||||
Southern California
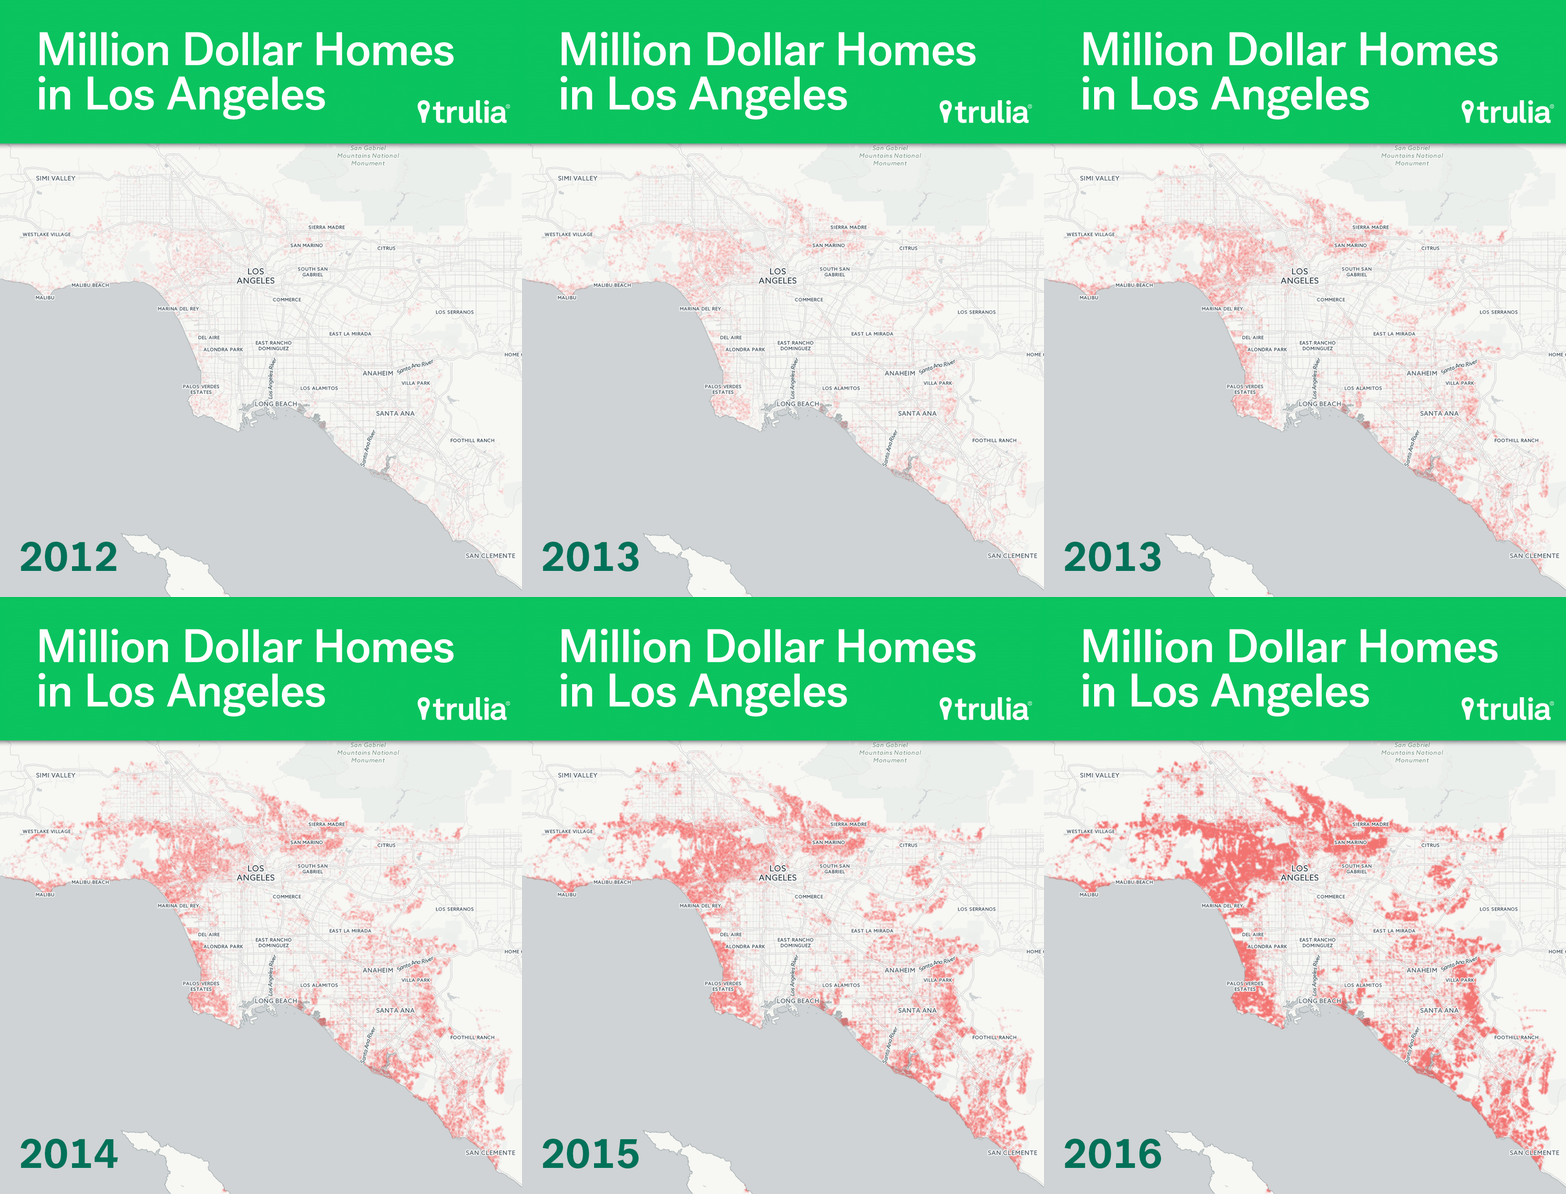
Each of the major Southern California housing markets – Los Angeles, Orange County, Ventura County, and San Diego – have witnessed a doubling in the share of million dollar homes over the past few years. Looking at the Los Angeles-Orange County – Ventura County area, the five neighborhoods with the largest increases are all in Los Angeles County. Pacific Colony and Pacific South Bay neighborhoods in Torrance have seen the largest increase, and sit on or near the border of the ocean-side town of Redondo Beach. Emerald Isle and College Hills neighborhoods – nestled in the foothills of the San Gabriel Mountains in Glendale – have also seen significant changes in the share of homes worth over million.
| Los Angeles/Orange County Neighborhoods with largest Increase of Million Dollar Homes, 2012-2016 | ||||
| LA/OC Neighborhood | % of Million Homes in Neighborhood, May 2012 | % of Million Homes in Neighborhood, May 2016 | Percentage Point Change | |
| 1 | Pacific Colony, Torrance | 13.8% | 94.7% | +80.9 |
| 2 | Pacific South Bay, Torrance | 0.8% | 67.2% | +66.4 |
| 3 | South Carthay, Los Angeles | 42.7% | 97.2% | +54.5 |
| 4 | Emerald Isle, Glendale | 26.1% | 80.0% | +54.0 |
| 5 | College Hills, Glendale | 34.0% | 86.5% | +52.5 |
| Click here for the complete list of all Los Angeles and Orange County neighborhoods | ||||
Those looking for San Diego neighborhoods with the most recent additions to the million-dollar club can either head for the hills or head for the coast. The two neighborhoods with the largest increase in million dollar homes are Bella Lago in mountainous Chula Vista and Rancho Ecncantado in the hills above Mirimar. The other three neighborhoods growing in seven figure homes are all near the coast, with Sunset Cliffs and North City sitting on or near the Pacific Ocean, and Roseville – Fleet Ridge sitting on San Diego Bay.
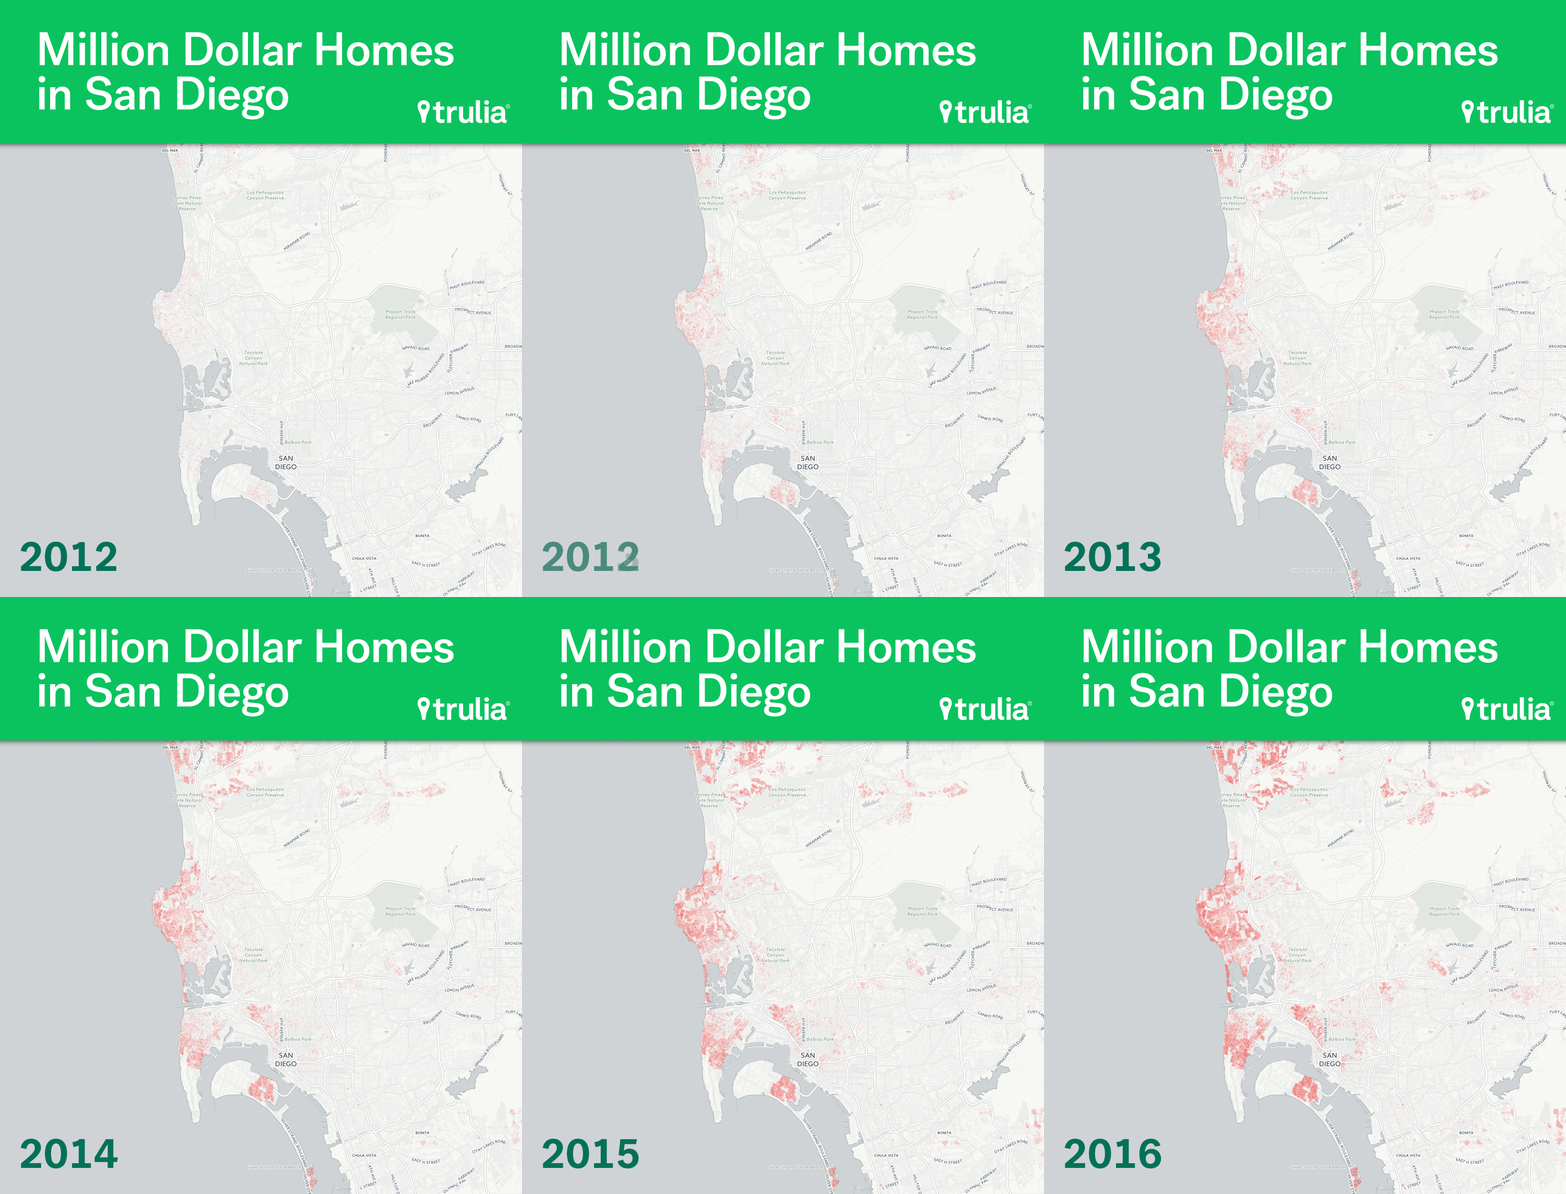
| San Diego Neighborhoods with Largest Increase of Million Dollar Homes, 2012-2016 | ||||
| San Diego Neighborhood | % of Million Homes in Neighborhood, May 2012 | % of Million Homes in Neighborhood, May 2016 | Percentage Point Change | |
| 1 | Bella Lago, Chula Vista | 2.1% | 54.5% | +52.4 |
| 2 | Rancho Encantado, San Diego | 32.7% | 80.4% | +47.7 |
| 3 | Sunset Cliffs, San Diego | 50.5% | 88.8% | +38.4 |
| 4 | Roseville – Fleet Ridge, San Diego | 22.6% | 58.8% | +36.2 |
| 5 | North City, San Diego | 39.9% | 75.9% | +36.0 |
| Click here for the complete list of all San Diego neighborhoods | ||||
New York
Of the top 10 metros that had the largest increase in million dollar homes, New York actually saw the smallest relative increase, moving to 12 % of homes from 7%. But that relatively small increase was heavily concentrated in Brooklyn. Of the five neighborhoods that witnessed that great increase, all five are in Brooklyn. Bedford Stuyvesant increased the most, moving from just under 2% of homes valued at least a million dollars to 56.5%.
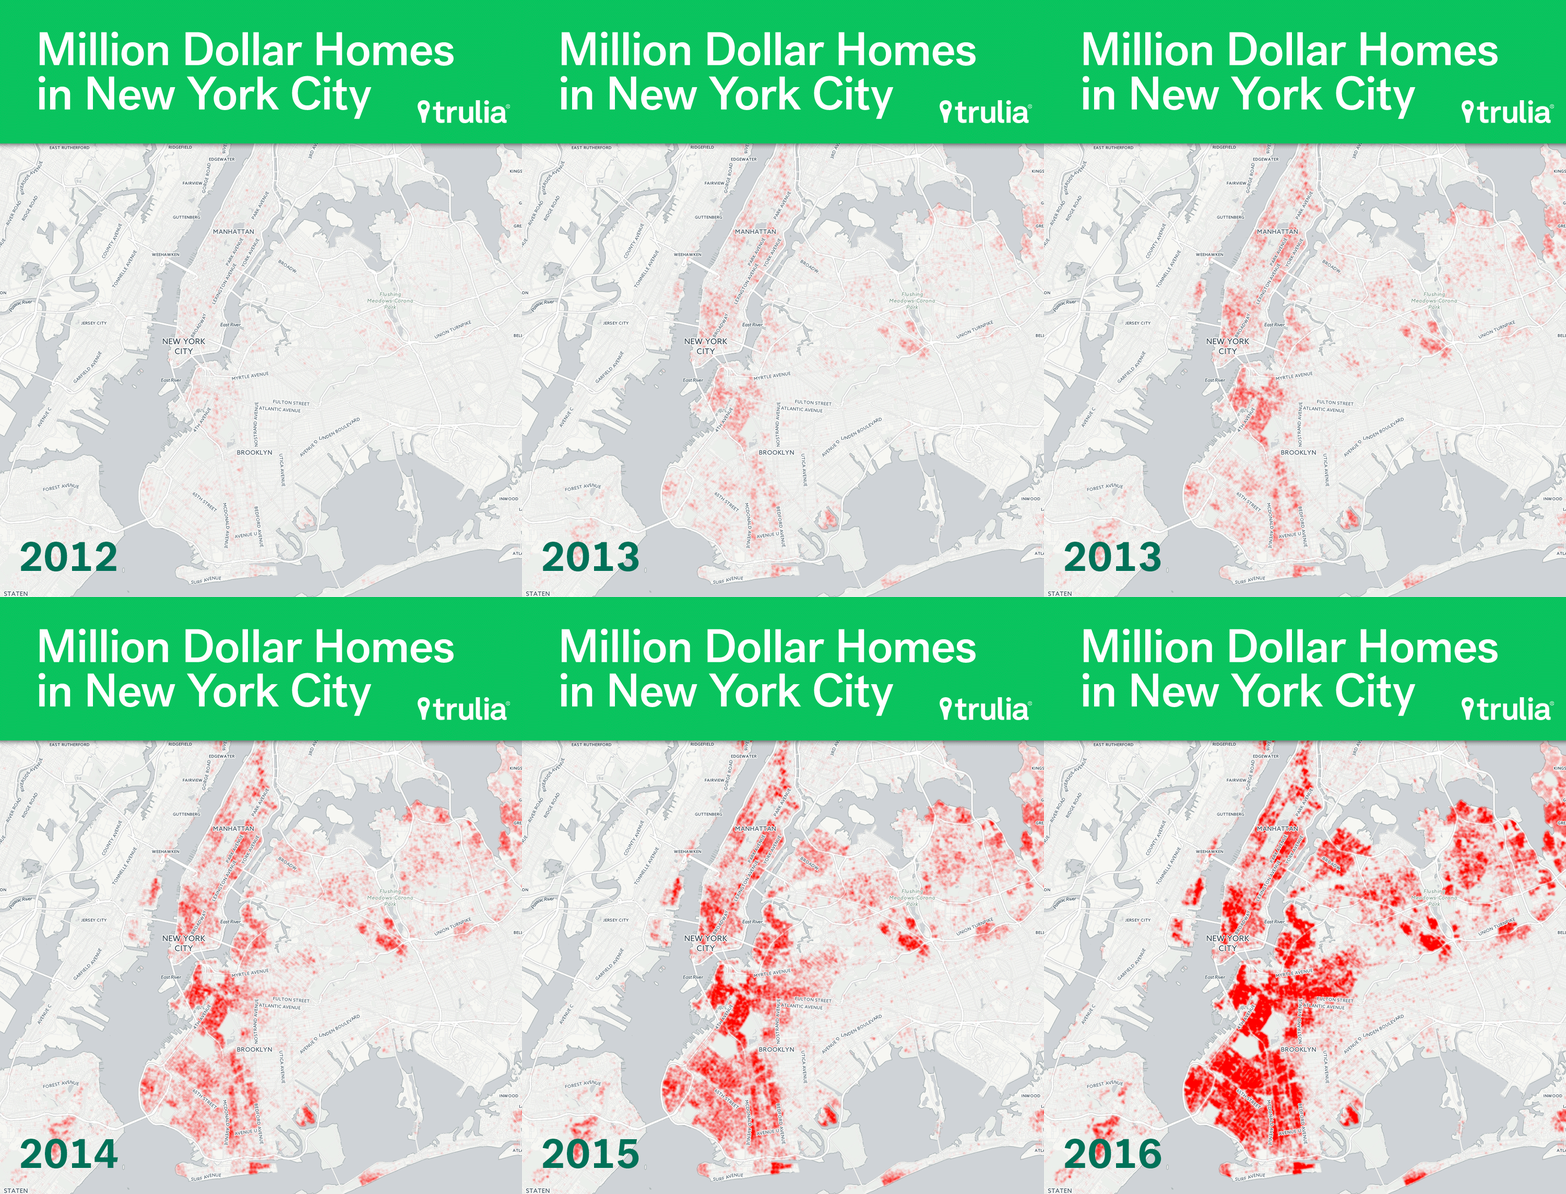
| New York Neighborhoods with Largest Increase of Million Dollar Homes, 2012-2016 | ||||
| New York Neighborhood | % of Million Homes in Neighborhood, May 2012 | % of Million Homes in Neighborhood, May 2016 | Percentage Point Change | |
| 1 | Bedford Stuyvesant, Brooklyn | 1.7% | 56.5% | +54.8 |
| 2 | Greenwood, Brooklyn | 8.4% | 56.7% | +48.3 |
| 3 | Crown Heights, Brooklyn | 2.6% | 50.4% | +47.8 |
| 4 | Greenpoint, Brooklyn | 29.2% | 76.3% | +47.1 |
| 5 | Borough Park, Brooklyn | 9.9% | 56.9% | +47.0 |
| Click here for the complete list of all New York neighborhoods | ||||
Honolulu
Million dollar homes in the Land of Aloha have nearly doubled since 2012, but like New York, most of the growth was concentrated in just a few areas. Each of the top 5 neighborhoods with the largest increase in Honolulu are close to majestic Diamond Head National Landmark. While the number of million-dollar home is sharply increasing in these neighborhoods, there are a few where more affordable homes are abundant, as both the Kaimuki and Hawaii Kai neighborhoods have fewer than 50% of homes over the seven figure mark.
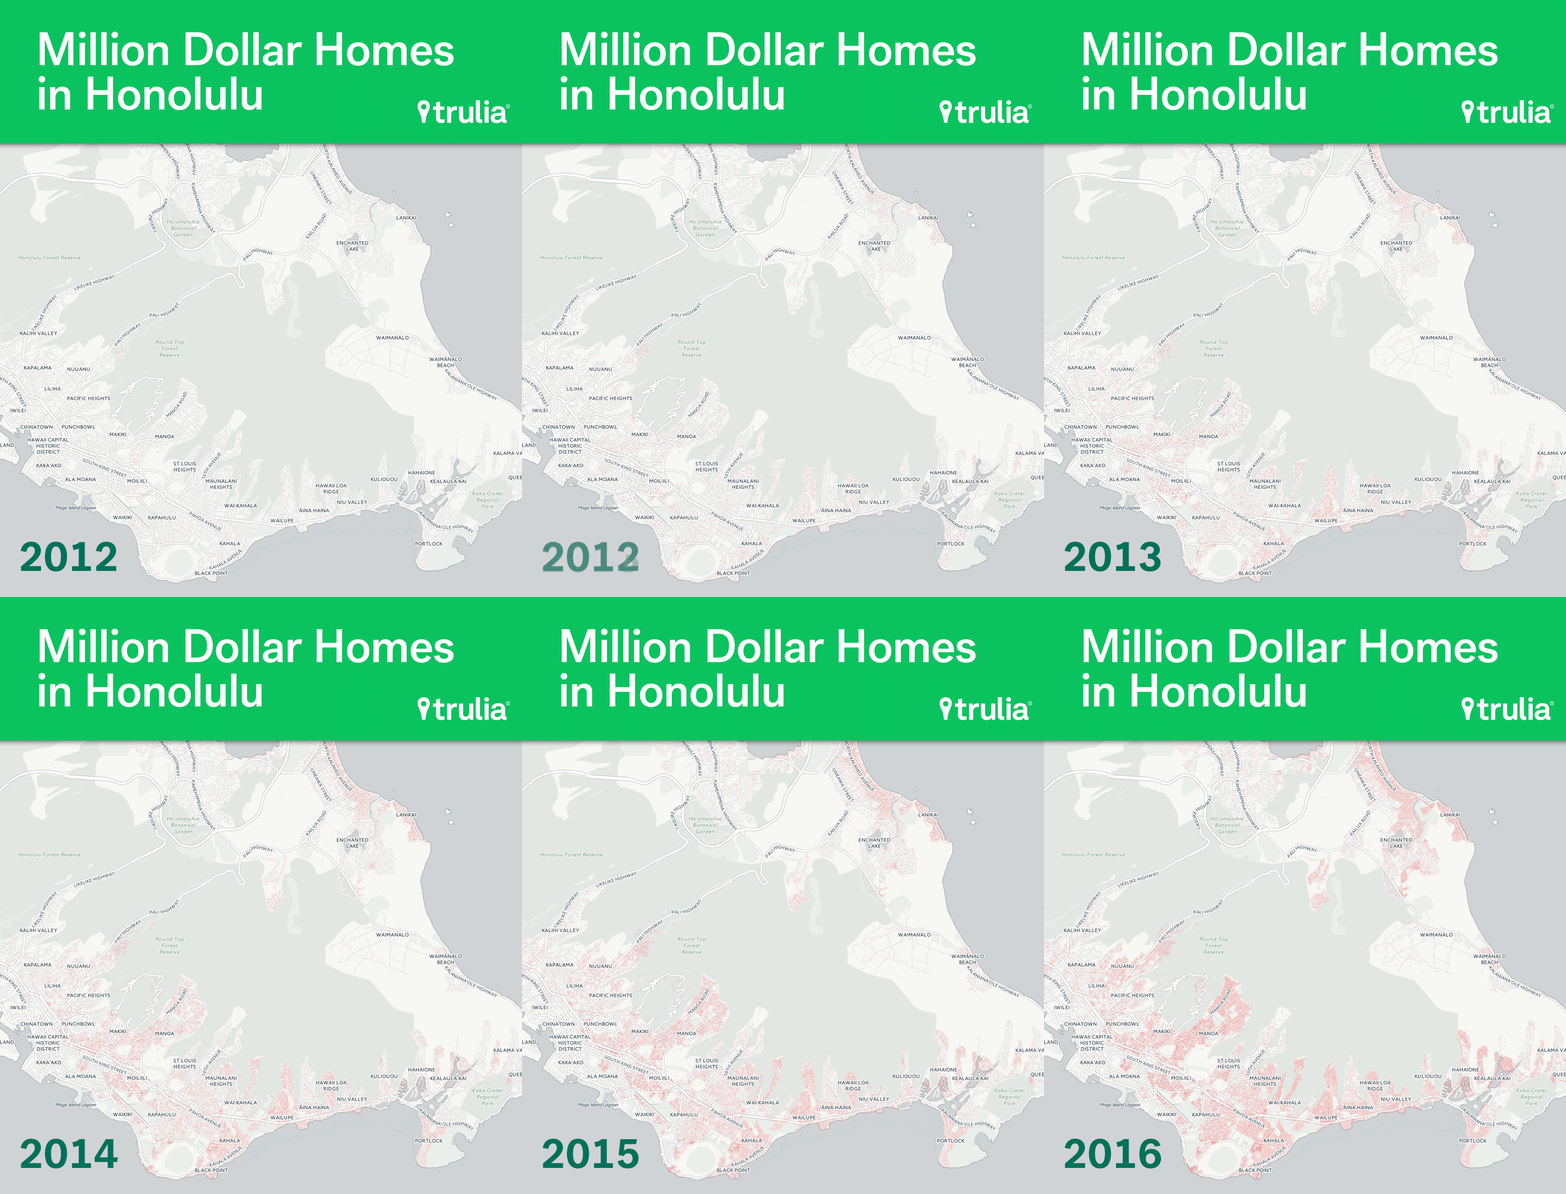
| Honolulu Neighborhoods with Largest Increase of Million Dollar Homes, 2012-2016 | ||||
| Honolulu Neighborhood | % of Million Homes in Neighborhood, May 2012 | % of Million Homes in Neighborhood, May 2016 | Percentage Point Change | |
| 1 | Manoa, Honolulu | 28.2% | 57.0% | +28.8 |
| 2 | Kaimuki, Honolulu | 24.4% | 48.1% | +23.7 |
| 3 | Kuliouou-Kalani Iki, Honolulu | 48.2% | 62.0% | +13.8 |
| 4 | Hawaii Kai, Honolulu | 16.1% | 29.8% | +13.7 |
| 5 | Waialae-Kahala, Honolulu | 54.7% | 68.4% | +13.6 |
| Click here for the complete list of all Honolulu neighborhoods | ||||
Seattle
Even though only 7% of homes in metro Seattle are valued at over a million – the lowest of the top ten metros – the number has grown nearly threefold since 2012. The Bridle Trails neighborhood of Bellevue has witnessed the largest increase, but Market-Downtown in Kirkland is a close second. Each has seen increase of million dollar homes by over 34 percentage points, while the other three neighborhoods have seen increases of 29-34 percentage points.
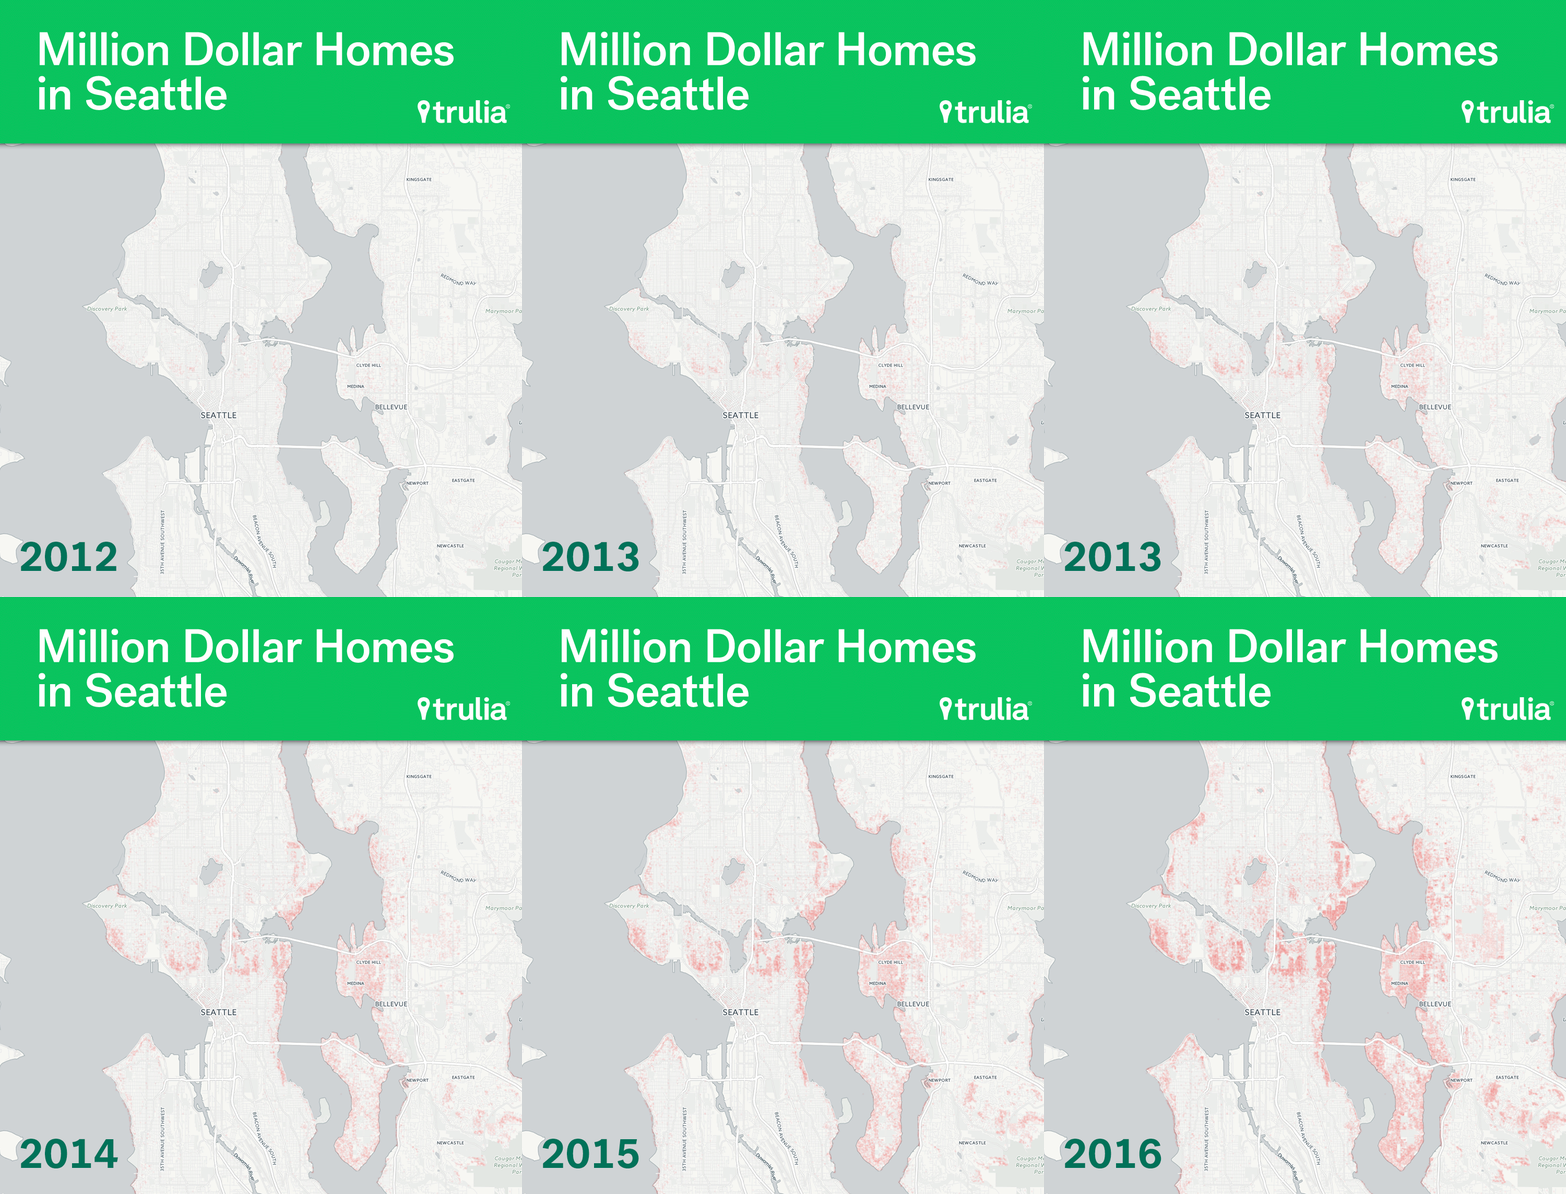
| Seattle Neighborhoods with Largest Increase of Million Dollar Homes, 2012-2016 | ||||
| Seattle Neighborhood | % of Million Homes in Neighborhood, May 2012 | % of Million Homes in Neighborhood, May 2016 | Percentage Point Change | |
| 1 | Bridle Trails, Bellevue | 14.2% | 49.0% | +34.8 |
| 2 | Market-Downtown, Kirkland | 42.4% | 77.0% | +34.6 |
| 3 | Montlake, Seattle | 11.0% | 45.0% | +33.9 |
| 4 | Laurelhurst, Seattle | 37.1% | 70.9% | +33.7 |
| 5 | Enatai, Bellevue | 29.2% | 58.4% | +29.2 |
| Click here for the complete list of all Seattle neighborhoods | ||||
Miami and Boston
While Miami and Boston just missed the cut of metros with the largest increase in million dollar homes, each show an interesting pattern of where up-and-coming seven-figure neighborhoods are located. In Miami, the million-dollar hotspots are predominantly along the isles of Fort Lauderdale and Miami Beach, while in Boston they are either located downtown or in suburban Roxbury Crossing or Cambridge.
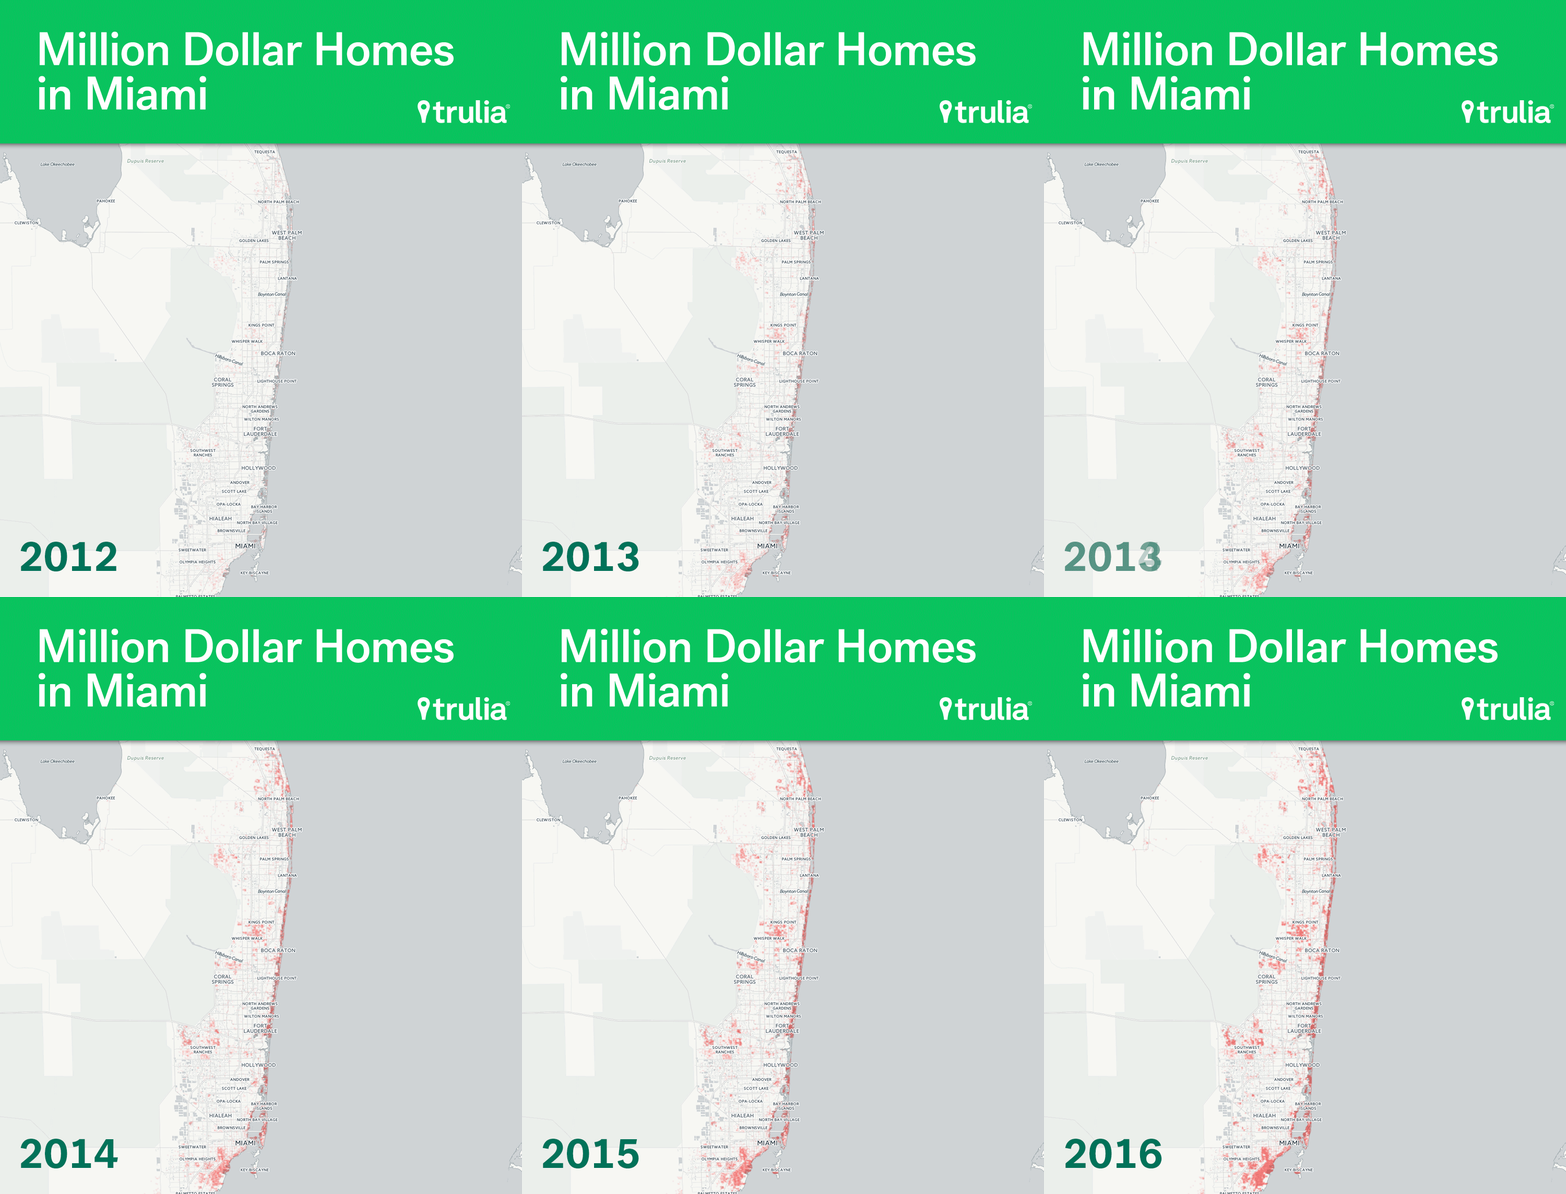
| Miami Neighborhoods with Largest Increase of Million Dollar Homes, 2012-2016 | ||||
| Miami Neighborhood | % of Million Homes in Neighborhood, May 2012 | % of Million Homes in Neighborhood, May 2016 | Percentage Point Change | |
| 1 | Navarrea Isle, Ft. Lauderdale | 51.5% | 93.9% | +42.4 |
| 2 | Palm Beach Isles, Riviera Beach | 19.7% | 49.7% | +30.1 |
| 3 | La Gorce, Miami Beach | 66.5% | 96.1% | +29.5 |
| 4 | Lauderdale Harbours, Ft. Lauderdale | 28.2% | 57.1% | +28.9 |
| 5 | Biscayne Island, Miami Beach | 25.7% | 49.3% | +23.7 |
| Click here for the complete list of all Miami neighborhoods | ||||
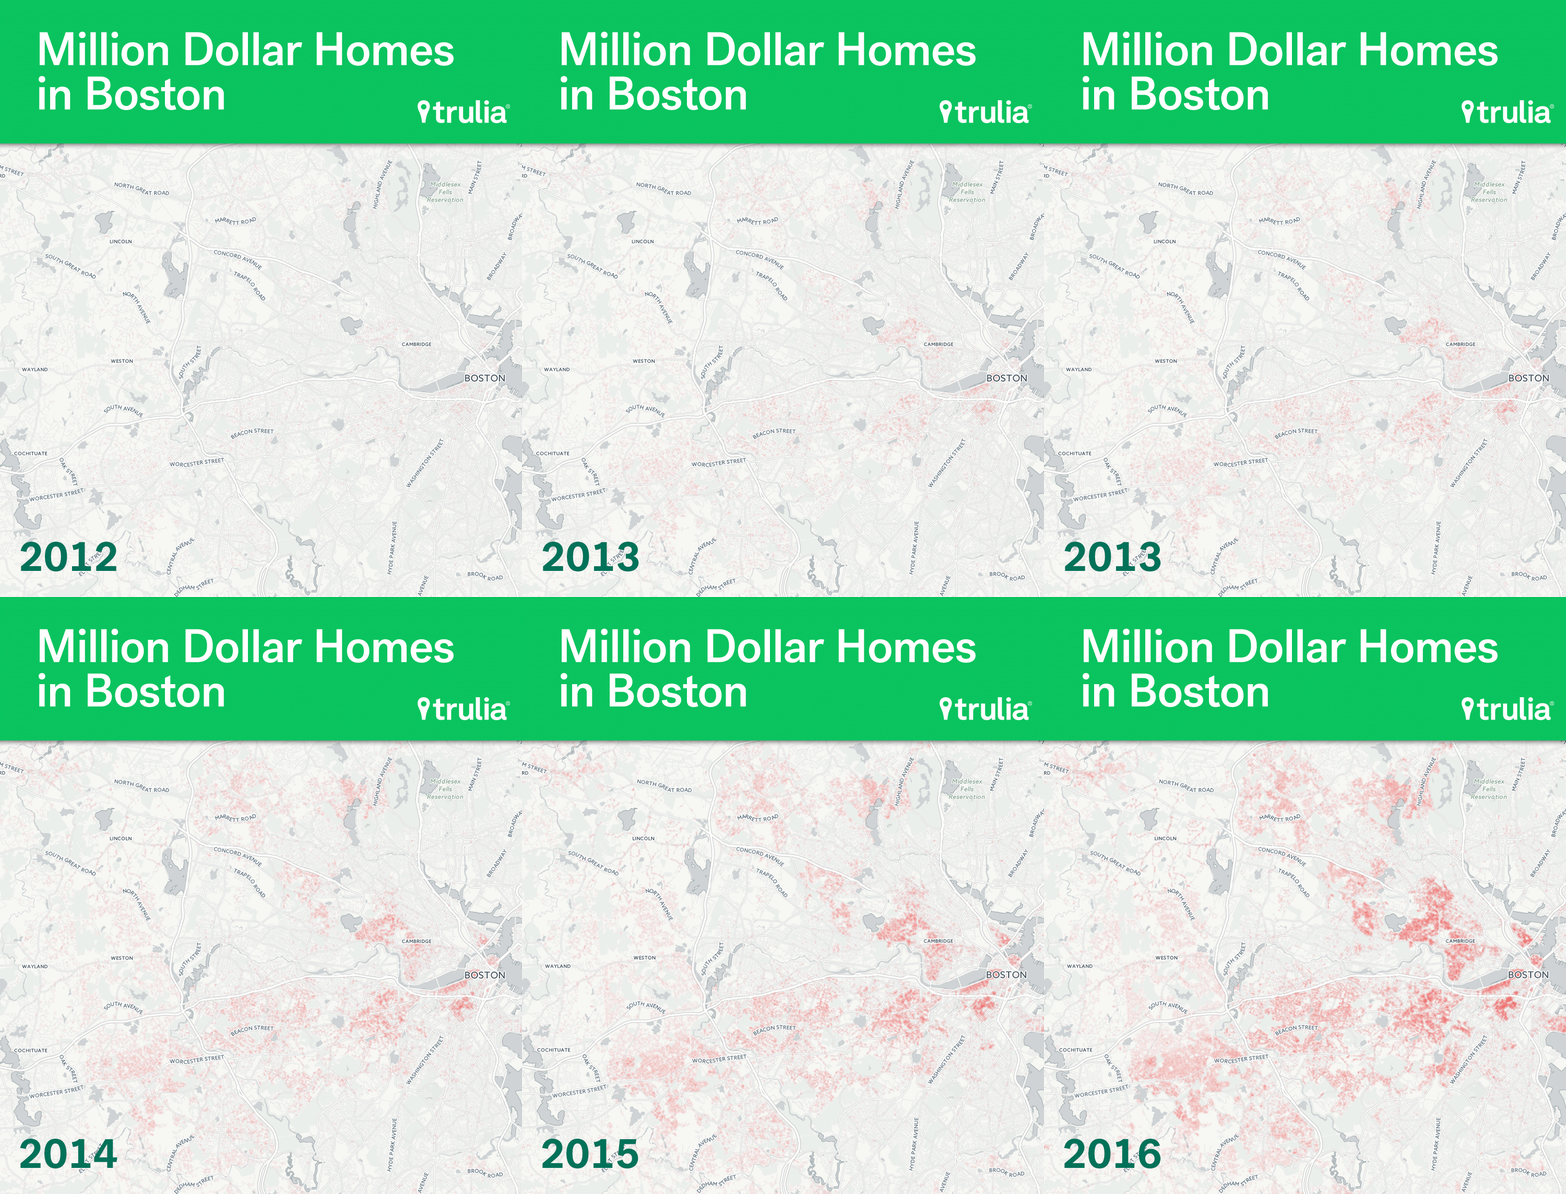
| Boston Neighborhoods with Largest Increase of Million Dollar Homes, 2012-2016 | ||||
| Boston Neighborhood | % of Million Homes in Neighborhood, May 2012 | % of Million Homes in Neighborhood, May 2016 | Percentage Point Change | |
| 1 | Haymarket, Boston | 37.5% | 87.5% | +50.0 |
| 2 | Mission Hill, Roxbury Crossing | 6.0% | 38.9% | +32.9 |
| 3 | Downtown Crossing, Boston | 10.9% | 34.7% | +23.8 |
| 4 | Chinatown, Boston | 22.6% | 46.3% | +23.6 |
| 5 | Cambridgeport, Cambridge | 8.8% | 31.3% | +22.5 |
| Click here for the complete list of all Boston neighborhoods | ||||
