SAN FRANCISCO, April 4, 2013 – Trulia (NYSE: TRLA) today released the latest findings from the Trulia Price Monitor and the Trulia Rent Monitor, the earliest leading indicators available of trends in home prices and rents. Based on the for-sale homes and rentals listed on Trulia, these monitors take into account changes in the mix of listed homes and reflect trends in prices and rents for similar homes in similar neighborhoods through March 31, 2013.
Asking Home Prices Up 7.2 Percent Year-over-Year Nationally
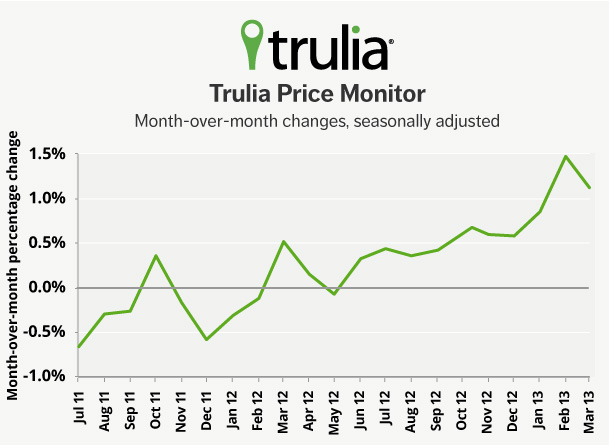
Heading into the spring house hunting season, asking home prices rose 7.2 percent year-over-year (Y-o-Y) nationally in March. Seasonally adjusted, prices rose 1.1 percent month-over-month and 3.5 percent quarter-over-quarter. Regionally, prices rose in 91 of the 100 largest metros. In fact, prices rose more than 20 percent year-over-year in Las Vegas, Phoenix, Oakland, Sacramento, and San Jose.
|
March 2013 Trulia Price Monitor Summary |
|||
|
|
% change in asking prices |
# of 100 largest metros with asking-price increases |
% change in asking prices, excluding foreclosures |
|
Month-over-month, |
1.1% |
Not reported |
1.4% |
|
Quarter-over-quarter, |
3.5% |
90 |
4.0% |
|
Year-over-year |
7.2% |
91 |
8.0% |
Single-Family Rents Flatten in Key Investor-Driven Markets
Nearly 4 million more single-family homes have been added to the rental market since 2005[1]. This new supply has fully caught up with the increased rental demand during the housing crisis – causing single-family home rents to flatten nationwide. Nationally, rents rose 2.4 percent Y-o-Y. For apartments only rents rose 2.9 percent Y-o-Y, while rents for single-family homes were flat, rising just 0.1 percent Y-o-Y. In Las Vegas, Orange County, Los Angeles, Atlanta, and Phoenix, where investors have actively bought and rented out single-family homes, rents are either falling or flat. Even in single-family rental markets where rents are up, such as in Tampa and Dallas, asking prices rose much faster than rents.
|
Rent and Price Changes on Single Family Homes |
|||
|
# |
U.S. Metro |
Y-o-Y% change in single-family home rents |
Y-o-Y % change in single-family home prices |
|
1 |
-1.9% |
24.6% |
|
|
2 |
-1.2% |
10.7% |
|
|
3 |
-1.2% |
3.6% |
|
|
4 |
Orange County, CA |
-0.7% |
13.7% |
|
5 |
Washington, DC-VA-MD-WV |
-0.7% |
6.2% |
|
6 |
-0.4% |
11.0% |
|
|
7 |
-0.1% |
13.4% |
|
|
8 |
New York, NY-NJ |
0.2% |
4.1% |
|
9 |
0.3% |
24.2% |
|
|
10 |
0.8% |
12.6% |
|
|
11 |
2.1% |
5.5% |
|
|
12 |
2.8% |
12.1% |
|
|
13 |
3.5% |
6.5% |
|
|
14 |
3.6% |
5.3% |
|
|
15 |
3.8% |
14.1% |
|
|
16 |
3.8% |
15.6% |
|
|
17 |
3.9% |
10.0% |
|
|
18 |
4.1% |
7.2% |
|
|
Metros with largest single-family-home rental markets. Rent and price changes include single-family homes only. |
|||
PRE-APPROVED QUOTES
- “Investors bought up cheap houses in hard-hit markets and rented them out to people who lost their homes to foreclosure or delayed first-time homeownership,” said Jed Kolko, Trulia’s Chief Economist. “With four million more rental homes now than during the bubble, supply has expanded to meet demand, and rents are flat or falling in markets where investors are most active.”
- “Rising prices and flattening rents change the math for investors and renters,” said Jed Kolko, Trulia’s Chief Economist. “Some investors will decide to sell the units they’ve been renting out, which would create new desperately needed for-sale inventory. At the same time, some renters watching prices rise will rush to buy before prices rise further, but those who don’t will at least get some relief from stabilizing rents.”
MULTIMEDIA
- To read the full report, see here.
- To download a graph of price changes from July 2011 to March 2013, see here.
- To download a list of the price and rent changes for the largest metros, see here.
METHODOLOGY
To view the full methodology and 2013 release schedule, see here. The next release of the Trulia Price Monitor and the Trulia Rent Monitor will be Tuesday, May 7, at 10 AM ET.
ABOUT TRULIA, INC.
Trulia (NYSE: TRLA) gives home buyers, sellers, owners, and renters the inside scoop on properties, places, and real estate professionals. Trulia has unique info on the areas people want to live that can’t be found anywhere else: users can learn about agents, neighborhoods, schools, crime, commute times, and even ask the local community questions. Real estate professionals use Trulia to connect with millions of transaction-ready buyers and sellers each month via our hyper local advertising services, social recommendations, and top-rated mobile real estate apps. Trulia is headquartered in downtown San Francisco. Trulia is a registered trademark of Trulia, Inc.
[1] Current Population Survey March annual supplements.

