Apartments For Rent in 91763
46 rentals
 Use arrow keys to navigateSPECIAL OFFERPET FRIENDLY$2,099 - $3,970/mo
 Studio-3 Beds
 1-2 BathsVillage at Montclair | 5038 Birch St #3-220,
Montclair, CA 91763 Use arrow keys to navigateNEW - 1 DAY AGOSPECIAL OFFER$2,199 - $4,005/moStudio-3 Beds1-3 BathsThe Paseos at Montclair North | 4914 Olive St #15-304,
Montclair, CA 91763 Use arrow keys to navigateNEW - 1 DAY AGOSPECIAL OFFERPET FRIENDLYTotal price$2,505 - $3,625/moStudio-3 Beds1-3 BathsKendry | 4868 Cypress St #211,
Montclair, CA 91763 Use arrow keys to navigatePET FRIENDLY
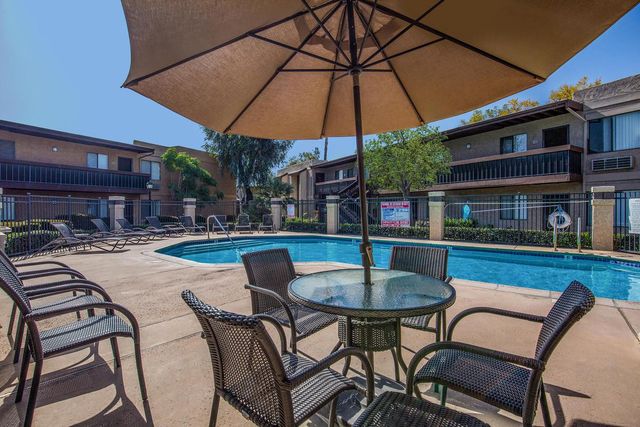 Use arrow keys to navigateSPECIAL OFFERSENIOR HOUSINGPET FRIENDLY$1,496 - $2,050/mo1-2 Beds1 BathHeritage Park Montclair Senior Apartments | 5205 San Bernardino St #13176,
Montclair, CA 91763 Use arrow keys to navigateAPPLY INSTANTLYPET FRIENDLY
 Use arrow keys to navigateAPPLY INSTANTLY
 APPLY INSTANTLY
 APPLY INSTANTLY
 PET FRIENDLY
 PET FRIENDLY
 PET FRIENDLY
 PET FRIENDLY
 PET FRIENDLY
 APPLY INSTANTLY
 APPLY INSTANTLY
 APPLY INSTANTLYFURNISHEDROOM FOR RENT
 APPLY INSTANTLY
 APPLY INSTANTLYFURNISHEDROOM FOR RENT
 APPLY INSTANTLYPET FRIENDLY
 APPLY INSTANTLYROOM FOR RENT
 APPLY INSTANTLY
 APPLY INSTANTLYROOM FOR RENT
 APPLY INSTANTLYPET FRIENDLY
 APPLY INSTANTLYROOM FOR RENT
 APPLY INSTANTLYROOM FOR RENT
 APPLY INSTANTLYPET FRIENDLY
 APPLY INSTANTLYPET FRIENDLY
 APPLY INSTANTLYFURNISHEDROOM FOR RENT
 APPLY INSTANTLY
 FURNISHEDROOM FOR RENT


 PET FRIENDLYFURNISHED
 FURNISHED
 PET FRIENDLY
 PET FRIENDLY


Average Rent Trends in 91763
Rent in 91763 varies by number of bedrooms and home type. Use these charts to quickly see how rent changes.
Average rent increased in Jun 2026 compared to the previous month. Rent previously peaked in Sep 2025.
| Month | Average rent |
|---|---|
| Jul 2025 | $2,400 |
| Aug 2025 | $2,400 |
| Sep 2025 | $2,650 |
| Oct 2025 | $2,200 |
| Nov 2025 | $2,080 |
| Dec 2025 | $2,100 |
| Jan 2026 | $2,399 |
| Feb 2026 | $2,500 |
| Mar 2026 | $2,495 |
| Apr 2026 | $2,300 |
| May 2026 | $2,080 |
| Jun 2026 | $2,600 |
Average Rent By Bedroom and Home Type
In July 2026, Townhomes were the most affordable home type to rent compared with Apartments and Condos and Houses.
| 1 bed | 2 beds | 3 beds | 4 beds | All | |
|---|---|---|---|---|---|
| All home types | $1,950 | $2,495 | $3,000 | $1,250 | $2,495 |
| Townhomes | — | $2,450 | $3,000 | — | $2,450 |
| Apartments and Condos | $1,950 | $2,495 | $2,600 | — | $2,495 |
| Houses | $850 | $2,500 | $2,890 | $1,250 | $2,500 |
Frequently Asked Questions about Rentals in 91763
- What is the average rent of an apartment in 91763?The average rent of an apartment in 91763 is $2,491 per month. This is about 28% higher than the national average.
- When is the average rent cheapest in 91763?In the last year, the average rent in 91763 was lowest in Nov 2025 when it was $2,080 per month.
- When is the average rent most expensive in 91763?In the last year, the average rent in 91763 was highest in Sep 2025 when it was $2,650 per month.
- How does the rent of a 1 bedroom apartment compare to a studio apartment in 91763?The average rent of a 1 bedroom apartment in 91763 is $1,950 per month. That is about $417 less than the cost of a studio apartment.
- How many available rental listings are in 91763?There are 50 available rental listings in 91763.
- What are some cities near 91763?
View this page in Spanish: Apartamentos en renta en 91763 - 194 Rentas | Trulia