In the spirit of Fat Tuesday excess, we ranked America’s most sinful cities and their saintly counterparts. We crafted our list by using the seven deadly sins of lust, gluttony, greed, sloth, wrath, envy, and vanity, or pride.
For each sin we looked at the characteristics. For instance, for lust we measured how many adult entertainment venues a city had per resident, and for sloth, we used surveys about exercise. Finally, we aggregated the data from all sins to create our top list of sin cities and saintly sanctuaries.
So, whether you want to indulge in forbidden pleasures or do good and avoid temptation, we crunched the numbers for you. Here’s where you are most and least likely to be in good company, either indulging or avoiding the seven deadly sins.
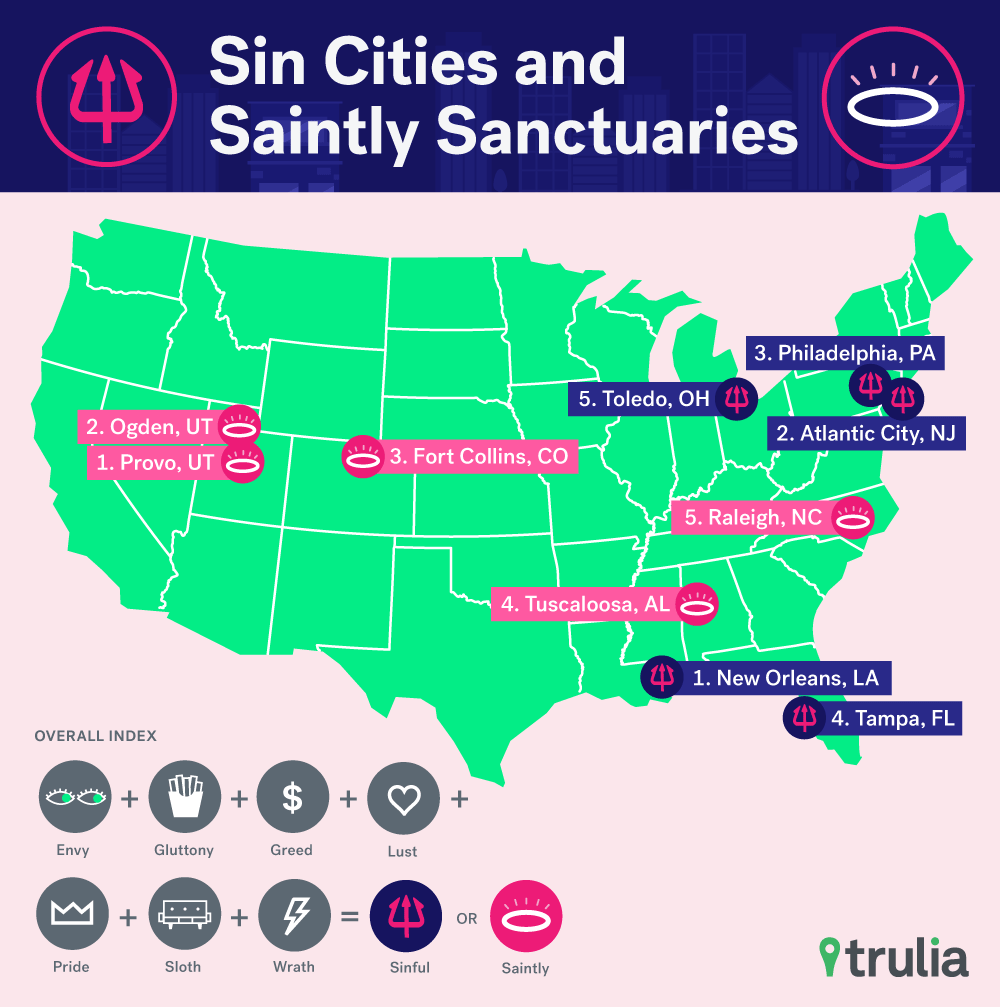
New Orleans still reigns as king of Mardi Gras. With nearly three times the national rate of adult entertainment establishments and twice the number gambling establishments per household, it scores highly in lust and greed. Additionally, above average rates of smoking, binge- and heavy-drinking and obesity, as well as high incidents of violent crime make the Crescent City a great place for those looking to explore gluttony and wrath.
| America’s Top 10 Sin Cities | ||||||||
| U.S. Metro Area | Overall Vice Rank | Wrath Rank | Envy Rank | Gluttony Rank | Greed Rank | Lust Rank | Pride Rank | Sloth Rank |
| New Orleans, LA | 1 | 33 | 17 | 15 | 27 | 6 | 65 | 31 |
| Atlantic City, NJ | 2 | 40 | 18 | 24 | 7 | 1 | 71 | 35 |
| Philadelphia, PA | 3 | 2 | 3 | 23 | 98 | 16 | 96 | 34 |
| Tampa, FL | 4 | 50 | 37 | 27 | 97 | 12 | 31 | 51 |
| Toledo, OH | 5 | 19 | 14 | 19 | 79 | 28 | 118 | 40 |
| Louisville, KY-IN | 6 | NA | 29 | 26 | 49 | 47 | 95 | 27 |
| Shreveport, LA | 7 | 18 | 78 | 39 | 29 | 75 | 86 | 12 |
| Las Vegas, NV | 8 | 5 | 117 | 113 | 3 | 2 | 20 | 77 |
| San Antonio, TX | 9 | 37 | 97 | 38 | 45 | 29 | 57 | 42 |
| Columbus, OH | 10 | NA | 60 | 55 | 36 | 33 | 49 | 67 |
| NOTE: Among 150 large U.S. metros | ||||||||
Provo-Orem, and Ogden-Clearfield, Utah, on the other hand, are the places to be if you want nothing to do with pre-Ash Wednesday festivities. People in these cities were more likely to have reported doing some exercise recently. They also have no gambling establishments and a population that claims to donate to charitable causes at more than twice the national rate, making them the least greedy cities in the comparison.
|
America’s Top 10 Saintly Sanctuaries
|
||||||||
| U.S. Metro Area | Overall Vice Rank | Wrath Rank | Envy Rank | Gluttony Rank | Greed Rank | Lust Rank | Pride Rank | Sloth Rank |
| Cambridge, MA | 140 | 103 | 94 | 107 | 94 | 118 | 59 | 116 |
| Greeley, CO | 142 | 84 | 144 | 73 | 104 | 143 | 84 | 60 |
| Asheville, NC | 143 | NA | 84 | 118 | 120 | 77 | 110 | 89 |
| Boise, ID | 144 | 115 | 126 | 110 | 128 | 71 | 61 | 120 |
| Claremont – Lebanon, NH-VT | 145 | NA | 26 | 104 | 102 | 143 | 150 | 112 |
| Raleigh, NC | 146 | 117 | 120 | 129 | 114 | 132 | 45 | 108 |
| Tuscaloosa, AL | 147 | 55 | 116 | 130 | 148 | 143 | 149 | 36 |
| Fort Collins, CO | 148 | 119 | 148 | 137 | 115 | 143 | 12 | 149 |
| Ogden -Clearfield, UT | 149 | 127 | 132 | 148 | 149 | 105 | 74 | 137 |
| Provo-Orem, UT | 150 | 132 | 147 | 150 | 150 | 121 | 30 | 147 |
| NOTE: Among 150 large U.S. metros | ||||||||
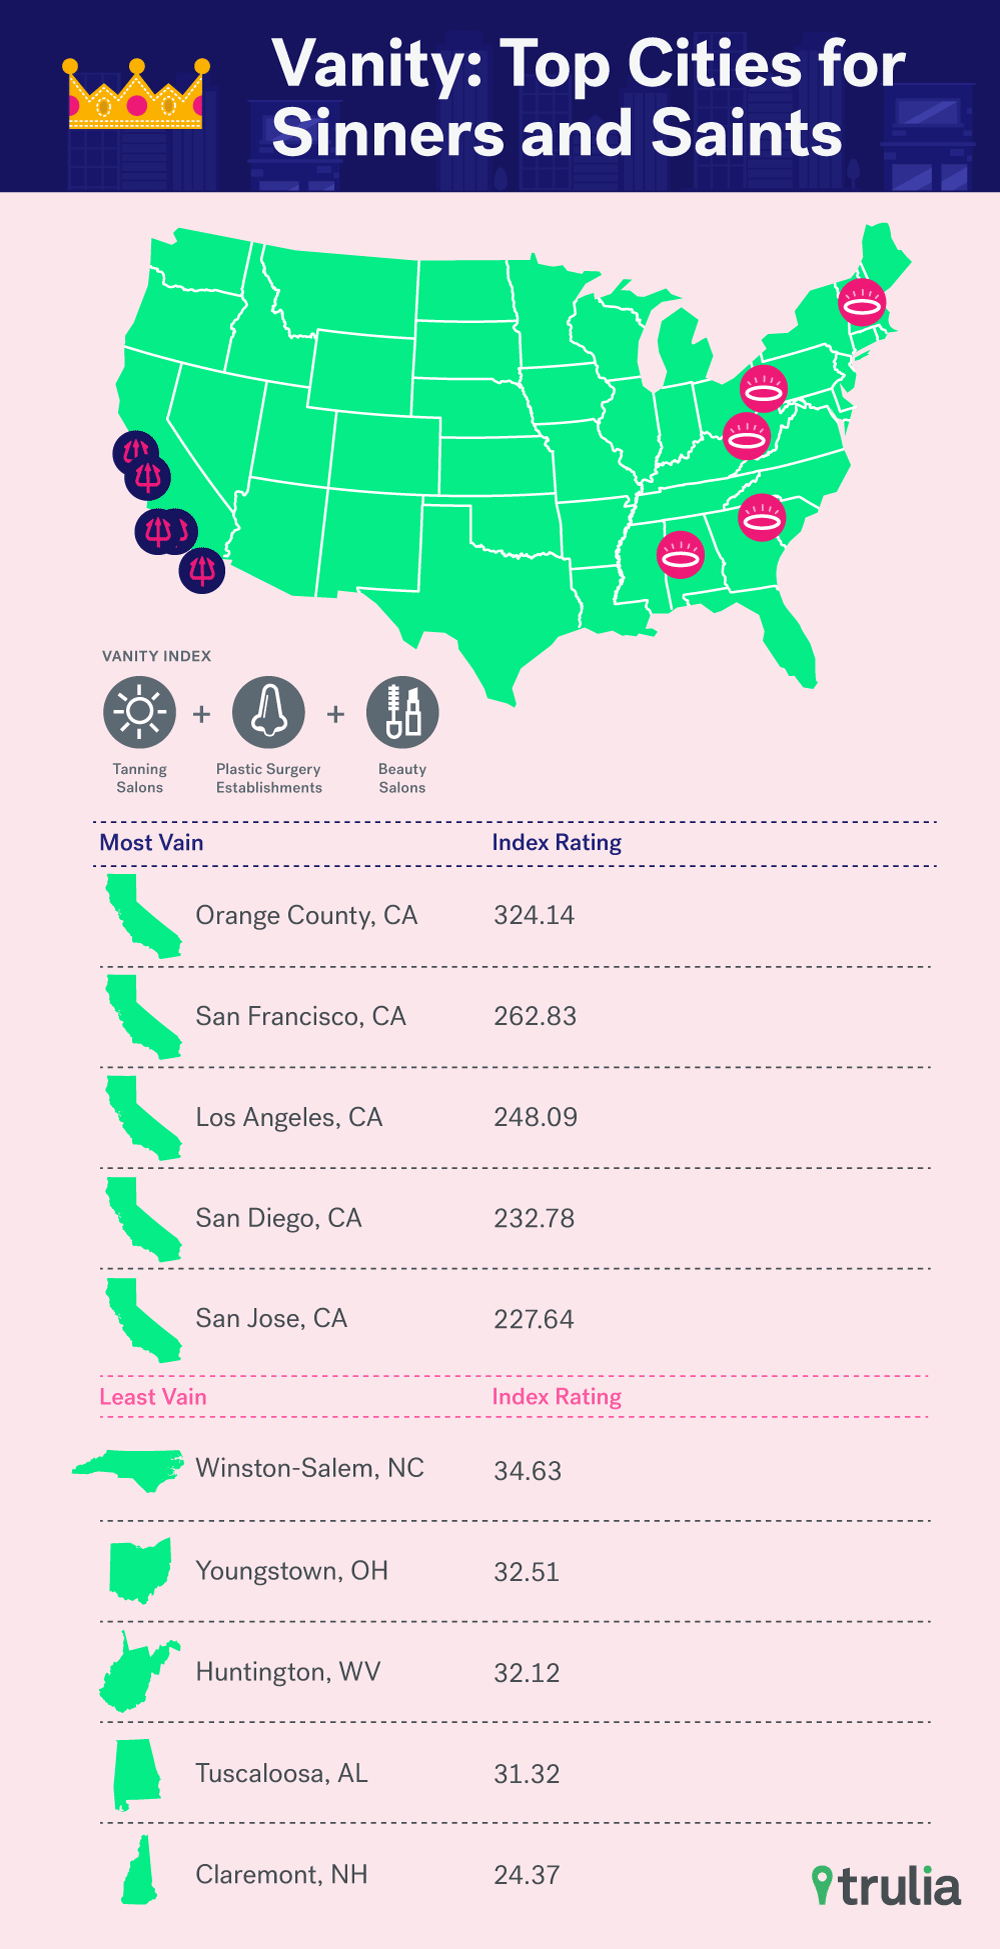
If vanity or pride is your vice of choice, head to the Golden State, where all of the top five cites in this category can be found. Orange County, Calif. tops the list with more than four times the national number of plastic surgeon offices per household. Los Angeles is a close second, with 3.3 times the national number of plastic surgeon offices per household. Both cities also have around twice as many beauty and tanning salons as the national per household rate. Other cities cracking the top ten most prideful are Austin and Salt Lake City. They have your narcissistic needs covered with above average rates of beauty salons, tanning salons and plastic surgeon offices.
|
America’s Most Vain Cities
|
||||||
| Rank | U.S. Metro Area | Pride Index | Beauty Salons Per 10,000 Households | Tanning Salons Per 10,000 Households | Plastic Surgeon Offices Per 10,000 Households | Median Price Per SQFT |
| 1 | Orange County, CA | 324.1 | 64.75 | 2.04 | 2.91 | $379 |
| 2 | San Francisco, CA | 262.8 | 75.87 | 1.31 | 2.12 | $732 |
| 3 | Los Angeles, CA | 248.1 | 56.09 | 1.11 | 2.27 | $363 |
| 4 | San Diego, CA | 232.8 | 61.85 | 1.73 | 1.78 | $317 |
| 5 | San Jose, CA | 227.6 | 61.21 | 1.14 | 1.90 | $502 |
| 6 | Austin, TX | 179.3 | 45.64 | 1.55 | 1.34 | $140 |
| 7 | Reno, NV | 176.3 | 39.59 | 1.33 | 1.45 | $176 |
| 8 | Salt Lake City, UT | 175.0 | 28.73 | 1.47 | 1.55 | $125 |
| 9 | Oakland, CA | 173.4 | 59.74 | 1.06 | 1.20 | $372 |
| 10 | Sacramento, CA | 171.4 | 50.35 | 1.82 | 1.08 | $198 |
| NOTE: Among 150 large U.S. metros | ||||||
|
America’s Least Vain Cities
|
||||||
| Rank | U.S. Metro Area | Pride Index | Beauty Salons Per 10,000 Households | Tanning Salons Per 10,000 Households | Plastic Surgeon Offices Per 10,000 Households | Median Price Per SQFT |
| 1 | Claremont-Lebanon, NH-VT | 24.4 | 11.57 | 0.55 | 0.00 | $121 |
| 2 | Tuscaloosa, AL | 31.3 | 8.29 | 0.66 | 0.11 | $102 |
| 3 | Huntington, WV-KY-OH | 32.1 | 5.44 | 0.54 | 0.20 | $81 |
| 4 | Youngstown, OH-PA | 32.5 | 7.53 | 0.69 | 0.13 | $63 |
| 5 | Winston-Salem, NC | 34.6 | 12.34 | 0.47 | 0.16 | $90 |
| 6 | Duluth, MN-WI | 35.8 | 8.47 | 0.94 | 0.09 | $106 |
| 7 | McAllen-Edinburg, TX | 37.0 | 8.08 | 0.23 | 0.32 | $86 |
| 8 | Salisbury, MD-DE | 37.1 | 14.50 | 0.54 | 0.14 | $157 |
| 9 | Jackson, MS | 37.7 | 7.81 | 0.71 | 0.19 | $97 |
| 10 | Kingsport-Bristol, TN-VA | 42.9 | 7.30 | 0.85 | 0.23 | $82 |
| NOTE: Among 150 large U.S. metros | ||||||
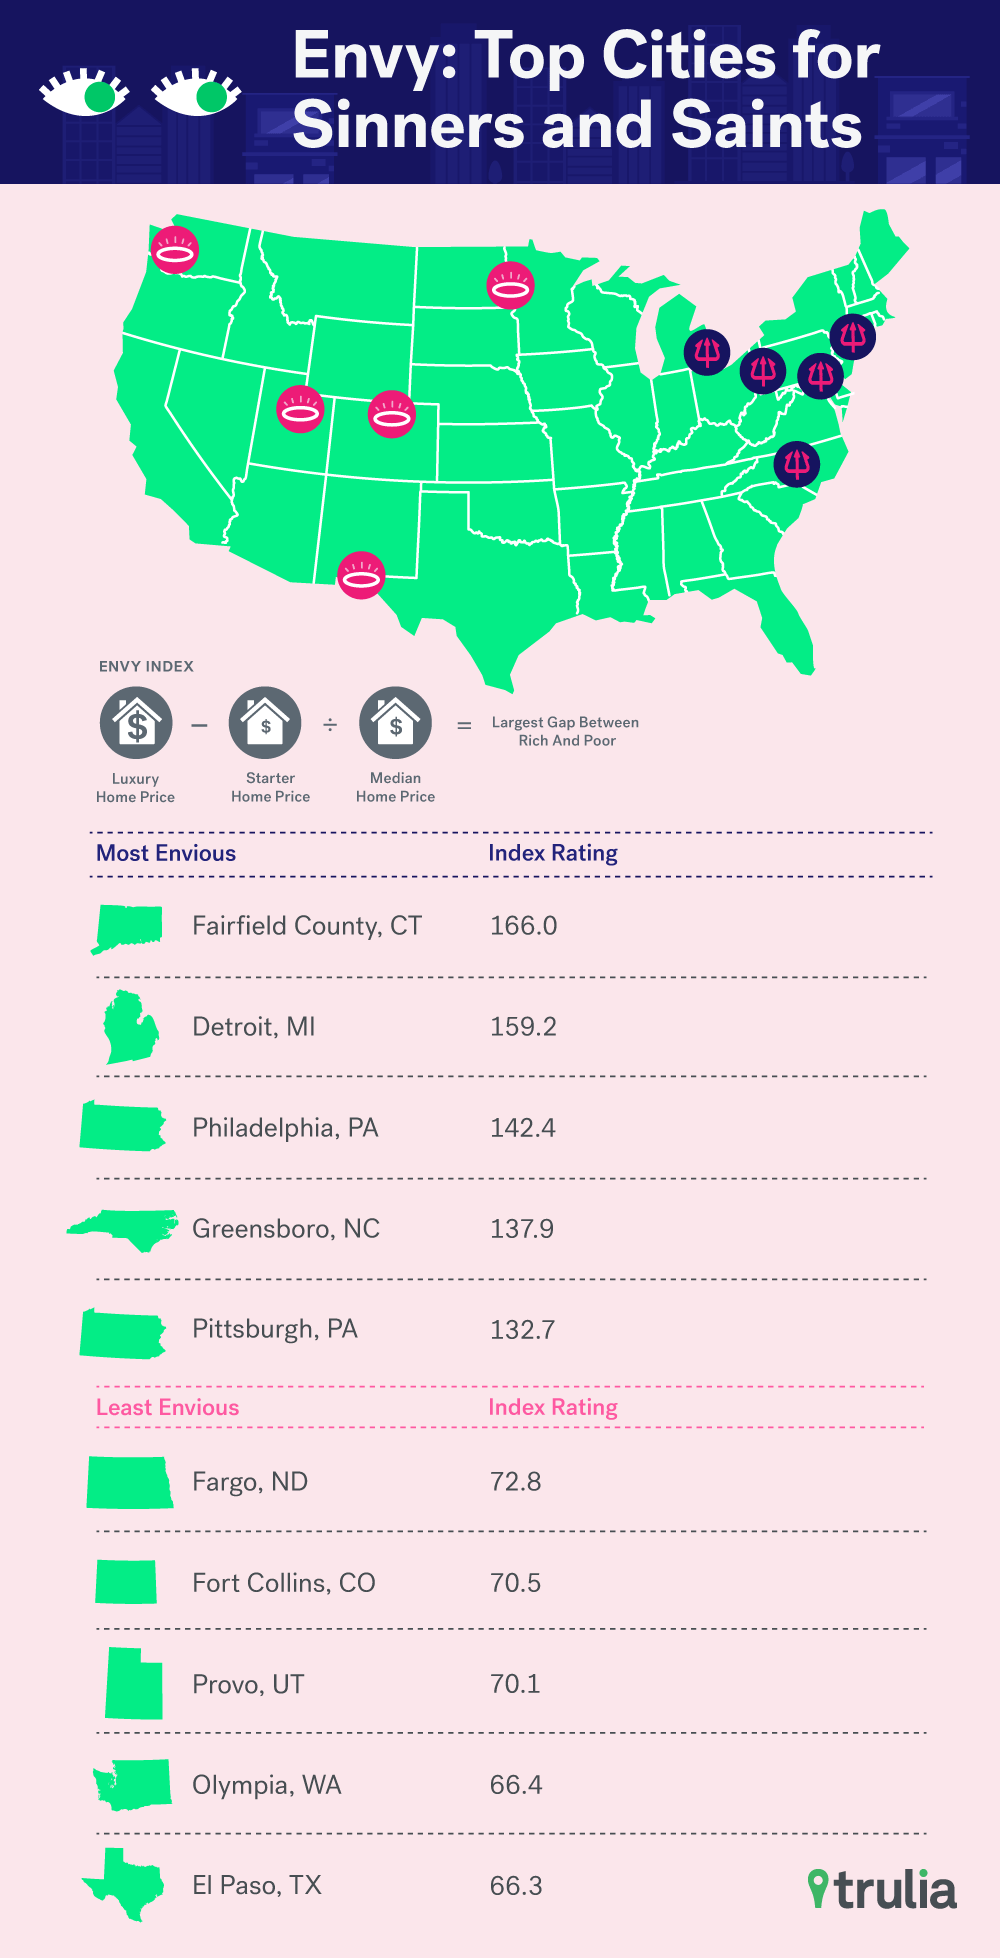
If you’re tired of being surrounded with souls plagued by envy, head to El Paso, Texas, where the difference in the listing price of homes between the 25th and 75th percentile as a proportion of its median listing price, is the smallest at one-third the average of the 150 city comparison. Also on the list of least envious places is Fargo, ND and Anchorage, Alaska, with listing price differences 30% and 26% lower than average. Fairfield County, Conn. and Detroit, Mich., have the largest difference in home listing prices as a proportion of their median listing price, at 65% and 58% above the comparison average, making them the most envious places in our comparison. New York and Philadelphia, not to be outdone, also come in at 42% and 32% above the national average.
|
America’s Most Envious Cities
|
||||
| Rank | U.S. Metro Area | Envy Index | Listing Home Price Inequality | Median Price Per SQFT |
| 1 | Fairfield County, CT | 166.0 | 1.41 | $245 |
| 2 | Detroit, MI | 159.2 | 1.36 | $82 |
| 3 | Philadelphia, PA | 142.4 | 1.21 | $125 |
| 4 | Greensboro, NC | 137.9 | 1.17 | $91 |
| 5 | Pittsburgh, PA | 132.7 | 1.13 | $125 |
| 6 | New York, NY-NJ | 132.6 | 1.13 | $280 |
| 7 | Youngstown, OH-PA | 132.0 | 1.12 | $63 |
| 8 | Cleveland, OH | 130.5 | 1.11 | $88 |
| 9 | Akron, OH | 130.4 | 1.11 | $87 |
| 10 | Scranton, PA | 129.2 | 1.10 | $79 |
| NOTE: Among 150 large U.S. metros. Listing Home Price Inequality is the difference between listing prices at the 75th and 25th percentile, divided by the median listing price for the metro area. | ||||
|
America’s Least Envious Cities
|
||||
| Rank | U.S. Metro Area | Envy Index | Listing Home Price Inequality | Median Price Per SQFT |
| 1 | El Paso, TX | 62.8 | 0.53 | $91 |
| 2 | Olympia, WA | 64.4 | 0.55 | $137 |
| 3 | Fort Collins, CO | 66.3 | 0.56 | $156 |
| 4 | Provo-Orem, UT | 66.4 | 0.57 | $103 |
| 5 | Billings, MT | 70.1 | 0.60 | $116 |
| 6 | Fargo, ND-MN | 70.5 | 0.60 | $120 |
| 7 | Greeley, CO | 72.8 | 0.62 | $124 |
| 8 | Anchorage, AK | 73.7 | 0.63 | $167 |
| 9 | Kennewick-Richland, WA | 74.6 | 0.64 | $120 |
| 10 | Sacramento, CA | 75.3 | 0.64 | $198 |
| NOTE: Among 150 large U.S. metros. Listing Home Price Inequality is the difference between listing prices at the 75th and 25th percentile, divided by the median listing price for the metro area. | ||||
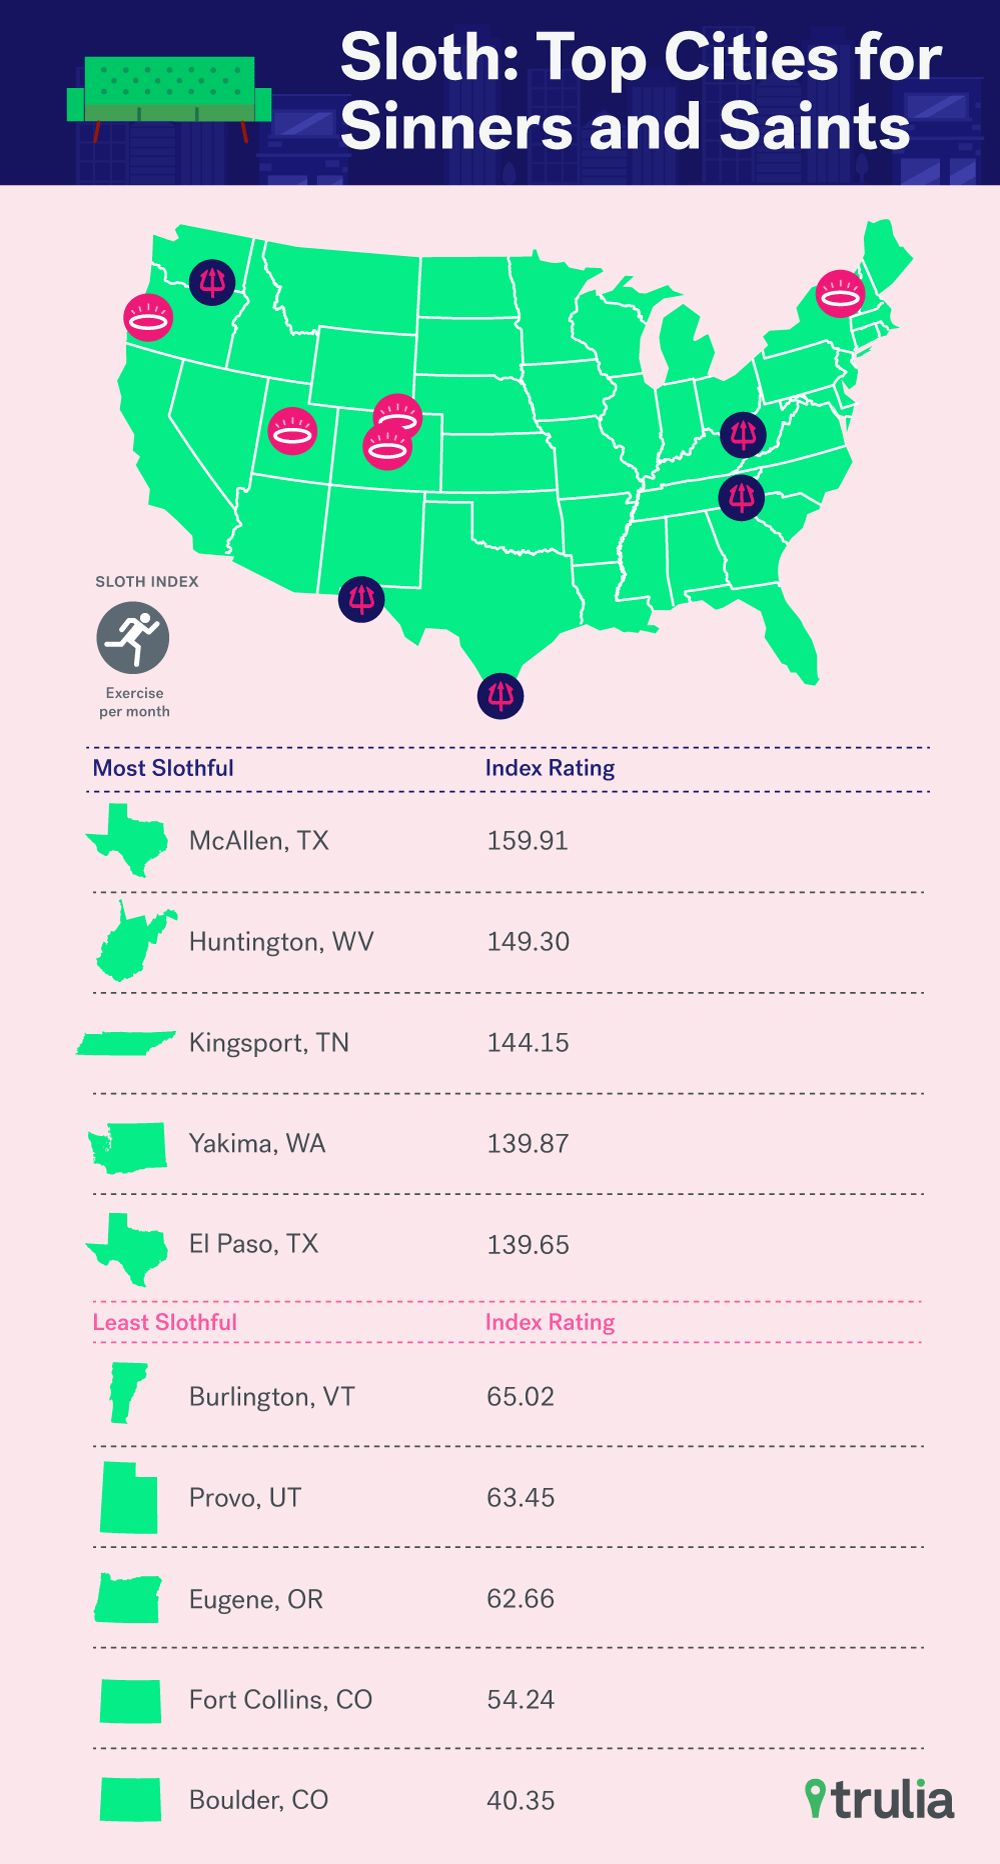
Sloths, take note (hands free, of course); McAllen, Texas, has the highest percentage of people who report doing no exercise over a 30-day period at 36.6% compared with 23% nationally. Boulder and Fort Collins, Colo., report the lowest proportion of residents who don’t exercise at 9.2% and 12.4%, respectively.
|
America’s Laziest Cities
|
||||
| Rank | U.S. Metro Area | Sloth Index | % of Adults Reporting No Exercise | Median Price Per SQFT |
| 1 | McAllen-Edinburg, TX | 159.9 | 36.6 | $86 |
| 2 | Huntington, WV-KY-OH | 149.3 | 34.2 | $81 |
| 3 | Kingsport-Bristol, TN-VA | 144.2 | 33.0 | $82 |
| 4 | Yakima, WA | 139.9 | 32.0 | $110 |
| 5 | El Paso, TX | 139.7 | 32.0 | $91 |
| 6 | Youngstown, OH-PA | 136.6 | 31.3 | $63 |
| 7 | Spartanburg, SC | 132.2 | 30.3 | $84 |
| 8 | Charleston, WV | 129.3 | 29.6 | $78 |
| 9 | Knoxville, TN | 129.1 | 29.6 | $99 |
| 10 | Scranton, PA | 128.8 | 29.5 | $79 |
| NOTE: Among 150 large U.S. metros | ||||
|
America’s Least Laziest Cities
|
||||
| Rank | U.S. Metro Area | Sloth Index | % of Adults Reporting No Exercise | Median Price Per SQFT |
| 1 | Boulder, CO | 40.4 | 9.2 | $201 |
| 2 | Fort Collins, CO | 54.2 | 12.4 | $156 |
| 3 | Eugene, OR | 62.7 | 14.4 | $152 |
| 4 | Provo-Orem, UT | 63.5 | 14.5 | $103 |
| 5 | Burlington, VT | 65.0 | 14.9 | $156 |
| 6 | Portland, OR-WA | 67.6 | 15.5 | $170 |
| 7 | Seattle, WA | 67.7 | 15.5 | $210 |
| 8 | Sacramento, CA | 68.3 | 15.6 | $198 |
| 9 | Orange County, CA | 68.3 | 15.7 | $379 |
| 10 | Lincoln, NE | 69.3 | 15.9 | $130 |
| NOTE: Among 150 large U.S. metros | ||||
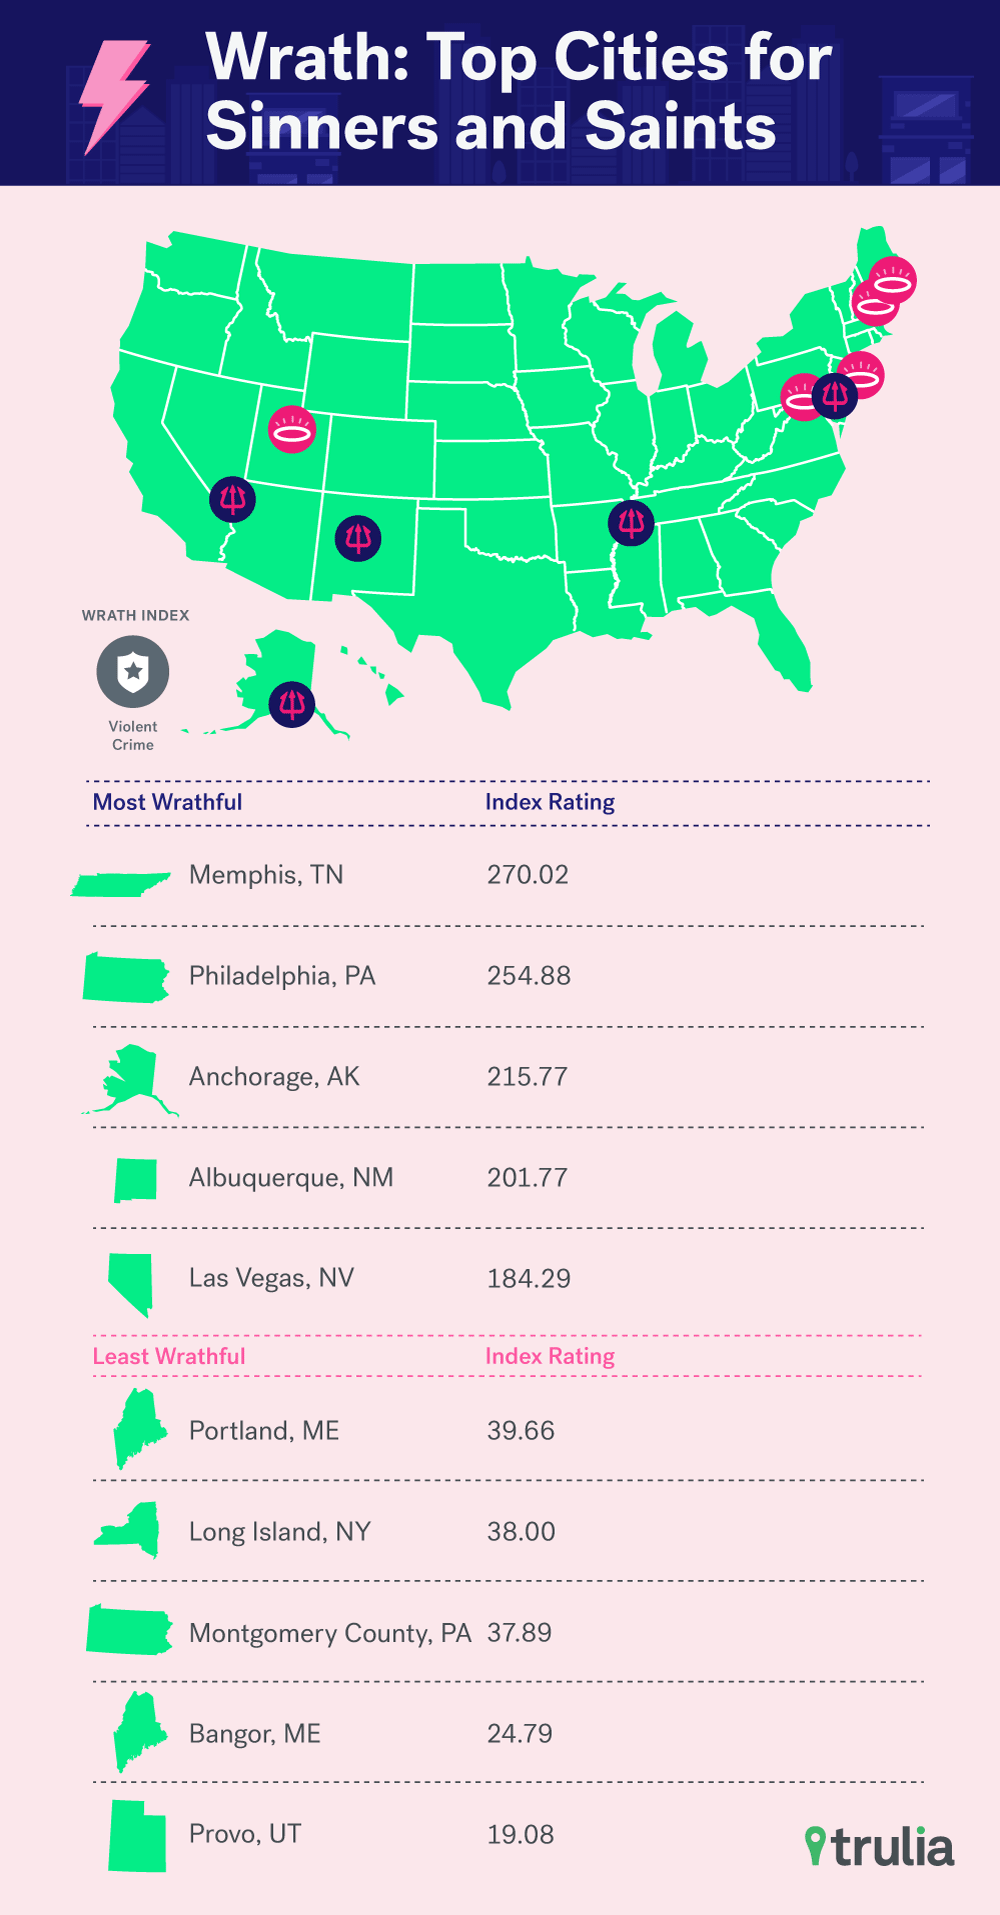
The most wrathful cities, based on the rate of violent crimes committed per capita are Memphis, Tenn., and Philadelphia, Pa., at 2.7 and 2.5 times the national rate. Turning the other check doesn’t seem to be the way in Little Rock, Ark. either, which has a violent crime rate 1.8 times higher than the national rate. The least wrathful cities are Provo and Bangor, Maine, at one-fifth and one-fourth the national rate of violent crime respectively.
|
America’s Most Wrathful Cities
|
||||
| Rank | U.S. Metro Area | Wrath Index | Violent Crimes Per 100,000 Inhabitants | Median Price Per SQFT |
| 1 | Memphis, TN-MS-AR | 270.0 | 993.4 | $88 |
| 2 | Philadelphia, PA | 254.9 | 937.7 | $125 |
| 3 | Anchorage, AK | 215.8 | 793.8 | $167 |
| 4 | Albuquerque, NM | 201.8 | 742.3 | $114 |
| 5 | Las Vegas, NV | 184.3 | 678.0 | $123 |
| 6 | Little Rock, AR | 183.7 | 675.7 | $91 |
| 7 | Baltimore, MD | 172.2 | 633.4 | $163 |
| 8 | Nashville, TN | 162.0 | 596.1 | $123 |
| 9 | Oakland, CA | 160.4 | 590.0 | $372 |
| 10 | Milwaukee, WI | 159.6 | 587.1 | $122 |
| NOTE: Among 150 large U.S. metros | ||||
|
America’s Least Wrathful Cities
|
||||||
| Rank | U.S. Metro Area | Wrath Index | Violent Crimes Per 100,000 Inhabitants | Median Price Per SQFT | ||
| 1 | Provo-Orem, UT | 19.1 | 70.2 | $103 | ||
| 2 | Bangor, ME | 24.8 | 91.2 | $90 | ||
| 3 | Montgomery County –Bucks County –Chester County, PA | 37.9 | 139.4 | $154 | ||
| 4 | Long Island, NY | 38.0 | 139.8 | $330 | ||
| 5 | Portland, ME | 39.7 | 145.9 | $165 | ||
| 6 | Ogden-Clearfield, UT | 44.6 | 164.0 | $100 | ||
| 7 | Rockingham County -Strafford County, NH | 45.7 | 168.3 | $157 | ||
| 8 | Allentown, PA-NJ | 50.4 | 185.4 | $112 | ||
| 9 | Silver Spring, MD | 51.5 | 189.4 | $187 | ||
| 10 | Orange County, CA | 52.7 | 193.7 | $379 | ||
| NOTE: Among 150 large U.S. metros | ||||||
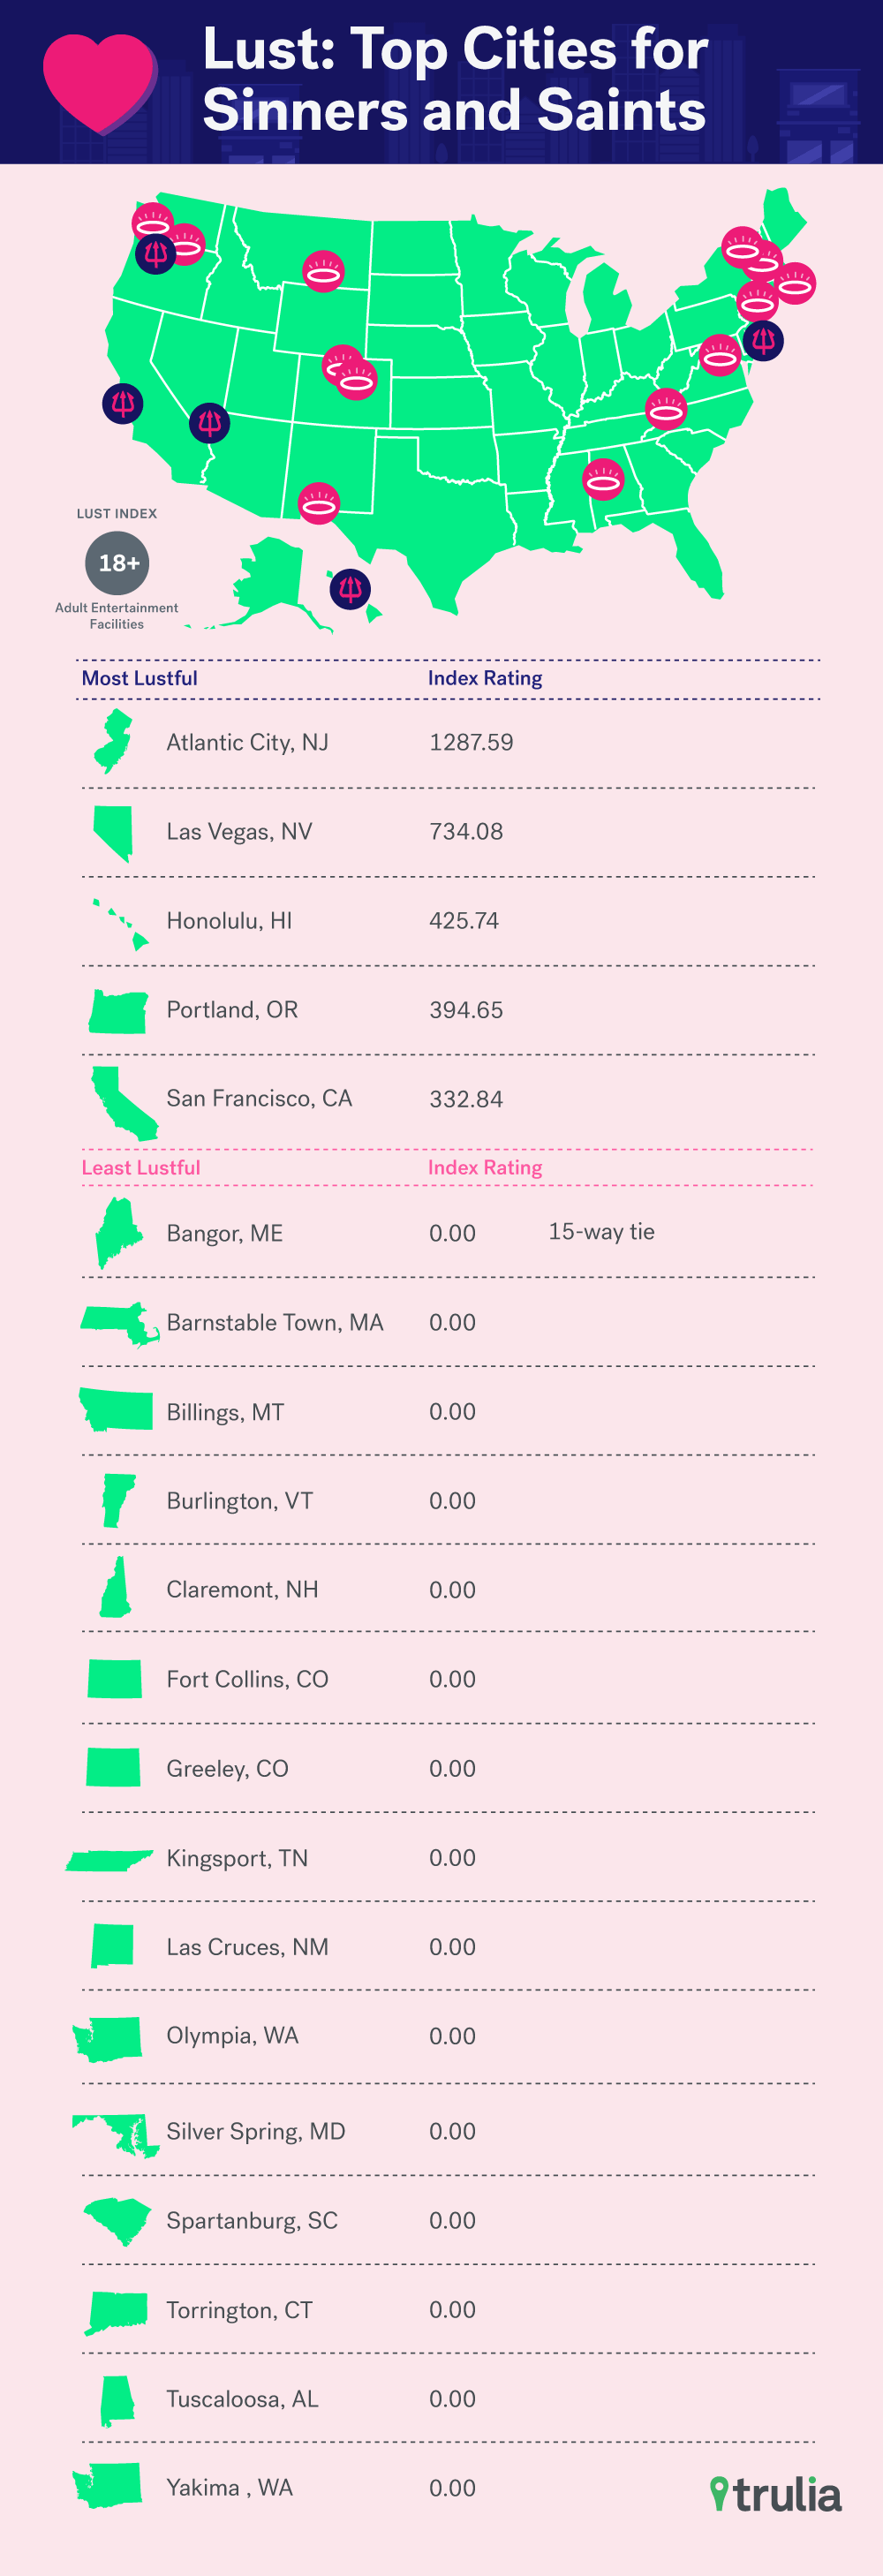
Atlantic City, N.J., second only to New Orleans in most overall buck wild Mardi Gras location, has enough adult entertainment establishments to top the national average by a whopping 12.9 times on a per household basis, making it the most lustful city by far. Las Vegas and Honolulu, ranked second and third in lust respectively, look buttoned up in comparison at 7.3 and 4.3 times the national average. Portland, San Francisco and Los Angeles also make the top ten to ensure your trip along the coast isn’t without temptation.
| America’s Most Lustful Cities | ||||
| Rank | U.S. Metro Area | Lust Index | Adult Entertainment Establishments Per 10,000 Households | Median Price Per Square Foot |
| 1 | Atlantic City, NJ | 1287.6 | 2.82 | $119 |
| 2 | Las Vegas, NV | 734.1 | 1.61 | $123 |
| 3 | Honolulu, HI | 425.7 | 0.93 | $481 |
| 4 | Portland, OR-WA | 394.7 | 0.86 | $170 |
| 5 | San Francisco, CA | 332.8 | 0.73 | $732 |
| 6 | New Orleans, LA | 286.1 | 0.63 | $110 |
| 7 | Los Angeles, CA | 253.6 | 0.56 | $363 |
| 8 | Hagerstown, MD-WV | 239.0 | 0.52 | $105 |
| 9 | Reno, NV | 221.1 | 0.48 | $176 |
| 10 | Huntsville, AL | 219.9 | 0.48 | $91 |
| NOTE: Among 150 large U.S. metros | ||||
| America’s Least Lustful Cities |
| Rank | U.S. Metro Area | Median Price per square foot |
| 1 | Bangor, ME | $89.80 |
| 1 | Barnstable Town, MA | $282.09 |
| 1 | Billings, MT | $115.87 |
| 1 | Burlington, VT | $156.22 |
| 1 | Claremont-Lebanon, NH-VT | $120.98 |
| 1 | Fort Collins, CO | $155.56 |
| 1 | Greeley, CO | $123.67 |
| 1 | Kingsport-Bristol, TN-VA | $82.28 |
| 1 | Las Cruces, NM | $101.80 |
| 1 | Olympia-Tumwater, WA | $137.19 |
| 1 | Silver Spring, MD | $187.40 |
| 1 | Spartanburg, SC | $84.15 |
| 1 | Torrington, CT | $145.72 |
| 1 | Tuscaloosa, AL | $101.69 |
| 1 | Yakima, WA | $109.67 |
| NOTE: Among 150 large U.S. metros. These metros had no adult entertainment establishments in their metro area. |
If you want to let your inner glutton shine (as if coated in grease and drink), make your way to Sioux City, Iowa or Scranton, Pa., where you won’t have to drink or smoke alone and the obesity rate is 30% and 15% above the national average, respectively. In the comparison binge drinking rates are highest, 66% higher than average, in Fargo, N.D. Heavy drinkers can be found in Hilo, Hawaii, and Jacksonville, Fla. Obesity rates are highest in McAllen, Texas (coincidentally) at 61% percent higher than the national average.

|
America’s Most Gluttonous Cities
|
|||||||
| Rank | U.S. Metro Area | Gluttony Index | Obesity Index | Binge Drinking Index | Heavy Drinking Index | Smoking Index | Median Price Per SQFT |
| 1 | Sioux City, IA-NE-SD | 128.3 | 130.1 | 131.4 | 145.7 | 105.8 | $128 |
| 2 | Scranton, PA | 126.0 | 115.7 | 127.9 | 127.1 | 133.3 | $126 |
| 3 | Lafayette, LA | 123.9 | 107.3 | 107.5 | 148.4 | 132.7 | $124 |
| 4 | Dayton, OH | 123.3 | 107.0 | 108.6 | 156.6 | 121.1 | $123 |
| 5 | Milwaukee, WI | 122.8 | 111.9 | 138.8 | 136.7 | 103.6 | $123 |
| 6 | Jacksonville, FL | 121.3 | 105.7 | 114.3 | 158.2 | 106.8 | $121 |
| 7 | Hilo, HI | 120.3 | 90.1 | 127.8 | 180.2 | 83.2 | $120 |
| 8 | Duluth, MN-WI | 118.9 | 109.5 | 136.9 | 107.9 | 121.2 | $119 |
| 9 | Youngstown, OH-PA | 117.9 | 116.6 | 112.8 | 107.7 | 134.5 | $118 |
| 10 | Salisbury, MD-DE | 117.9 | 111.8 | 113.7 | 141.3 | 104.8 | $118 |
| NOTE:NOTE: Among 150 large U.S. metros. On the indices for Gluttony, Obesity, Binge Drinking, Heavy Drinking, and Smoking, 100 = national average. An Obesity Index of 130.1 means that the obesity rate is 1.3 times higher than the national average. | |||||||
|
America’s Least Gluttonous Cities
|
|||||||
| Rank | U.S. Metro Area | Gluttony Index | Obesity Index | Binge Drinking Index | Heavy Drinking Index | Smoking Index | Median Price Per SQFT |
| 1 | Provo-Orem, UT | 44.3 | 81.3 | 36.6 | 33.0 | 26.3 | $44 |
| 2 | Kingsport-Bristol, TN-VA | 59.7 | 119.3 | 0.0 | 0.0 | 119.5 | $60 |
| 3 | Ogden-Clearfield, UT | 63.7 | 101.6 | 57.3 | 40.3 | 55.7 | $64 |
| 4 | San Jose, CA | 68.3 | 57.6 | 96.8 | 70.0 | 48.8 | $68 |
| 5 | Fayetteville, NC | 73.8 | 111.3 | 69.2 | 0.0 | 114.7 | $74 |
| 6 | Chattanooga, TN-GA | 74.6 | 104.3 | 67.3 | 0.0 | 126.6 | $75 |
| 7 | Silver Spring, MD | 75.0 | 76.3 | 92.7 | 85.1 | 46.0 | $75 |
| 8 | Boulder, CO | 77.1 | 53.7 | 91.2 | 94.4 | 69.0 | $77 |
| 9 | Yakima, WA | 77.8 | 113.8 | 94.9 | 0.0 | 102.4 | $78 |
| 10 | Long Island, NY | 78.1 | 80.3 | 95.5 | 61.6 | 74.7 | $78 |
| NOTE: Among 150 large U.S. metros. On the indices for Obesity, Binge Drinking, Heavy Drinking, and Smoking, 100 = national average. An Obesity Index of 81.3 means that the obesity rate is .81 times lower than the national average. | |||||||
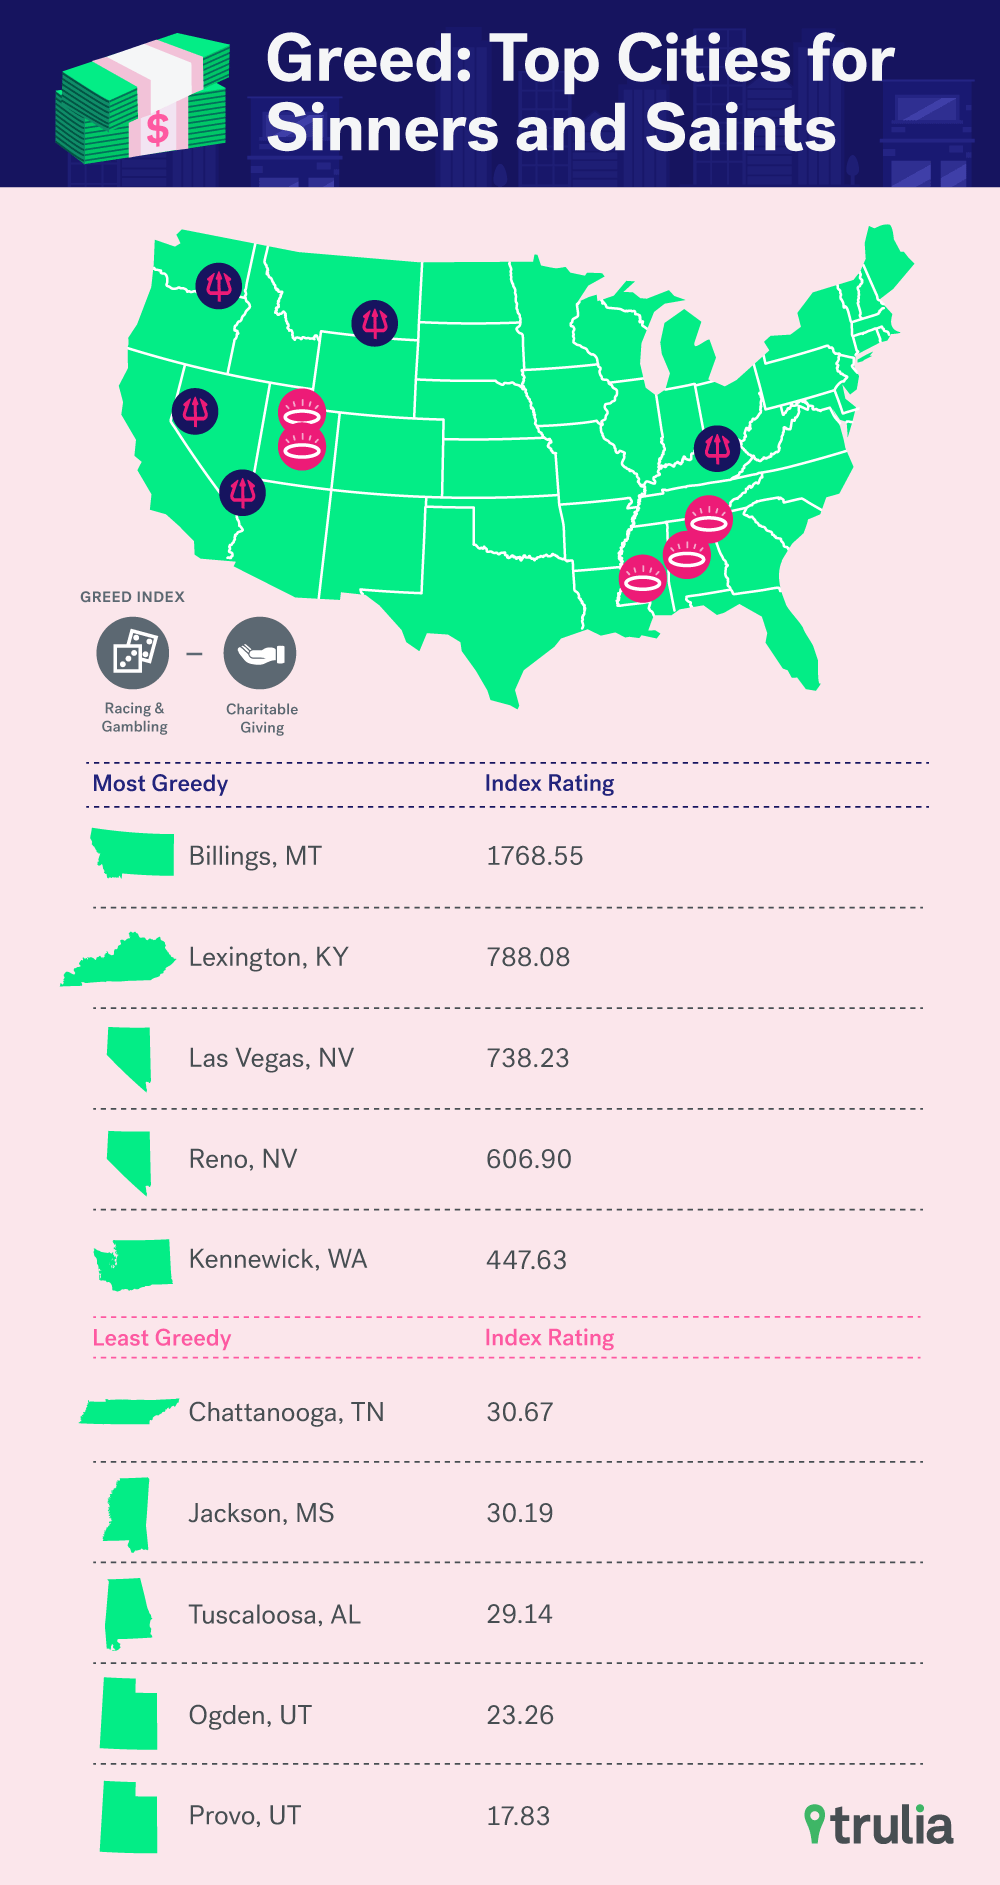
Lastly for the greedy among us, Billings, Mont., offers more than 54 times the national average number of casinos per household, shooting it to the top of our list. Of the other top 10 cities, in addition to having plenty of casinos, Atlantic City residents claimed the lowest amount of charitable contributions on their itemized tax filings in 2013, keeping them high on our greedy list. You won’t find a single race track or casino in Provo, on the hand, and residents claim to donate nearly 10 percent of their income to charitable causes, making them the least greedy in our comparison.
| America’s Most Greedy Cities | ||||||
| Rank | U.S. Metro Area | Greed Index | Casinos Per 10,000 Households | Horse & Dog Racing Establishments per 10,000 households | Charitable Donations as a percentage of Income | Median Price Per SQFT |
| 1 | Billings, MT | 1768.5 | 7.62 | 0.15 | 3.08% | $116 |
| 2 | Lexington, KY | 788.1 | 0.00 | 0.32 | 3.59% | $98 |
| 3 | Las Vegas, NV | 738.2 | 3.70 | 0.01 | 3.56% | $123 |
| 4 | Reno, NV | 606.9 | 3.09 | 0.00 | 2.85% | $176 |
| 5 | Kennewick-Richland, WA | 447.6 | 0.79 | 0.11 | 3.97% | $120 |
| 6 | Torrington, CT | 375.5 | 0.00 | 0.13 | 2.38% | $146 |
| 7 | Atlantic City, NJ | 353.1 | 1.56 | 0.00 | 2.15% | $119 |
| 8 | Burlington, VT | 352.2 | 0.00 | 0.12 | 2.35% | $156 |
| 9 | Bremerton, WA | 350.5 | 0.31 | 0.10 | 3.05% | $150 |
| 10 | Sioux City, IA-NE-SD | 327.8 | 1.56 | 0.00 | 3.22% | $82 |
| NOTE: Among 150 large U.S. metros | ||||||
| America’s Least Greedy Cities | ||||||
| Rank | U.S. Metro Area | Greed Index | Casinos Per 10,000 Households | Horse & Dog Racing Establishments per 10,000 households | Charitable Donations as a percentage of Income | Median Price Per SQFT |
| 1 | Provo-Orem, UT | 17.8 | 0.00 | 0.00 | 9.16% | $103 |
| 2 | Ogden-Clearfield, UT | 23.3 | 0.00 | 0.00 | 7.02% | $100 |
| 3 | Tuscaloosa, AL | 29.1 | 0.00 | 0.00 | 5.60% | $102 |
| 4 | Jackson, MS | 30.2 | 0.00 | 0.00 | 5.41% | $97 |
| 5 | Chattanooga, TN-GA | 30.7 | 0.00 | 0.00 | 5.32% | $94 |
| 6 | Spartanburg, SC | 31.2 | 0.00 | 0.00 | 5.24% | $84 |
| 7 | Kingsport-Bristol, TN-VA | 31.6 | 0.00 | 0.00 | 5.17% | $82 |
| 8 | Wichita, KS | 32.0 | 0.00 | 0.00 | 5.11% | $73 |
| 9 | Augusta County –Richmond County, GA-SC | 33.4 | 0.00 | 0.00 | 4.90% | $86 |
| 10 | Mobile, AL | 33.6 | 0.00 | 0.00 | 4.86% | $85 |
| NOTE: Among 150 large U.S. metros | ||||||
Methodology
In the creation of our Vice Index, we took a hedonic1 approach. We use the seven deadly sins, or cardinal sins, codified by Pope Gregory I in 590. The seven individual sin categories were first indexed and then ranked. The overall rankings were based off of the average rank of each the seven sin indexes per metro area. The seven individual sin category indexes are composed of the following inputs:
- Lust: Yelp-defined Adult Entertainment Establishments per 10,000 households.
- Gluttony: A composite of metro-level Center for Disease Control and Prevention (CDC) data on obesity rates, binge-drinking2 rates, heavy drinking3 rates, and smoking rates.
- Greed: Yelp-defined horse and/or dog racing and gambling establishments per 10,000 households and county-level IRS charitable contributions data from itemized tax filings.
- Sloth: Metro-level CDC data on proportion of residents who report having not exercised at least once in the past 30 days.
- Wrath: Violent crime data per capita as reported in FBI crime statistics
- Envy: The difference between the 25th and 75th percentiles of listing prices as a proportion of the median listing price in each metro area
- Vanity: Yelp-defined beauty and tanning salons, as well as plastic surgery offices per 10,000 households
1 Hedonic – of, relating to, or characterized by pleasure
2 Binge drinking is when men consume 5 or more drinks, and women consume 4 or more drinks, in about 2 hours.
3 For men, heavy drinking is typically defined as consuming 15 drinks or more per week. For women, heavy drinking is typically defined as consuming 8 drinks or more per week.

