
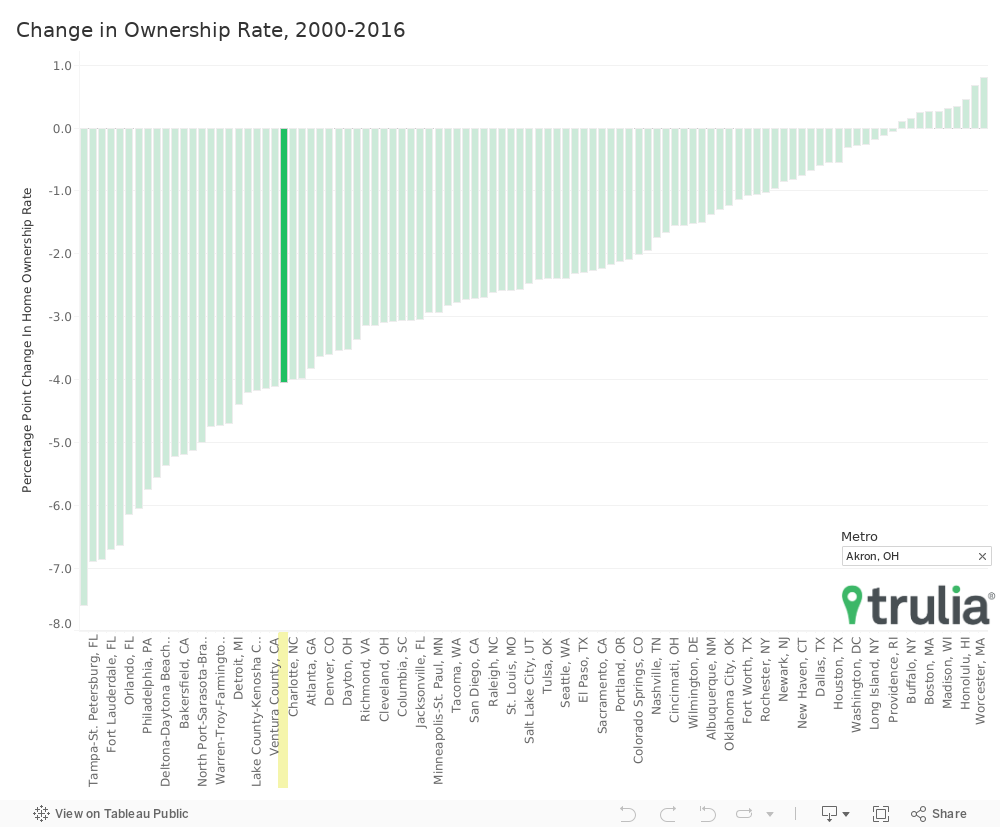
From 2000 to 2016 home ownership rates fell in 90 of the 100 largest metro areas.
Places like Cape Coral, Fla., Las Vegas, and Phoenix have seen the most dramatic shifts to renting from home ownership, while many of the Northeast metros have bucked the national trend and seen an increase in home ownership.
Looking more closely at the geography of homeownership changes, we found some dramatic shifts neighborhood to neighborhood within individual cities. Even within markets such as Houston, and New York, where the home ownership rates are close to what they were in 2000, some ZIP codes have seen drops in ownership rates by as much as 33 percentage points while others have seen ownership rise by up to 18 percentage points.
With much of the 2000s and early 2010s being a story of housing boom, bust, and recovery, the national home ownership rate rose to 69.2% in 2004, up from 67.1% in 2000, when rates were already beginning to climb from the historical average of around 65%. Then, even before the recession started, ownership began to fall and eventually came crashing back down to as low as 62.9% in mid-2016. Looking just at this 16-year period allows us to see where home ownership has shifted beyond national and local trends.
Here are some of our findings:
- Of the 10 metros that have seen a rise in home ownership, all but Honolulu are in the Northeast.
- Nationally, 72.4% of larger ZIP codes (with at least 1,000 occupied housing units) have had a decrease in their home ownership rate from 2000 to 2016.
- The Georgia Tech neighborhood in Atlanta (ZIP code 30313) where median household income has more than tripled, has seen the largest swing to home ownership going to 32.5% in 2016 up from 13.1% owner in 2000.
- The Western Glendale area in Phoenix (85305) has seen the single largest drop in ownership rate, going to 50.5% from 92.6% following the construction of almost 2,000 apartment units over the past 16 years in the area.
Where U.S. Homeownership Has Declined, 2000-2016
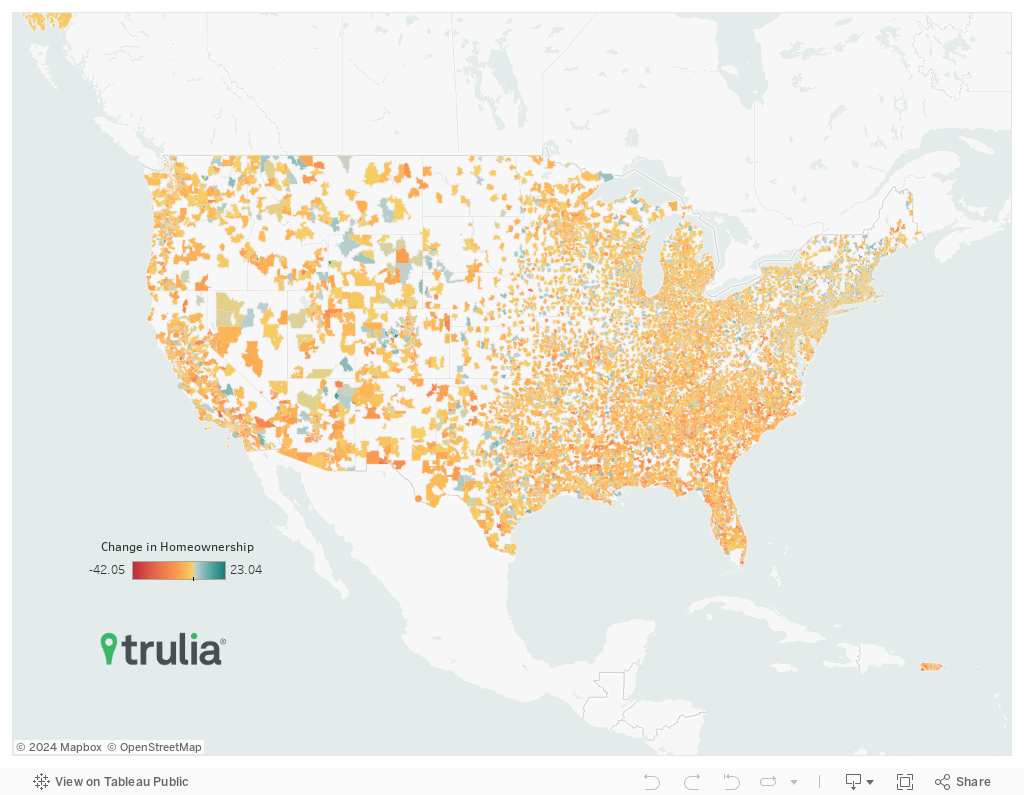
Home Ownership on the Wane
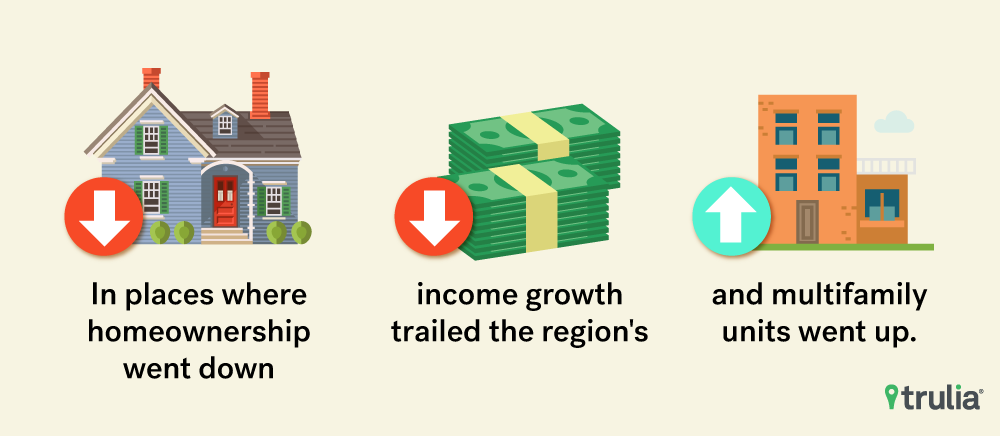
Taking a closer look at some of the ZIP codes that have swung the furthest toward more renters among the 100 largest metros, we see that none of them are in any of the northeast metros, and most are in the southwest, Texas, or Florida. The ownership rate in places like Maryvale (85037) in Phoenix, North San Jose (95134), and Riverview (63137) in St. Louis have all dropped by more than 27 percentage points despite differing economic realities. All the zip codes in this top 20 list have one thing in common though: occupied multifamily units are making up an increasing share of all occupied housing units. Whether that is happening amid an environment of multifamily development and population growth, like in Maryvale or North San Jose, or one of population loss among single family home owners, the dynamics of the neighborhood have shifted dramatically in these places. In addition, nearly all of these places have seen household income growth lag behind the metro areas of which they are a part.
Neighborhoods Where Homeownership Grew
On the other end are places that have swung dramatically toward ownership. This list has an interesting mix of dense, downtown areas and suburban areas that went from large lots and farm land to sprawling single family tract development over the 16-year period. With a few exceptions, household incomes have generally grown more quickly in these places relative the metros they are a part of. Included on this list are places like the Second Ward (77003) in downtown Houston and the Pearl District (97209) in Portland, Ore., which have both undergone dramatic shifts from light industrial and warehouse space to residential development, as well as the less-central North Irving around the Dallas-Fort Worth Airport (75039) and the New Tacoma area east of downtown Tacoma, Wash., (98424).
What Drives the Changes?
Across most ZIP codes, knowing how the occupied housing stock has changed (if at all) and how household income has changed over that same time period can give you a pretty good sense of where ownership rates have moved. Just looking at ZIP codes within the 100 largest metros, ZIP codes that have seen ownership rates fall have seen their occupied housing stock shift towards multifamily structures at 1.5 percentage points beyond the overall trend of their respective metros. Those neighborhoods where ownership rates have grown have seen the occupied housing stock shift 2.2 percentage points toward more single-family homes and townhomes.
In places that haven’t seen much of a change in the makeup of their housing stock, changes in household income also help explain changes in ownership rates. ZIP codes that have seen ownership climb have also seen household income grow a median 3.6 percentage points faster than their metro’s while household income growth in neighborhoods moving toward more renters has lagged behind that of the metros they are in by a median 6.8 percentage points.
Taking a second look at ZIP codes that have shifted the furthest from owning to renting, most of these extremes have seen a jump in the proportion of occupied housing units that are in multifamily structures. In fact, 16 of the top 20 neighborhoods with the largest shift toward rentership have seen more than a 15 percentage points shift towards more occupied multifamily housing units. All but two of them have had household income growth lag behind that of the overall cities of which they are a part.
How Neighborhood Homeownership May Be Shaped in the Future

