As peak home-buying season hits the high-water mark, signs are pointing to another season marked by low inventory, fierce competition, decreased affordability, and quick listing turnaround.
Just how quick? The median number of days on Trulia – the number of days between when a listing initially shows up and when it is officially sold – is at a post-recession low of 64 days based on preliminary[1] data on homes sold in April.
Even more striking – a home is already in some phase of contract and likely no longer available to shoppers for some of that time and, in a typical year, homes sold in June have been on the market the shortest amount of time, meaning things are only likely to keep heating up.
Here are some key takeaways from the analysis:
- List-to-sale time on Trulia fell nine days or 16.9% to 64 days from 77 days a year ago. The median has been down every year since 2010. It’s down 53.3% (from 137 days) since April of 2010.
- The previous record-low was set in July of last year at 71 days. In 2010, the low for the year was 107 and occurred during the months of July and August.
- Trade-up homes are moving the most quickly at 57 days, followed closely by starter homes at 59 days and premium homes 72 days.
- The markets with listings that have shortest list-to-sale time on Trulia are all in the West while those that have the longest are all in the East.
[1] See methodology

List-to-Sale Time on Trulia Goes Ever Downward
Looking over the past 8 years, a pretty clear trend emerges. The median list-to-sale time on Trulia has been in steady decline. This is true across starter, trade up and premium home tiers and across all of the largest 100 metro areas and the nation’s non-metropolitan areas. As of April 2018, the top 10 places where homes are moving the most quickly are all at 45 days or fewer from listing to closing with Seattle, San Francisco, and San Jose, Calif., all tied at 36 days. The places with the longest median Days on Trulia include Syracuse, N.Y., Long Island, N.Y., and New York, where homes are active for a median of more than 125 days. Other markets that make up the top 10 in terms of length of Days on Trulia are in Florida, Pennsylvania, and New Jersey.
List-to-Sale Time on Trulia is Down in All Regions of the Country, Some More So Than Others
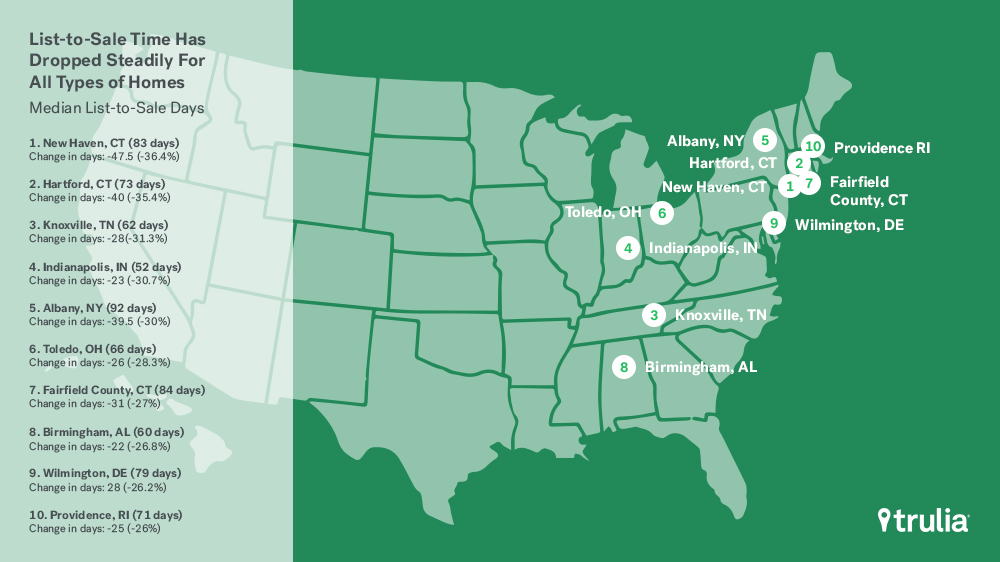
Of the largest 100 metro areas, not a single has seen their median list-to-sale time on Trulia increase from the same time 8 years ago, and only three have increased since last year. Since 2010, the most dramatic drops in list-to-sale time have been seen in places like Winston-Salem, N.C., Salt Lake City and Tacoma, Wash., which have all seen their list-to-sale time fall by more than 70%. Syracuse is the only metro that has remained nearly flat over that time period, dropping by 0.3%. Honolulu is in a distant second after Syracuse in terms of the smallest percentage decline, with Days on Trulia falling by 28.4% since 2010. Looking just more recently, since last April, Syracuse, New Orleans and Honolulu are the only three metros that have seen their list-to-sale time increase. The cities that have seen the most dramatic declines in Days on Trulia include places like New Haven, Conn., Hartford, Conn., Knoxville, Tenn., and Indianapolis, all of which have dropped by more than 30% from last April.
| Places With the Longest and Shortest List-to-Sale Times | |||
| Longest List-to-Sale Metro Areas | Longest List-to-Sale Time (Days) | Shortest List-to-Sale Metro Areas | Shortest List-to-Sale Time (Days) |
| Syracuse, NY | 144 | Portland, OR | 45 |
| Long Island, NY | 132 | Sacramento, CA | 45 |
| New York, NY | 128 | Tacoma, WA | 44 |
| Non-Metro Areas | 117 | Colorado Springs, CO | 43 |
| Miami, FL | 115.5 | Salt Lake City, UT | 42 |
| Pittsburgh, PA | 99 | Denver, CO | 41 |
| Newark, NJ | 98 | Oakland, CA | 38 |
| Camden, NJ | 97.5 | San Francisco, CA | 36 |
| Albany, NY | 92 | San Jose, CA | 36 |
| Buffalo, NY | 91 | Seattle, WA | 36 |
Premium Homes Are on the Market Longer
Nationally, the days that starter and trade-up homes are on Trulia seem to track together closely and generally move off the market slightly faster than premium homes. As of April, premium homes were active on Trulia for 13 days more than starter homes and 15 days more than trade-up homes. This gap is expected to shrink though for May, June, July and August as premium home sell much more quickly during peak home-buying months. Looking beyond this seasonality, during the 12 months ending April 2018, premium homes sat on the market a median of 19.5 and 23.2 days longer than starter and trade up homes, respectively. This gap has widened slightly over the past two years, up from 14.5 and 22.4 days during the same 12-month period a year ago and 13.8 and 19.1 days 2 years ago.
Taking a more local look, of the 100 largest metros only Detroit and Toledo, Ohio, have had trade-up homes stay on the market longer than premium homes during the past year. Both of these places also had their starter homes stay on the market longer than premium homes, but that is less uncommon as 24 of the 100 largest metros have had this trend over the past year. Many of the places that are bucking the national trend with starter and/or trade up homes sitting on the market longer than premium homes are also among those that have the most premium-home search interest toward premium homes beyond the national rate in our Market Mismatch report. The metros where premium homes move faster off the market are also places where search interest is more heavily concentrated in premium market than the country as a whole.
| List-to-Sale – Markets Where Premium Homes Outpace Starter Homes (12 Months Ending April 2018) | |||||
| Metro Area | Premium to Starter Gap in Days on Trulia | Premium Days on Trulia | Starter Days on Trulia | Trade up Days on Trulia | |
| Detroit, MI | -31.1 | 70.4 | 101.4 | 82.2 | |
| Birmingham, AL | -27.3 | 86.3 | 113.6 | 77.6 | |
| Dayton, OH | -18.6 | 75.1 | 93.7 | 72.7 | |
| Memphis, TN | -14.8 | 75.5 | 90.3 | 62.3 | |
| Newark, NJ | -10.7 | 113.0 | 123.7 | 106.7 | |
| Little Rock, AR | -9.8 | 93.0 | 102.8 | 83.5 | |
| Greensboro-High Point, NC | -9.5 | 85.6 | 95.1 | 67.8 | |
| Washington, DC | -7.2 | 70.2 | 77.4 | 66.1 | |
| Albany, NY | -7.0 | 107.7 | 114.7 | 95.7 | |
| St. Louis, MO | -6.2 | 78.1 | 84.3 | 64.0 | |
What does all this this mean for people currently in the market selling and buying homes? As with many housing market metrics, what this means for you depends on whether you are a buyer or a seller. Sellers generally appreciate getting their home sold as quickly as possible, while buyers can benefit from having some breathing room to make decisions and negotiate. Nationally, this makes the trend of home moving faster off the market over the past 8 years tougher and tougher for those looking to buy a home.
Methodology
List-to-sale time on Trulia measures the median amount of time in which homes that were sold during a given period were on the market over a given geography while attempting to remove foreclosure and real estate owned (REO) sales. For this report, we looked at monthly intervals of home sales going back to January of 2010.
Typical measures of days on market usually count the time between listing and when a home goes under contract. Our measure tracks the number of days between listing and when a home’s official transaction date occurred based on public records. This can make our measure of days on market look longer than the industry standard but, we feel, also better represents the actual time it is taking for transactions to go through the whole process.
National and local Days on Trulia figures by price tier are calculated using starter, trade up, and premium price tiers for all metropolitan areas (or divisions where available) in the country. We define the price cutoffs of each tier based on home value estimates of the entire housing stock, not listing price. For example, we estimate the value of each single-family home and condo and divide these estimates into three groups: the lower third we classify as starter homes, the middle third as trade-up homes, and the upper third as premium homes. We classify a listing as a starter home on the market if its listing price falls below the price cutoff between starter and trade-up homes.

