How We Track This Uneven Recovery
Since February 2012, Trulia’s Housing Barometer has charted how quickly the housing market is returning to “normal” based on several indicators. The recovery is uneven and some housing activities are improving faster than others. Our Barometer highlights five measures:
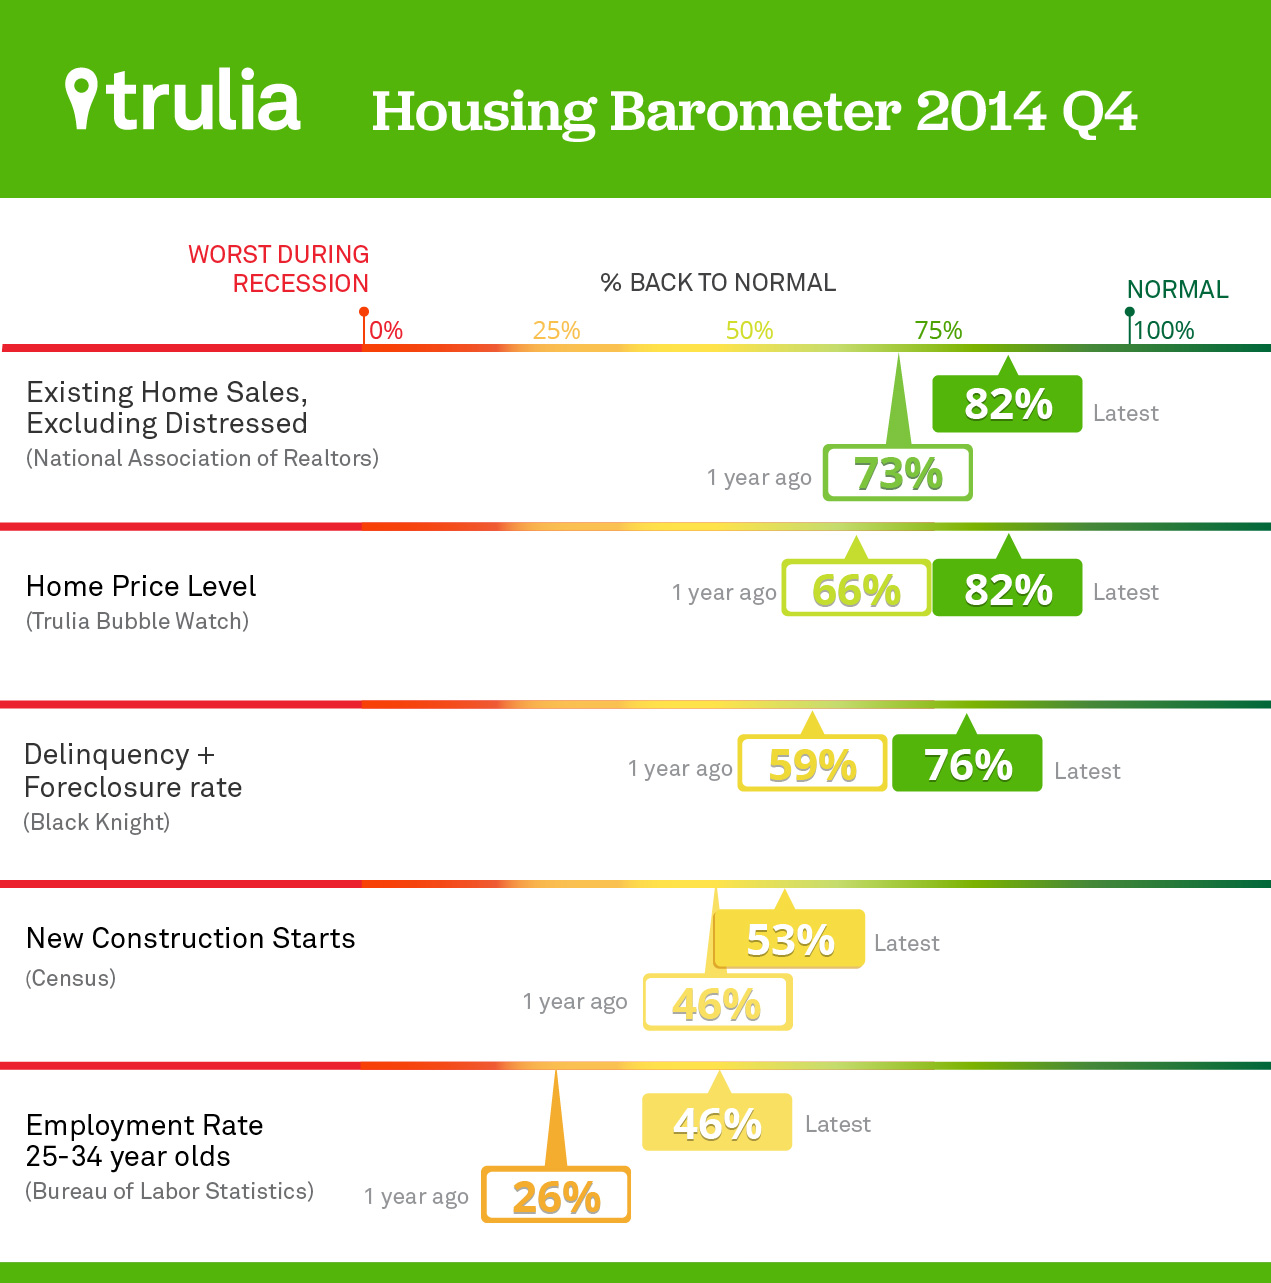
- Existing home sales, excluding distressed sales (National Association of Realtors, NAR).
- Home-price levels relative to fundamentals (Trulia Bubble Watch).
- Delinquency plus foreclosure rate (Black Knight, formerly LPS).
- New construction starts (Census).
- The employment rate for 25-34 year-olds, a key age group for household formation and first-time homeownership (Bureau of Labor Statistics, BLS).
Home prices from our Bubble Watch are reported quarterly. The other four measures come out monthly. To reduce the volatility of these measures, we use three-month moving averages, that is, the average over the past three months recalculated each month. For each indicator, we compare the latest data with its worst reading during the housing bust and its pre-bubble normal level.

Most Barometer Measures are Three-Quarters Back to Normal
All five Housing Barometer indicators made good progress over the past year and also improved from the previous quarter. Employment among young adults—which had been the laggard indicator—posted the largest gain. Prices and the delinquency plus foreclosure rate also took big steps toward normal.
| Housing Indicators: How Far Back to Normal? | |||
| Now | One quarter ago | One year ago | |
| Existing home sales, excl. distressed | 82% | 80% | 73% |
| Home price level | 82% | 73% | 66% |
| Delinquency + foreclosure rate | 76% | 74% | 59% |
| New construction starts | 53% | 49% | 46% |
| Employment rate, 25-34 year-olds | 46% | 39% | 26% |
| Note: For each indicator, we compare the latest available data to its worst reading during the housing bust and its pre-bubble normal level. | |||
- Existing home sales, excluding distressed, were 82% back to normal in November, up slightly from 80% one quarter ago and 73% one year ago. Foreclosure and short sales declined, and nondistressed sales rose 8% year-over-year in November. However, new home sales continued to lag. As a result, existing home sales dominated the market even more than usual. The ratio of existing to new home sales was 11 to 1—well above the long-term normal ratio of 6 to 1.
- Home prices moved closer to normal. Nationally, prices were just 2.4% undervalued in the fourth quarter of 2014, according to Trulia’s Bubble Watch. That compares with 13.5% undervalued at the worst of the housing bust. Prices are now four-fifths of the way back to normal, that is, the level at which they’re neither over- nor undervalued. At the local level too, prices are nearing normal. Seventy of the 100 largest metros are now less than 10% over- or undervalued—the highest number since the recovery began.
- The delinquency plus foreclosure rate was 76% back to normal in November, up considerably from 59% one year ago. Fewer borrowers are at risk of delinquency as the share declines of homeowners who are underwater—those who owe more on their homes than the properties are worth.
- New construction starts are 53% back to normal, the same as one quarter ago and up from 46% one year ago. In 2014, through November, multiunit construction accounted for 34% of all new home starts—the highest share for any year since 1973. Multiunit starts are booming and should end 2014 at the highest level since 1988. At the same time though, single-family starts are running far below pre-bust levels. As a result, starts overall are just past halfway back to normal, lagging behind the recoveries in sales, prices, and the delinquency plus foreclosure rate.
- Employment for young adults leapt ahead in the past year: finally, the youngsters are finding work. The three-month average in December showed that 76.3% of adults age 25-34 were employed. At 46% back to normal, that’s near the halfway mark. Young adults need jobs in order to move out of their parents’ homes, form their own households, and eventually become homeowners. For those reasons, the housing recovery depends on millennials getting jobs. Among 25-34 year-olds, just 12% who are employed live with their parents versus 21% of those who aren’t collecting a paycheck.
How much longer will the recovery take? It will depend on the two lagging measures—construction starts and young-adult jobs. While multiunit starts have roared back, single-family construction is being restrained by low household formation and a still-elevated vacancy rate. Those young adults who took jobs in the past year aren’t yet buying single-family homes. It typically takes years to save for a down payment and build up an income history. So those who got hired last year—or who will find work this year—won’t be buying homes for several years to come. Affordability is an especially big challenge for young adults. Prices are rising faster than incomes and millennials are clustering in less-affordable markets where buying is further out of their reach. Despite progress, the recovery lurches ahead unevenly and still has a way to go.
NOTE: Trulia’s Housing Barometer tracks five measures: existing home sales excluding distressed (NAR), home prices (Trulia Bubble Watch), delinquency + foreclosure rate (Black Knight), new home starts (Census), and the employment rate for 25-34 year-olds (BLS). Also, our estimate of the normal share of sales that are distressed is 5%; Black Knight reports that the share was in the 3-5% range during the bubble. For each measure, we compare the latest available data to (1) the worst reading for that indicator during the housing bust and (2) its pre-bubble normal level. We use a three-month average to smooth volatility for the four indicators that are reported monthly (all but home prices). The latest data are from December for the employment rate; November for existing home sales, new construction starts, and the delinquency + foreclosure rate; and the fourth quarter for home prices.