In December 2015, new home sales increased month-over-month by 10.8%, and increased by 9.9% year-over-year. However, both of these numbers should be taken lightly because the margin of error is wide and includes zero. In other words, we can¹t be certain whether the month-over-month or year-over-year actually increased, decreased, or stayed flat.
A better number to look at is the year-to-year change in new home sales, which is up 14.5% on a calendar year basis from 2014. This reflects a slow but steady increase in demand from homebuyers as well as increasing confidence of homebuilders. It also a positive sign for the U.S. economy headed into 2016, as new home sales leads to new construction and consumer demand for housing-related goods and services.
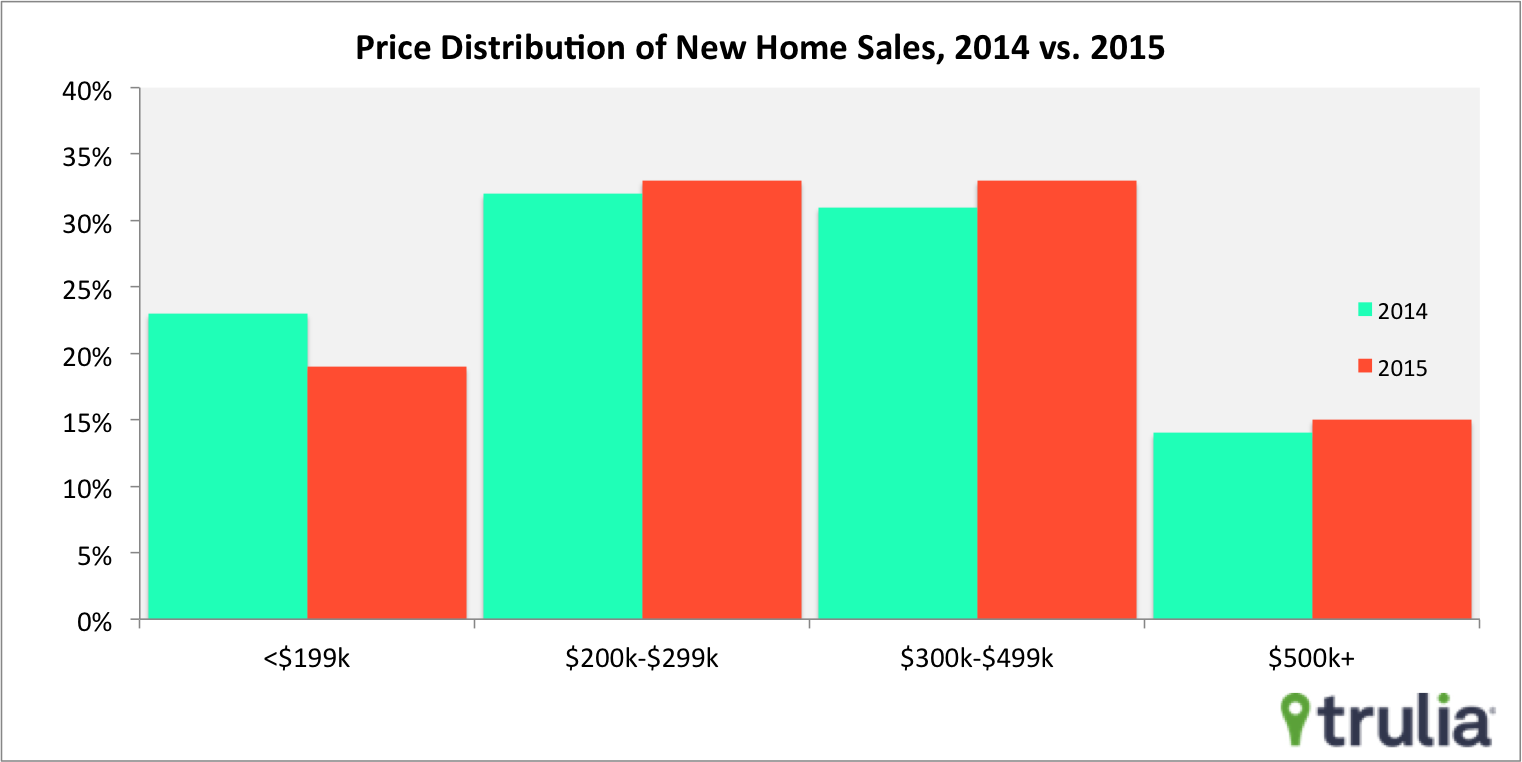
The report also brings mixed news for new homebuyers. On the positive side, new inventory remains relatively stable at around 5.7 months, which means prices for unsold new homes are unlikely to rise much going into the spring buying season. The somber news is that new starter homes continue to make up a relatively low share of new homes. Just 19% of new home sales were below $200,000 in 2015, down from 23% in 2014. This is likely due to a combination of low inventory of new starter homes and fewer first-time homebuyers.

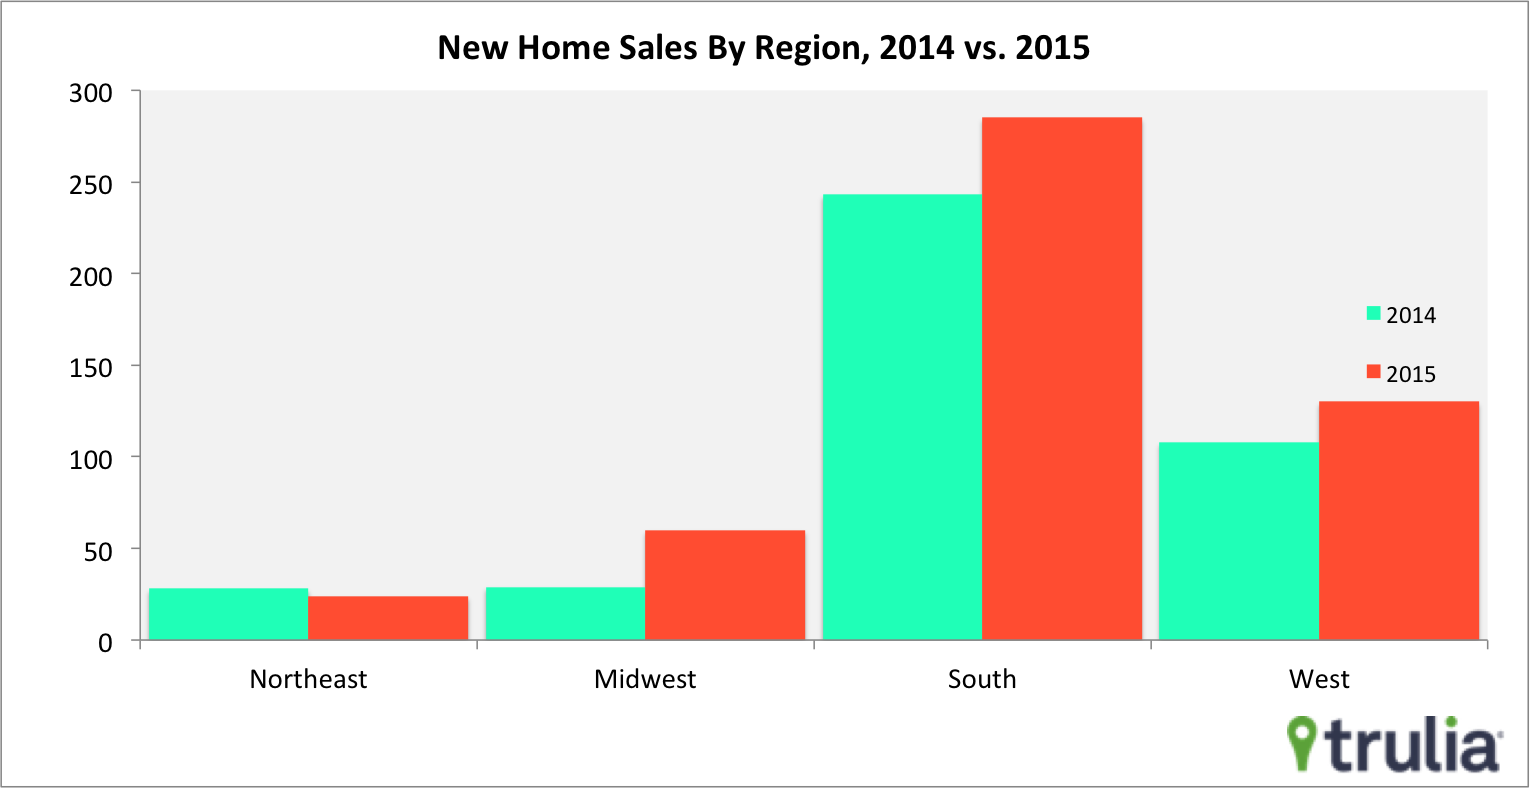
Last, much of the increase in year-to-year home sales was due to increasing activity in the West and South. New home sales increased in the West by 20.5% and by 17.6% in the South. This is especially good news for homebuyers along the costly West Coast who have faced low inventory and sharp price increases over the past three years.

New Home Sales Summary:
- New home sales in December were up 9.9% year-over-year, and 10.8% month-over-month, but both of these numbers aren¹t statistically significant.
- Year-to-year, the numbers were great: 2015 totals were up 14.5% from 2014 for total starts.
- There was some regional variation in new home sales: the West led the pack with 20.5% growth in 2015 over 2014, followed by the South with 17.6% growth.


