New home sales in March were at a seasonally adjusted rate of 511,000, which is down 1.5% month-over-month but up 5.14% year-over-year. The month-over-month drop is due more to last month’s upward revision to 519,000 from 512,000 than a fundamental change in demand for new homes. In addition, new home sales numbers from the U.S. Census are extremely volatile: the margin of error is wide and often includes zero, which means we can’t be certain whether these month-over-month or year-over-year changes actually increased, decreased, or stayed flat.
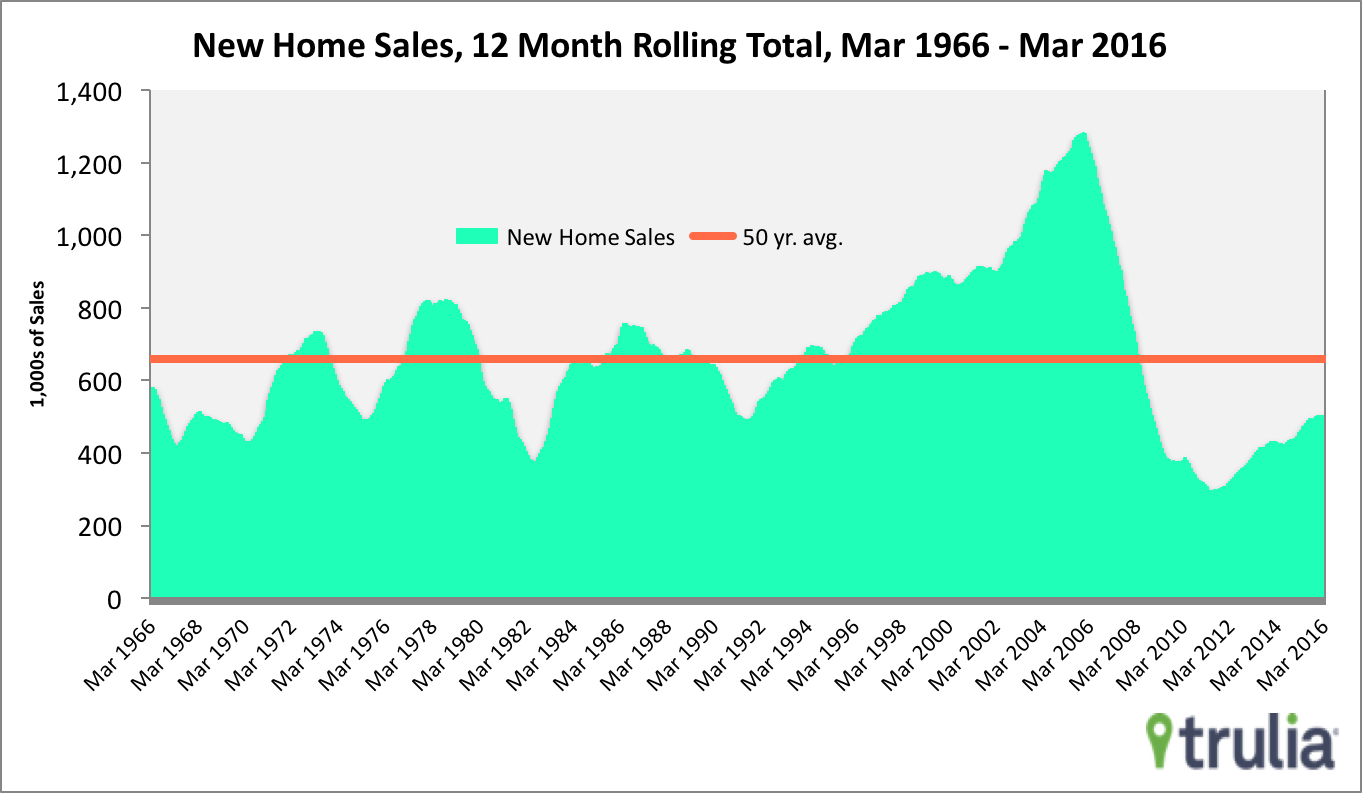
A better number to look at is the 12-month rolling total, which is up 8.9% year-over-year but flat month-over-month. This reflects a steady increase in demand from homebuyers as well as increasing confidence of homebuilders. That said, there are two caveats on the upside. First, the year-over-year increase is down from 9.7% last month. Second, still remain about 24% below the 50-year average.

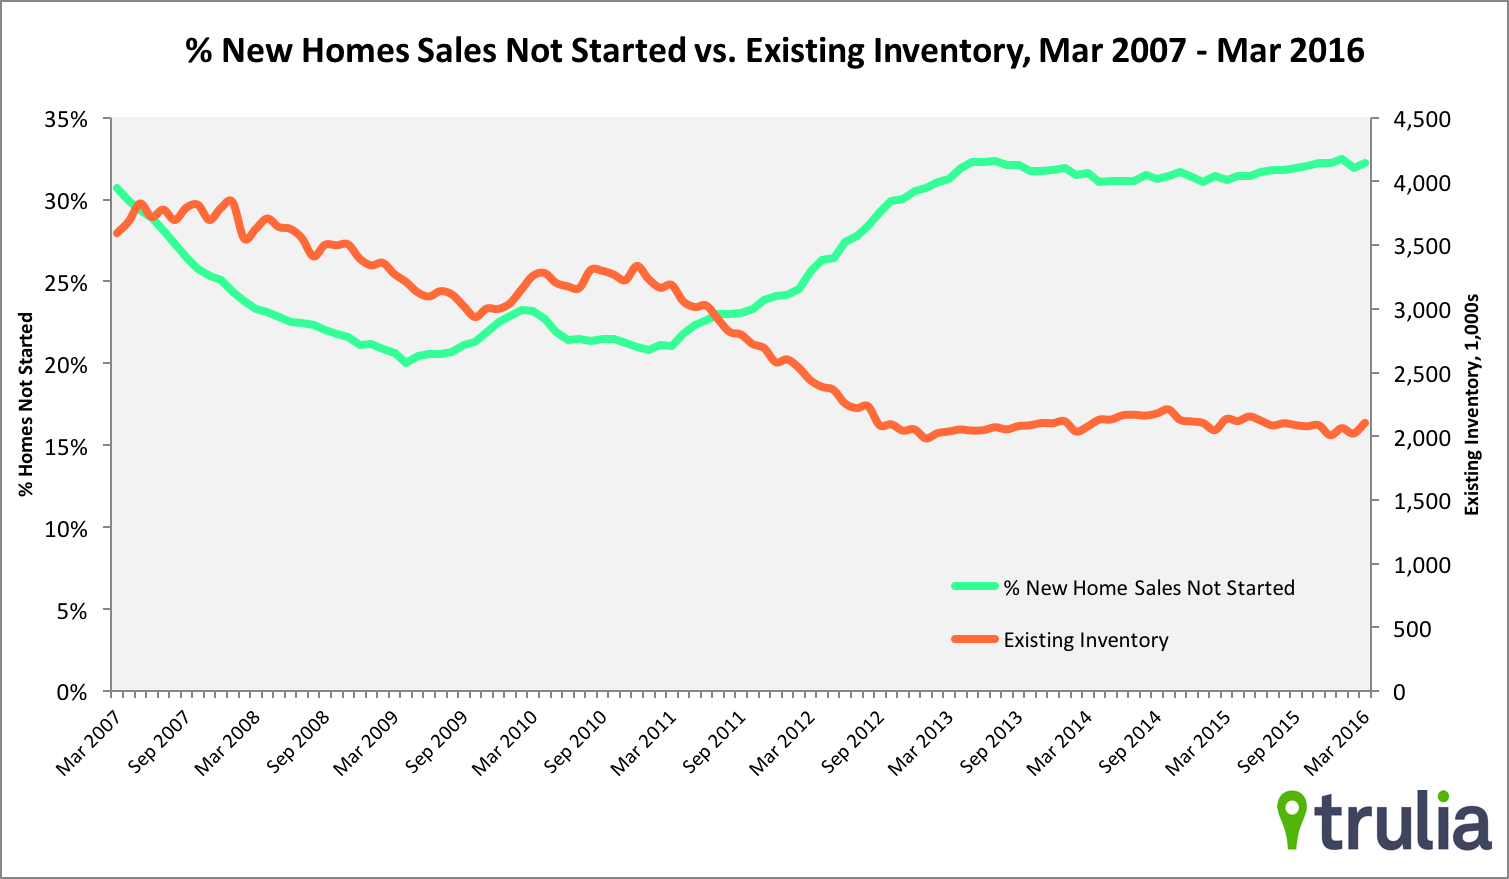
Last, the share of new home sales bought off a plan continues to hover near a 10-year high of 32%. Persistently low inventory of existing homes is making it difficult for homebuyers to find properties to buy, and pushes prospective buyers away from existing homes towards new homes. This allows builders to sell more new homes that haven’t yet been built.

New Home Sales Summary:
- New home sales in March were up 5.4% year-over-year, and down5% month-over-month, but both of these numbers aren’t statistically significant.
- The 12-month rolling total of new home sales was solid: March 2016 totals were up 8.9% but flat month-over-month.
- The share of new home sales purchased off a plan continues to hover near a 10-year high of 32%.

