
New college grads take note: there’s more to a great start to your career than living in an area with high salary and strong job growth. After all, what good is that high salary if most of it is spent on rent? What happens if you can’t find a replacement job if your current one doesn’t work out? And what if there are few peers to revel with in post-college life?
To help make a difficult decision a little bit easier, we’ve partnered with LinkedIn to rate 40 of America’s strongest job markets based on what they have to offer recent college grads. Our Graduate Opportunity Index ranks metropolitan areas based on three criteria: (1) the LinkedIn New Grad Job Score, which rates metros based on the share of job openings suitable for recent college grads, (2) Trulia’s New Grad Affordability Score, which is the share of rental units considered as affordable to a new grad based on their median salary, and (3) the share of total population that is between the ages of 22 and 30 with a college degree.
Go East, Not West, Young Grad
While the West makes headlines with high wages and strong job growth, the East is tough to beat for new college grads looking to start their career. Of the top 10 metros offering the best perks, all are east of the Rockies and nine are either on, or east, of the Mississippi River. Pittsburgh tops our ranking because it scores high in all three components: it’s first on the LinkedIn New Grad Index, a high share (92%) of its housing stock could affordably be rented to recent college grads, and more than 5% of its population is composed of educated young persons.
| Rank | U.S. Metro Area | Graduate Opportunity Index | LinkedIn New Grad Job Score | Trulia New Grad Affordability Score | % of Population New Grads |
|---|---|---|---|---|---|
| Click here to download the data for all 40 ranked metros | |||||
| 1 | Pittsburgh, PA | 0.85 | 1.00 | 91.8 | 5.3% |
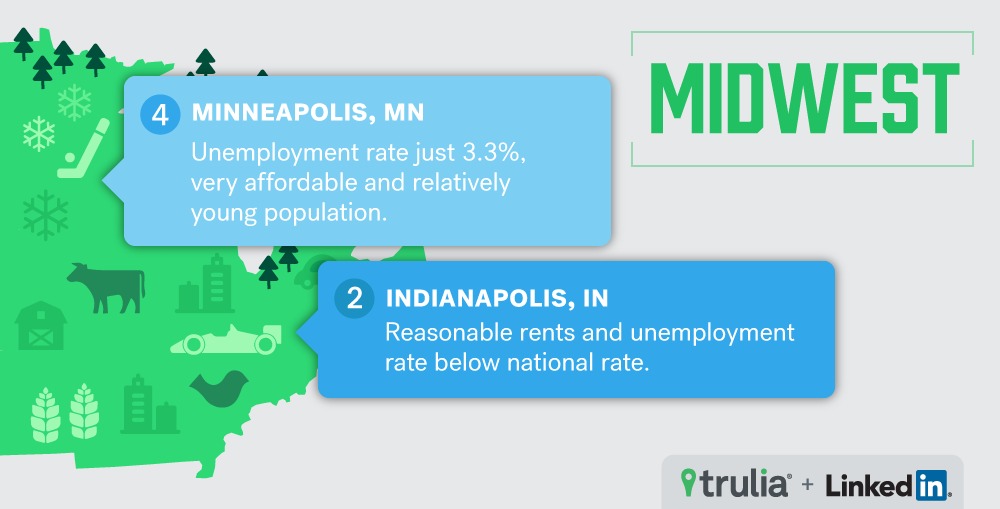
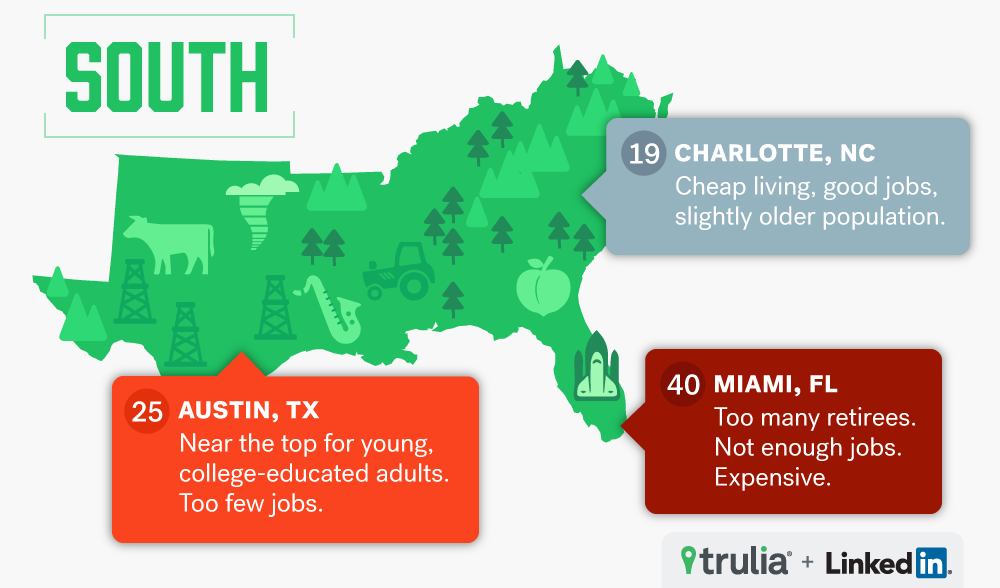
| 2 | Indianapolis, IN | 0.80 | 0.94 | 93.5 | 4.3% |
| 3 | Kansas City, MO | 0.75 | 0.92 | 93.0 | 4.1% |
| 4 | Minneapolis-St. Paul, MN | 0.74 | 0.73 | 94.1 | 5.5% |
| 5 | Columbus, OH | 0.73 | 0.90 | 91.5 | 4.9% |
| 6 | Montgomery, Bucks, Chester counties, PA | 0.69 | 0.97 | 83.2 | 4.9% |
| 7 | Nashville, TN | 0.68 | 0.93 | 85.5 | 4.8% |
| 8 | Philadelphia, PA | 0.67 | 0.76 | 91.0 | 5.6% |
| 8 | Chicago, IL | 0.67 | 0.79 | 89.6 | 5.6% |
| 10 | Cincinnati, OH | 0.63 | 0.81 | 92.6 | 4.0% |
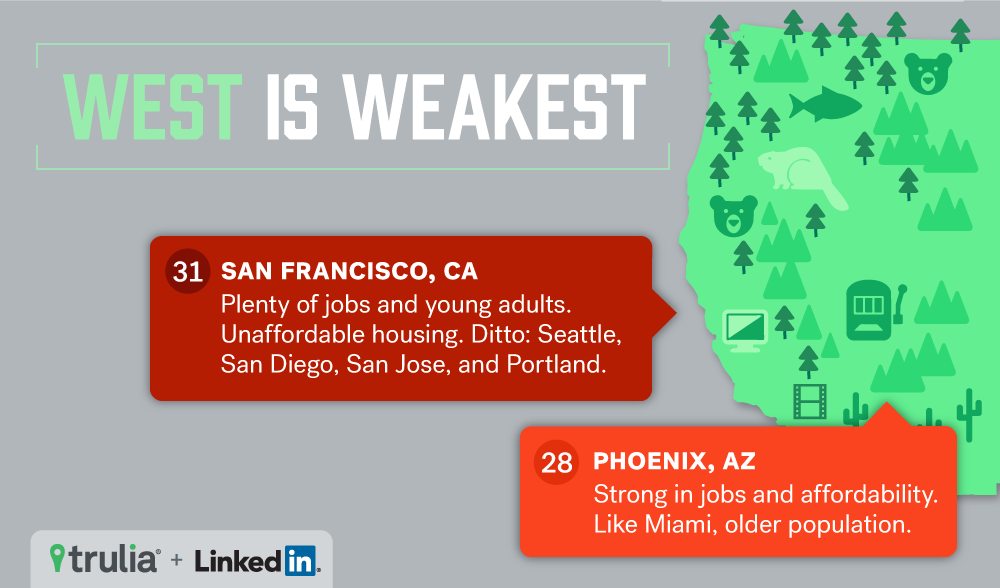
On the West Coast, things don’t look as prosperous. Of the 10 metros that score the lowest on the Graduate Opportunity Index, nine are on or near the Pacific. The only non-western metro – Miami – had the lowest score due to few graduate jobs, only moderate affordability, and few recent college grads. Of the remaining nine, eight are in California. California dominates the worst markets for one primary reason: it doesn’t have many homes affordable for recent grads. Each California metro to bottom out the index is ranked among the ten least affordable markets. The only saving grace for new grads looking to the Golden State are an abundance of peers: California metros ranks high on the share of its population between the ages of 22 and 30 with a college degree. . Remember, even though they rank at the bottom of our overall index, these metros have strong job markets overall — including jobs for all levels of income and experience — as measured by listings. That’s how they made our list.
| Rank | U.S. Metro Area | Graduate Opportunity Index | LinkedIn New Grad Job Score | Trulia New Grad Affordability Score | % of Population New Grads |
|---|---|---|---|---|---|
| Click here to download the data for all 40 ranked metros | |||||
| 40 | Miami, FL | 0.19 | 0.69 | 43.4 | 3.2% |
| 39 | Los Angeles, CA | 0.28 | 0.69 | 17.7 | 4.2% |
| 38 | Orange County, CA | 0.32 | 0.73 | 6.1 | 4.5% |
| 36 | Portland, OR | 0.35 | 0.85 | 49.6 | 3.2% |
| 36 | Sacramento, CA | 0.35 | 0.76 | 63.4 | 3.7% |
| 35 | San Jose, CA | 0.36 | 0.62 | 26.9 | 6.2% |
| 34 | Oakland, CA | 0.37 | 0.70 | 20.0 | 5.0% |
| 33 | Riverside-San Bernardino, CA | 0.38 | 0.94 | 35.6 | 2.1% |
| 32 | San Diego, CA | 0.38 | 0.72 | 45.0 | 4.8% |
| 31 | San Francisco, CA | 0.39 | 0.54 | 28.1 | 9.1% |
High Wages May Not Always Lead to the High Life
Graduates Lured by high wages in San Francisco and San Jose might want to think twice. While incomes for recent college grads in these areas are among the highest in the country, high rents will eat up much of it. Fewer than a third of homes would rent at an affordable price point, and the median rent in both of these markets come close to consuming an entire month’s paycheck. What’s more, both metros score only modestly on the share of job openings suitable for recent grads, so finding another entry-level job if you leave your existing one may be difficult.
| Markets With the Highest Median Income for New Grads | |||||
| # | U.S. Metro | Median College Grad Income | Median Rent Estimate | Trulia Affordability Score | LinkedIn New Grad Job Index |
| 1 | San Francisco, CA | $48,000 | $4,500 | 28.1 | 0.54 |
| 2 | Washington, DC | $41,000 | $2,200 | 88.6 | 0.55 |
| 3 | Houston, TX | $40,000 | $3,700 | 91.3 | 0.78 |
| 4 | San Jose, CA | $40,000 | $1,649 | 26.9 | 0.62 |
| 5 | Boston, MA | $38,400 | $2,500 | 81.4 | 0.65 |
| 6 | Minneapolis-St. Paul, MN | $37,500 | $1,650 | 94.1 | 0.73 |
| 7 | Baltimore, MD | $37,000 | $1,700 | 91.3 | 0.68 |
| 8 | Dallas, TX | $37,000 | $1,800 | 88.5 | 0.72 |
| 9 | Atlanta, GA | $36,000 | $2,395 | 78.7 | 0.47 |
| 10 | Austin, TX | $35,000 | $2,470 | 72.6 | 0.63 |
| Click here to download these data for all 40 ranked metros. | |||||
On the West Coast, things don’t look as prosperous. Of the 10 metros that score the lowest on the Graduate Opportunity Index, nine are on or near the Pacific. The only non-western metro – Miami – had the lowest score due to few graduate jobs, only moderate affordability, and few recent college grads. Of the remaining nine, eight are in California. California dominates the worst markets for one primary reason: it doesn’t have many homes affordable for recent grads. Each California metro to bottom out the index is ranked among the ten least affordable markets. The only saving grace for new grads looking to the Golden State are an abundance of peers: California metros ranks high on the share of its population between the ages of 22 and 30 with a college degree. . Remember, even though they rank at the bottom of our overall index, these metros have strong job markets overall — including jobs for all levels of income and experience — as measured by listings. That’s how they made our list.
| Rank | U.S. Metro Area | Graduate Opportunity Index | LinkedIn New Grad Job Score | Trulia New Grad Affordability Score | % of Population New Grads |
|---|---|---|---|---|---|
| Click here to download the data for all 40 ranked metros | |||||
| 40 | Miami, FL | 0.19 | 0.69 | 43.4 | 3.2% |
| 39 | Los Angeles, CA | 0.28 | 0.69 | 17.7 | 4.2% |
| 38 | Orange County, CA | 0.32 | 0.73 | 6.1 | 4.5% |
| 36 | Portland, OR | 0.35 | 0.85 | 49.6 | 3.2% |
| 36 | Sacramento, CA | 0.35 | 0.76 | 63.4 | 3.7% |
| 35 | San Jose, CA | 0.36 | 0.62 | 26.9 | 6.2% |
| 34 | Oakland, CA | 0.37 | 0.70 | 20.0 | 5.0% |
| 33 | Riverside-San Bernardino, CA | 0.38 | 0.94 | 35.6 | 2.1% |
| 32 | San Diego, CA | 0.38 | 0.72 | 45.0 | 4.8% |
| 31 | San Francisco, CA | 0.39 | 0.54 | 28.1 | 9.1% |
On the other hand, several of 10 metros with highest grad wages are also quite affordable. For example, recent grads who earn the median income of their peers would be able to afford 94% of rental units in Minneapolis, while those in Houston can afford over 91%. The other good news? Both of these markets also rank high on the LinkedIn Job Score, so moving between entry-level jobs is easy.
The Capstone
The lesson here for recent grads is that although it may be tempting to seek out places with the highest wages, doing so may not necessarily lead to a better quality of life because these areas also have high rents and a lower share of entry level jobs. Recent grads need to balance wages, rents, and job availability, so places like Pittsburgh, Minneapolis, and Philadelphia, fit the bill. However, in places like Miami and San Francisco, not only are affordable rental units few and far between, but fewer jobs are available for the matriculated.
Methodology
Our Graduate Opportunity Index ranks 40 metropolitan areas based on three criteria: (1) the LinkedIn New Grad Job Score, which rates metros based on the share of job openings suitable for recent college grads, (2) Trulia’s New Grad Affordability Score, which is the share of rental units designated as affordable (less than 30% of monthly income) to the median income college graduate between the ages of 22 and 30, and (3) the share of total population that is between the ages of 22 and 30 with a college degree, as per 2014 American Community Survey data. Our final list of 40 metros is a result of restricting metropolitan areas to having at least 1,000 grad-level jobs and 10,000 total jobs. We combine our three metrics to create a weighted average of each metro’s ranking in each category. The weighting scheme is as follows: LinkedIn New Grad Job Score (33%), Trulia’s New Grad Affordability Score (33%), and share of total population that is between the ages of 22 and 30 with a college degree (33%). The index ranges from 0 – 1, with 1 being the best scoring and 0 being the worst.

