Depending on where you live, utility bills can have a huge impact on housing affordability – something that’s especially true in less expensive areas where what looks like a bargain on paper may not really end up being a bargain.
Trulia partnered with UtilityScore to find out how much of the monthly budget utility bills cost households in single family homes. With winter around the corner, if you are moving to a new place or into a single family home for the first time, either as a first time home buyer or renter, you could be in for a costly surprise.
Before we get into the findings, keep in mind that we use utility costs as a percentage of home value. We use that number to help us measure monthly housing costs for both renters and owners. There are other variables too; insurance, taxes and mortgage interest among them. Where noted we’ve used estimates of those costs in our overall monthly costs.
Here are a few highlights from what we found:
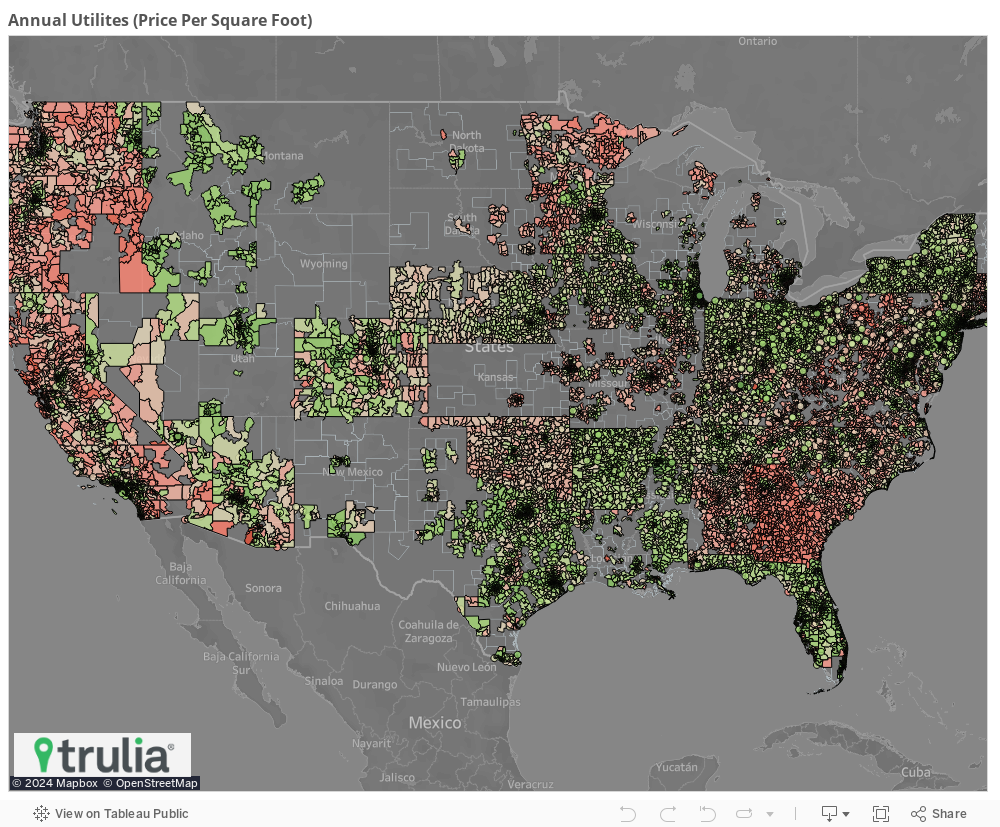
- Nationally, based on data from UtilityScore, people in single family homes spend a median of $2,715 annually ($226 monthly) on utilities, or $1.68 on a square foot basis, or 1.4% of the median single-family home value.
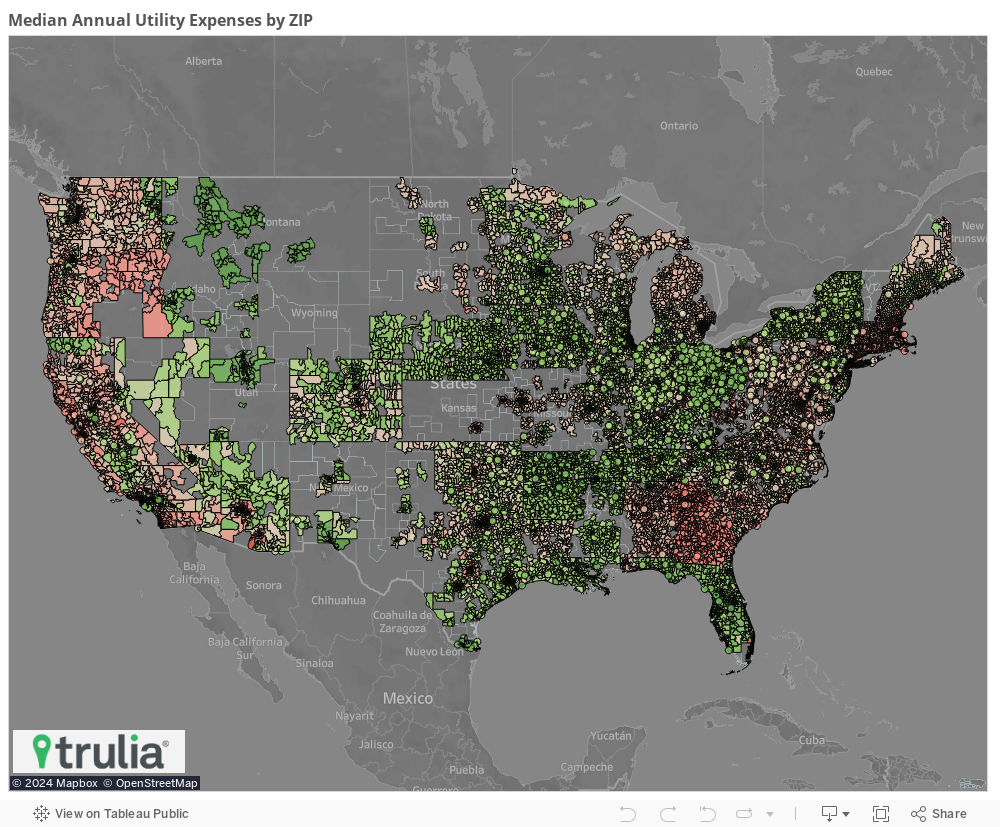
- Utilities are the hidden cost when buying or renting a single-family home in Georgia. The median annual utility cost for the state are the highest in the country in dollars at $4,347, as a proportion of single-family home values at 2.9%, and the second highest on a per square foot basis at $2.48 (after Hawaii at $2.57).
- Of the largest 100 metro areas, Atlanta has the most expensive median annual utilities by dollar amount at $4,353, and is in the top 10 on both a price per square foot basis ($2.31) and as a percent of home values (2.6%).
- El Paso, Texas has the least expensive median annual utility cost at $1,818, and the 6th most inexpensive on a price per square foot basis at $1.28.
- Of the top 20 most expensive zip codes by median annual utilities, all of them are in Arizona and coastal California metro areas with the exception of one in downtown Elizabeth, N.J., in the Newark metro area (07201) and the Sea Island area near Brunswick, Ga. (31561).
- Climate is not a good predictor for how much median utilities are at the zip-code or metro level.
Our analysis suggests is that if you are buying or renting a single family starter home, depending on where you live, utilities could have a big impact on overall affordability; in some cases even between zip codes that border each other.
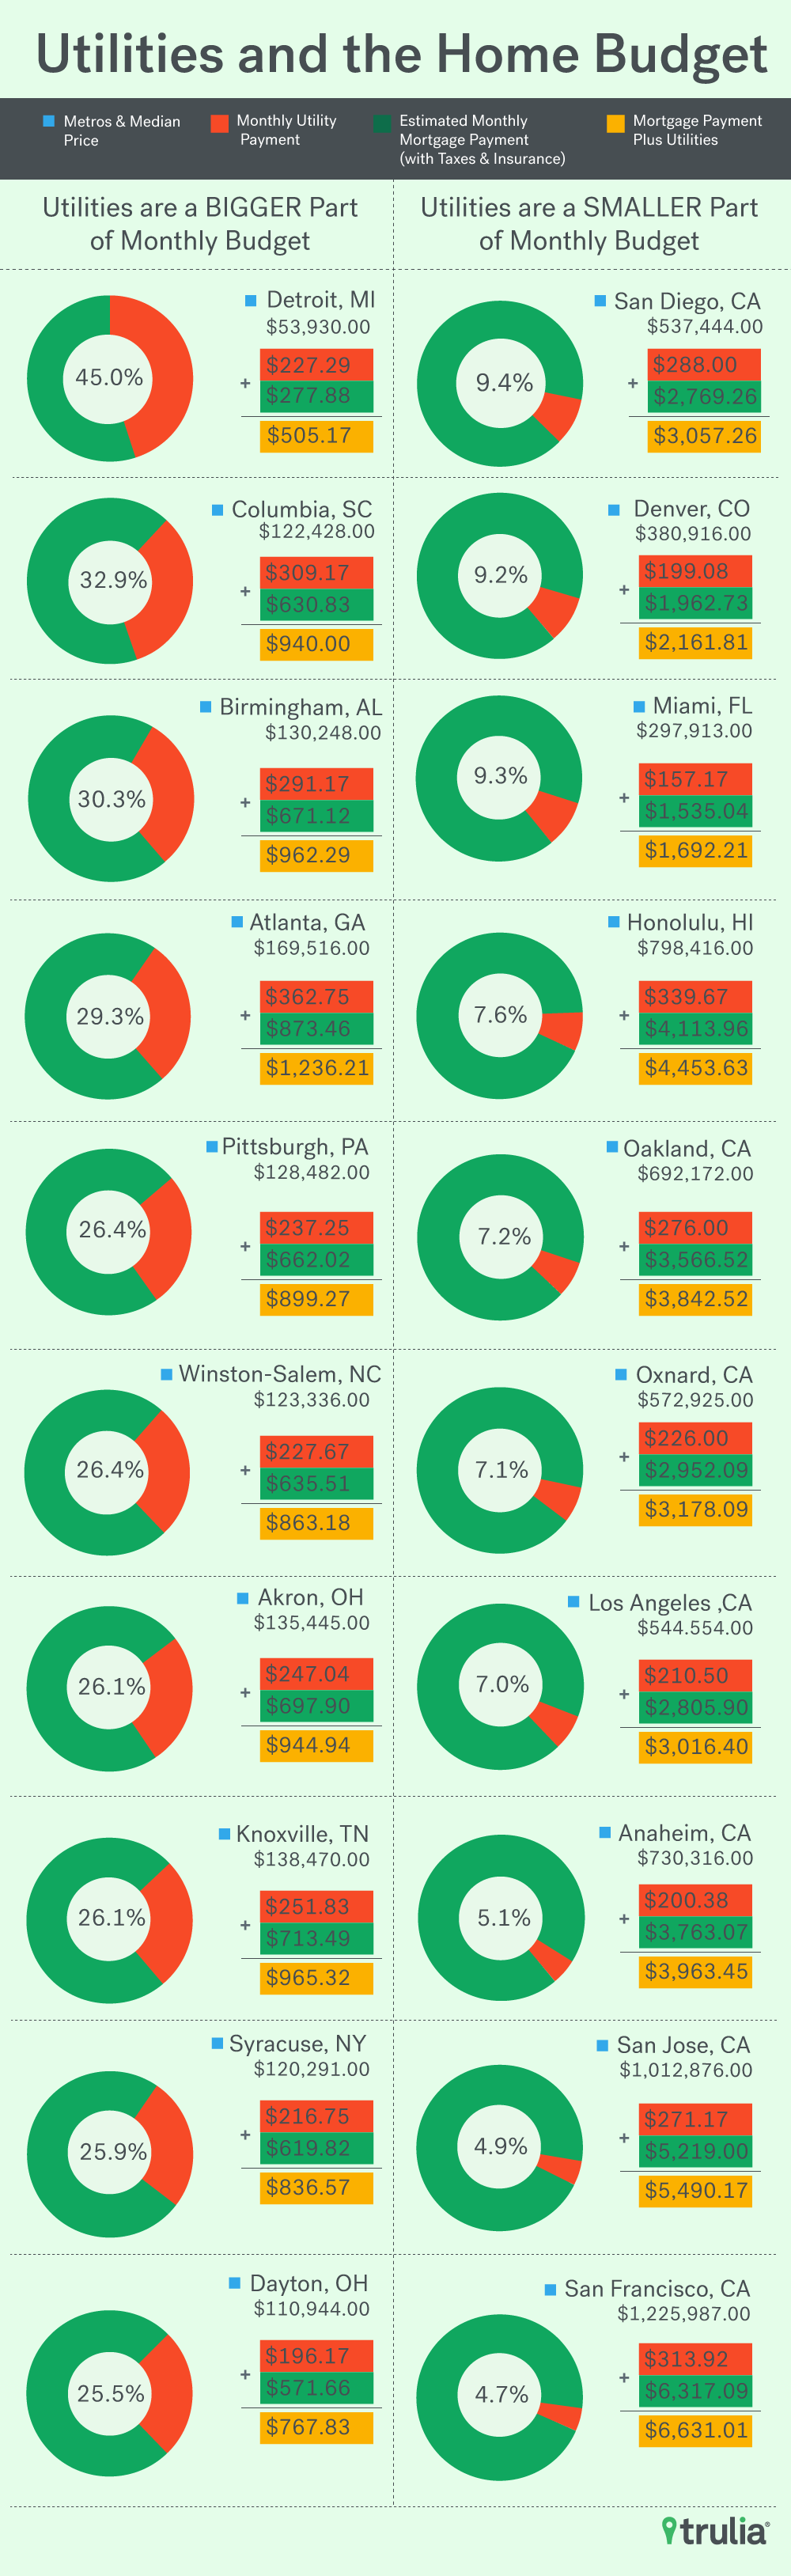
Owners and renters in single family homes who reside in places with lower home values such as Detroit and Pittsburgh can be paying just as much for utilities on average as they do for their mortgage or rent payments. For residents in the most expensive metros like San Francisco or Honolulu on the other hand, utilities are just as high in dollar amounts, but look trivial after getting past monthly housing costs.
On the western outskirts of Tucson, Ariz., in the Avra Valley and Three Points areas (zip codes 85653 and 85735), homes are similarly valued, in the $180,000 range, and are of similar size. Buying home with a 30-year mortgage and 20% down payment would cost roughly $1,000 per month after taxes and insurance in either of these places, and rental prices would be similar. A home in Three Points though will cost more than 2.5 times in utilities compared with a home in Avra Valley, or a monthly average of $620 per month compared with $240 per month. This would have a huge impact on a home’s overall affordability. Similar disparities can be found along the border of Idaho and Oregon near Boise, along the Georgia-Florida border and the Georgia-Tennessee border, and in the more vacationed parts of south-west Orlando around Disney World and Kissimmee.
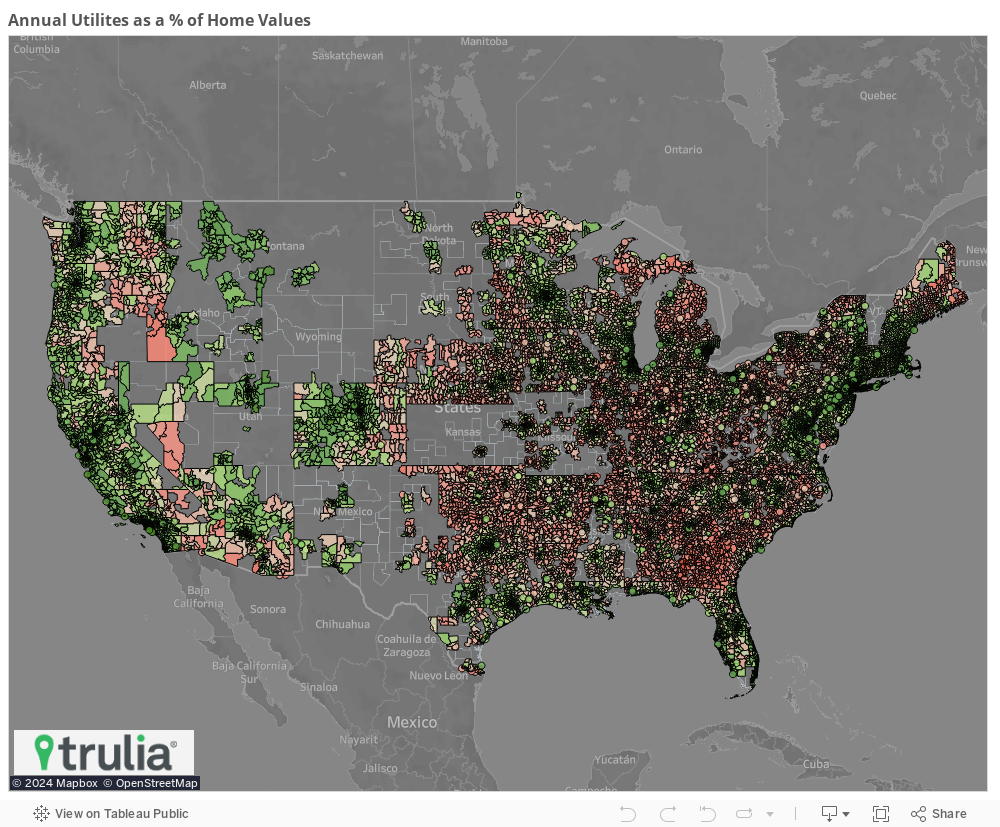
In most places though, looking at utility expenses as a proportion of home values reveals a more predictable pattern. Most metro areas, where home prices tend to be higher than their surrounding rural areas, look much less expensive comparatively. Coastal regions, both metropolitan and otherwise also look much more affordable when considering home values. The entire state of Georgia, save a few of the pricier zip codes in the Atlanta area, still shows up as expensive for utilities.
We were surprised to find that there is no significant correlation between climate and median annual utility amounts. If we assume 72 degrees (Farenheit) is a comfortable temp for most people and take the difference in average temp from 72 at various times of the year in each metro, the places with the largest deviations from comfortable do not have higher annual utility bills than places with very little deviations from comfortable temps.
Taking another look at the top 20 most expensive zip codes by dollar amount, most of these places have unusually large homes in them; eight with a median home size of greater than 3,500 square feet. But Dillon Beach, Calif. (94929) in the San Rafael, Calif., metro and 85736 in the Tucson metro have more modest sized homes (1,565 and 1,644 square feet, respectively) yet run a median of $10,369 and $8,071 for utilities annually. This also puts both of these zips among the most expensive on a price per square foot basis. Why? As UtilityScore points out, Dillon Beach is part of the San Rafael metro area, they are serviced by a small municipal water utility that charges high rates. UtilityScore notes that single family homes in the Three Points area (near Tucson) on the other hand, sit on lots with a median size of over an acre. Doing anything with the landscaping of these homes, other than leaving them the way they are, requires large amounts of water in an area that already has high rates.
We simplified our look by combining water, gas, or electric rates into a single price per square foot measure to determine who is actually paying higher rates across the country. At the state level, Hawaii comes in on the top of this list at a median annual cost of $2.57 per square foot. Looking at utility costs as a function of square footage tends to make places with larger homes look cheaper than places with smaller homes. This is why it is even more surprising that Massachusetts and Georgia, which are both among the top 10 largest states by median home square footage, are also in the top 10 most expensive states for utilities by square foot.
Methodology
UtilityScore data was provided to Trulia at the household level for all single family homes that were available in the UtilityScore database as of July 2016. With this data alone, median annual utility bills as well as the median annual utilities on a price per square foot basis were mapped at the zip code level. Internal home-value estimates were also assigned to each zip code for which we had UtilityScore data to calculate median utility amounts as a proportion of home values at the zip code level. All three of these metrics were also calculated at the metro- and state-level.
Average climate data for January, April, July, and October from NOAA was used to check how weather impacted utility bill amounts at the metro level. Average temperature deviations from 72° for each month were summed across the 4 months used to come up with an aggregate “deviation from comfort” score for each metro area. This deviation from comfort was tested against median utility bills as a possible source of bill variation, but the correlation was underwhelming.

