America still is getting more diverse, but many of the changes to the nation’s population might surprise you.
On Thursday, the U.S. Census Bureau released its 2016 population estimates by race, age, and sex. The data gives us more detail about what constituted the 0.7% population increase between 2015 and 2016. To shed additional light, we reviewed the data and here some key takeaways from the release:
- White Population Growth Continues to Slow: Nationally, the population of non-Hispanic whites (whom we refer to as whites in this report, unless otherwise noted) only made up 0.2% of all population growth between 2015 and 2016, the smallest portion in the Census’ population estimates history. By contrast, Hispanics made up 50.7% of the growth, Asians 23.4%, blacks 15.8% and those identifying as two or more races 8.6%.
- America is Getting Grayer: Not a single metro saw an increase in the proportion of people under the age 20 between 2015 and 2016, only five saw an increase or had an unchanged proportion of 25 to 64 year olds. All saw an increase in the share of their population 65 years of age or more and nationally, that share went from 14.9% to 15.2%.
- Hispanics Make Up Less of the Bay Area: Of the biggest 100 metro areas, only San Francisco, and San Jose, Calif., saw a decline in their populations identifying as Hispanic. Populations fell 0.3% and 0.1%
- Florida Metros Are Changing Fast: Racially and ethnically, Fort Lauderdale, Fla., Las Vegas, and Orlando, Fla., experienced the most rapid change between 2015 and 2016 a trend that began in 2000. St. Louis was the most unchanged metro between 2015 and 2016 and the second slowest changing since 2000, after Pittsburgh.
Slow Growth For Minorities, No Growth For Whites
From 2015 to 2016, the U.S. population increased by 0.7%. This compares with the same annual rate from 2010 through 2015 and 0.9% from 2000 through 2010. Hispanics and non-Hispanic Asians (what we call Asians throughout our report) accounted for 50.7% and 23.4% of this population growth during the most recent year, respectively.
This puts the current national racial population breakdown – in which all of the following categories include Hispanics who identify with them – at 76.9% white, 13.3% black, 1.3% American Indian and Alaska Native, 5.7% Asian, 0.2% Native Hawaiian and Other Pacific Islander, and 2.6% identify as two or more races.
In the latest estimate, 17.8% of the population claim a Hispanic ethnicity, 87.4% of whom identify as white.
Twenty-six of the 100 largest metro areas were majority minority, in which national minorities made up a majority of the local population. That’s unchanged from 2015, but up from 14 majority-minority metros in 2000.
America’s Quickest Changing Cities |
||||
| U.S. Metro Area | 2015 to 2016 Demographic Change Rank | 2015-2016 Fastest Growing Group | 2000 to 2016 Demographic Change Rank | 2000-2016 Fastest Growing Group |
| Fort Lauderdale, FL | 1 | Hispanic | 1 | Hispanic |
| Las Vegas, NV | 2 | Hispanic | 2 | Hispanic |
| Orlando, FL | 3 | Hispanic | 3 | Hispanic |
| Allentown, PA | 4 | Hispanic | 10 | Hispanic |
| San Jose, CA | 5 | Asian | 13 | Asian |
| Silver Spring-Frederick-Rockville, MD | 6 | Hispanic & Asian (tie) | 7 | Hispanic |
| Fort Worth, TX | 7 | Hispanic | 11 | Hispanic |
| Cambridge-Newton-Framingham, MA | 8 | Hispanic | 19 | Hispanic |
| Bakersfield, CA | 9 | Hispanic | 4 | Hispanic |
| Bridgeport-Stamford-Norwalk, CT | 10 | Hispanic | 23 | Hispanic |
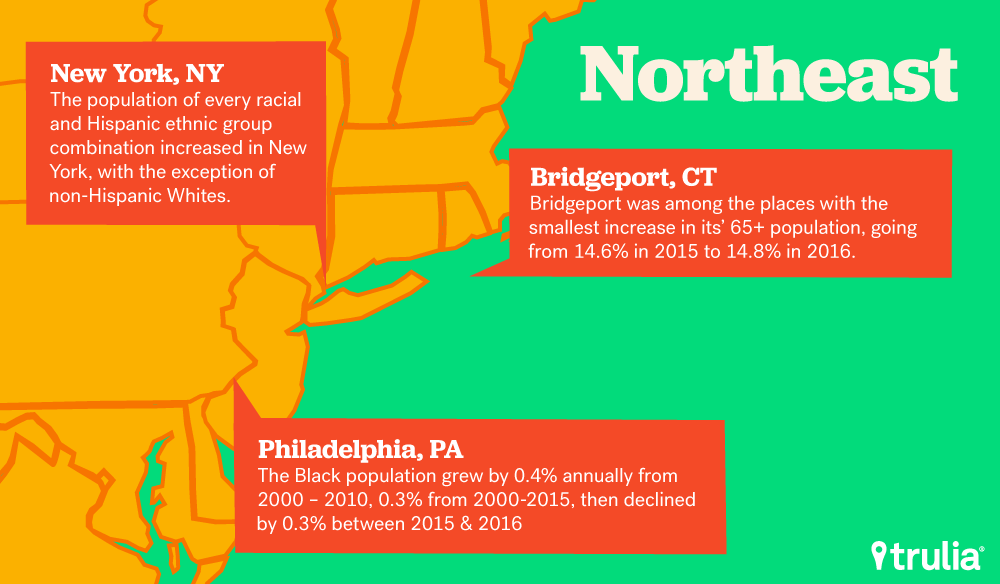
In New York, the population of every possible racial and Hispanic ethnic group combination increased, with the exception of whites, which actually decreased by 0.6% from 2015 to 2016, a slightly faster rate than the 0.3% average annual decrease from 2010 to 2015.
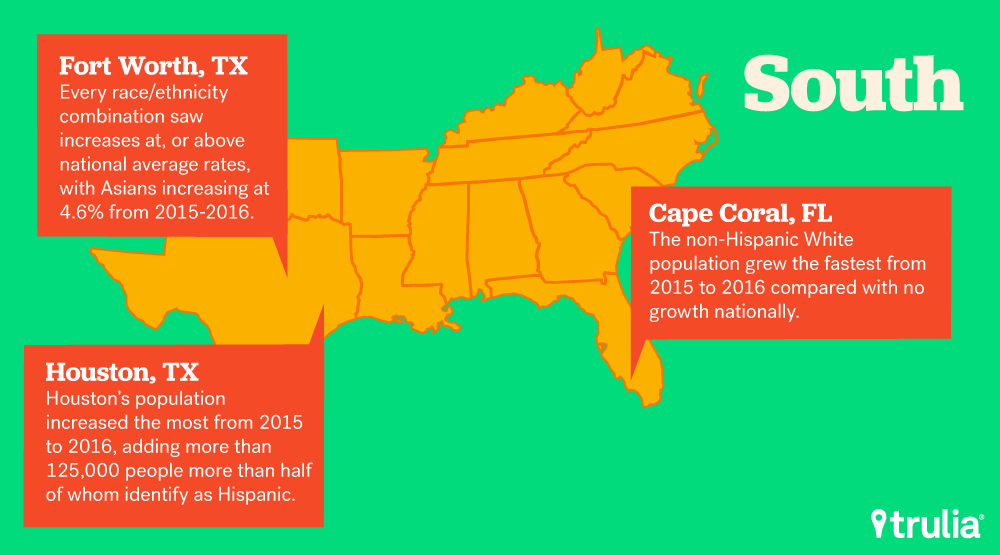
As was noted in our recent post covering the Census’ release of 2016 population estimates, Cape Coral, Fla., has been the fastest growing metro for the second year in row, followed by Austin, Texas, both of which continue to see robust job growth at well above the national rate. In particular, Cape Coral has also had rapid growth in its population 65 years of age or older, shifting from 23.6% of the population in 2010 to 27.4% in 2016. This compares with a national rate of 13.1% in 2010 and 15.2% of the population in 2016.
Asians Are the Fastest-Growing Minority in the U.S. Last Year
Between 2015 and 2016 Asians were the fastest growing racial group in the U.S., increasing by 3%. Among the largest 100 metros, not a single one saw a decline in their Asian populations.
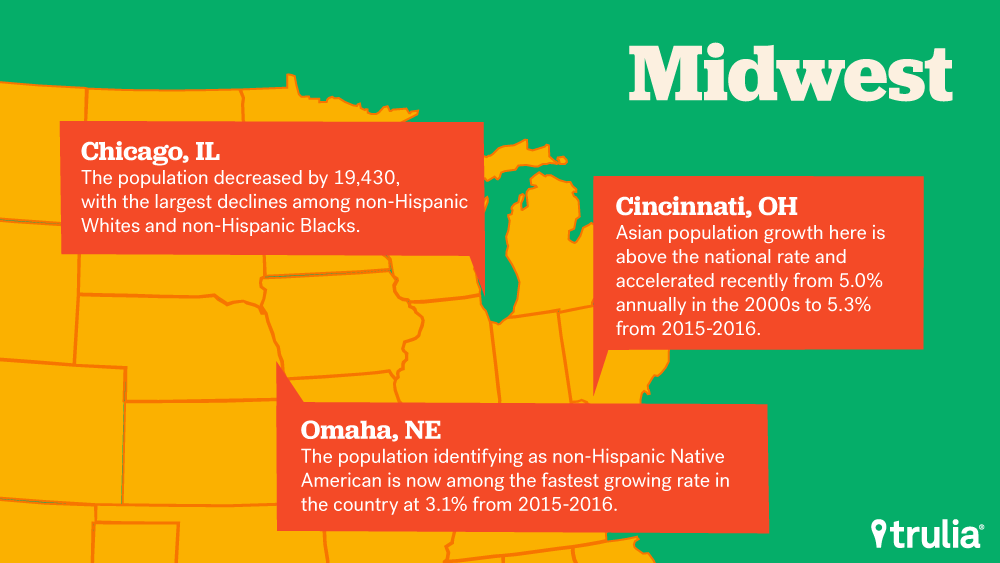
The Asian population in Las Vegas made up 5.3% of the population in 2000, higher than the national average of 3.7%. Since then, the Asian population has climbed at 6.8% annually, compared with 3.4% nationally, shifting the overall proportion up to 9.8% in 2016, compared with 5.5% nationally. Despite Asian population growth slowing nationally (from 3.5% annually from 2000-2010 to 3.1% from 2015-2016), it has grown at above the national rate in Cincinnati, Ohio, and even accelerated recently from 5.0% annually in the 2000s to 5.3% from 2015 to 2016.
White Population Growth Is Flat
The white population grew the slowest at less than 0.1% and actually declined in 53 of the 100 largest metro areas. Nationally, they accounted for only 0.2% of all population growth compared with 6.2% of growth between 2000 and 2010 and 4.9% of growth between 2010 and 2015. Cape Coral, Fla., saw the fastest growth of its white population at 2.4% between 2015 and 2016, while the largest decline was in El Paso, Texas, which lost 2.3% and already had the smallest proportion of its population identifying only as white of any of the largest 100 metro areas at 12.4%. Since 2000, the population identifying as white has declined the most, by 1.7% annually, in Fort Lauderdale, Fla., and increased the most in Raleigh, by 2.5% annually. Since 2000, there is only one metro in the largest 100 that has had its proportion of population identifying as non-Hispanic white increase, and that was in Charleston-North Charleston, S.C., which went from 64.1% to 64.4% sixteen-years later.
The population identifying as Hispanic of any race increased by 2% nationally. Tacoma, Wash., where the Hispanic population grew by 4.9%, is the only metro outside of Florida among the top seven places where the Hispanic population is growing the fastest. Jacksonville. Fla., ranked first with a 5.9% Hispanic population increase for the year.
Gender and Age Across America
Bakersfield, Calif., remains the most male-skewed at 51.3%, which is partially because Bakersfield is also the metro with the largest share of its population under 20 at 31.9%. The gender imbalance in Bakersfield has been becoming less pronounced since 2010 though, and San Jose, and Colorado Springs, Colo., are not far behind and seem to be moving more toward a male skew since 2010. Both metros are 50.5% male.
Philadelphia held its spot as the most female skewed at 52.5%, though that imbalance has also been edging more toward a 50-50 split, down from 53.2% in 2000. North Port, Fla., has smallest share of population under 20 (18.4%) and the largest population over 65 (31.0%) as it remains a popular destination for retirees.
San Francisco has the highest proportion of working-age population between 20 and 65 (66.1%). While every metro saw an increase in the proportion of its population 65 or older, Bridgeport, Conn., was among the places with the smallest change, going from 14.6% in 2015 to 14.8% in 2016
Nominally, Houston’s population increased the most from 2015 to 2016 while Chicago’s fell the most. Houston grew by more than 125,000 people, or 1.9%, more than half (52.1%) of which came from growth in the Hispanic population. Chicago’s population decreased by 19,430 people (or 0.3%). The largest declines were among whites (down 33,000) and blacks (down 10,880). Increases in the Asian and Hispanic populations partially offset some of these drops.
Philadelphia has the third-largest share of its population who identify as black, and has recently reversed a trend of a growing black population. The black population grew by 0.4% annually from 2000 and 2010, 0.3% from 2000 and 2015, then declined by 0.3% between 2015 and 2016.
In Omaha, Neb., the population identifying as non-Hispanic Native American is growing at an increasing rate and is now among the fastest in the country at 3.1% from 2015 to 2016, up from 2.0% from 2000 to 2015, and 0.7% from 2000 to 2010.


