SAN FRANCISCO, November 5, 2013 – Trulia, Inc. (NYSE: TRLA), a leading online marketplace for home buyers, sellers, renters, and real estate professionals, today released the latest findings from the Trulia Price Monitor and the Trulia Rent Monitor. These indices are the earliest leading indicators available of trends in home prices and rents. Based on for-sale homes and rentals listed on Trulia, the monitors take into account changes in the mix of listed homes and reflect trends in prices and rents for similar homes in similar neighborhoods through October 31, 2013. For the full report and methodology, see here.
Though Slowing, Asking Prices Still Climbing Fast in Most Housing Markets
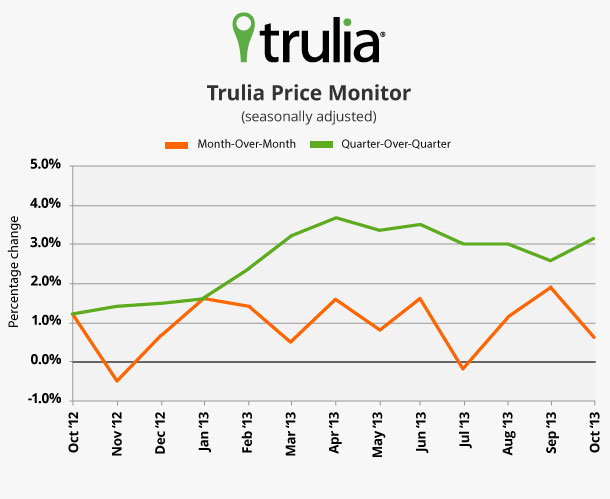
In October, asking home prices increased 0.6 percent month-over-month (M-o-M), the second-slowest monthly gain in seven months. This continued slowdown in asking prices is largely due to expanding inventory, rising mortgage rates, and declining investor activity. Asking prices could potentially slow further if consumer confidence suffers from the ongoing budget uncertainty and future shutdown and debt-default worries. Nevertheless, the monthly, quarterly, and yearly gains are all still high compared with historical norms. In fact, asking prices rose 11.7 percent year-over-year (Y-o-Y) – the highest increase since the housing bubble burst.
|
October 2013 Trulia Price Monitor Summary |
|||
|
|
% change in asking prices |
# of 100 largest metros with asking-price increases |
% change in asking prices, excluding foreclosures |
|
Month-over-month, |
0.6% |
Not reported |
0.1% |
|
Quarter-over-quarter, |
3.1% |
91 |
2.6% |
|
Year-over-year |
11.7% |
99 |
11.8% |
|
*Month-over-month change is October versus September. Quarter-over-quarter and year-over-year changes are three-month averages. Data from previous months are revised each month, so data being reported now for previous months might differ from previously reported data. |
|||
Election Day Special: Contrasting Housing Recoveries in Red vs. Blue America
The government shutdown, debt ceiling, and budget negotiations have raised the stakes in Washington. The uneven housing and economic recoveries in America across red and blue metros could aggravate political partisanship. Among the 100 largest metros – of which 68 are blue metros and 32 are red metros based on votes from the 2012 Presidential Election[1] – asking home prices rose faster Y-o-Y in blue metros (12.5 percent) than in red metros (11.1 percent). However, the stronger price recovery in blue metros is actually a bigger rebound after a steeper decline. That’s because blue metros were harder hit during the housing crash and now also face higher unemployment and lower housing affordability than red metros. As budget battles in Washington continue, politicians representing blue metros will be under more pressure from their voters to fight for policies that could reduce unemployment and make homeownership more within reach of the middle class.
|
Price Changes in the Reddest Metros |
|||
|
# |
Metro |
President Obama’s margin in 2012 election |
Y-o-Y % change in asking prices, Oct 2013 |
|
1 |
-34% |
2.2% |
|
|
2 |
-32% |
4.3% |
|
|
3 |
-30% |
9.5% |
|
|
4 |
-27% |
4.1% |
|
|
5 |
-23% |
12.0% |
|
|
Note: A negative margin for Obama means Romney got more votes than Obama. Among 100 largest metros. |
|||
|
Price Changes in the Bluest Metros |
|||
|
# |
Metro |
President Obama’s margin in 2012 election |
Y-o-Y % change in asking prices, Oct 2013 |
|
1 |
58% |
15.6% |
|
|
2 |
50% |
29.6% |
|
|
3 |
New York, NY-NJ |
49% |
7.3% |
|
4 |
47% |
24.5% |
|
|
5 |
42% |
19.1% |
|
|
Note: A positive margin for Obama means Obama got more votes than Romney. Among 100 largest metros. |
|||
San Francisco Rents Skyrocket, Up 10.1 Percent From Last Year
Nationally, rents rose 2.7 percent Y-o-Y. Among the 25 largest rental markets, rents rose most in San Francisco, Portland, and Seattle, while falling slightly in Washington D.C. and Philadelphia. Unfortunately for Bay Area renters, San Francisco now has the steepest Y-o-Y increase in rents and the highest median rent: $3,250 for a two-bedroom unit, edging out the New York metro area where the current median rent for a similarly-sized unit is $3,150 per month. At the other extreme, median rent for a two-bedroom unit is less than $1,000 in Phoenix, St. Louis, and Las Vegas.
|
Rent Trends In the Most Expensive Rental Markets |
|||
|
# |
U.S. Metro |
Y-o-Y % change, October 2013 |
Median rent on 2-bedroom units |
|
1 |
10.1% |
$3,250 |
|
|
2 |
New York, NY-NJ |
2.8% |
$3,150 |
|
3 |
2.2% |
$2,300 |
|
|
4 |
2.7% |
$2,250 |
|
|
5 |
2.0% |
$2,250 |
|
|
NOTE: Among 25 largest rental markets. |
|||
PRE-APPROVED QUOTES:
- “Although October’s asking home prices rose at the second-slowest pace in seven months, prices are still rising unsustainably fast,” said Jed Kolko, Trulia’s Chief Economist. “Even though the market is far from bubble territory, we still see the effects of fast-rising prices, including investors flipping homes and would-be sellers waiting longer to put their homes on the market.”
- “Home prices are skyrocketing in many of America’s bluest metros, like Oakland and Detroit. The home-price rebound has bypassed most of America’s reddest metros,” said Jed Kolko, Trulia’s Chief Economist. “But Red America shouldn’t turn green with envy at Blue America’s recovery: housing remains much more affordable in red metros than blue metros, and unemployment is lower, too.”
MULTIMEDIA
- Graph of price changes from October 2012 to October 2013
- List of price and rent changes for the largest metros: Excel or PDF
METHODOLOGY
To view the full methodology and 2013 release schedule, see here. The next release of the Trulia Price Monitor and the Trulia Rent Monitor will be Wednesday, December 4, at 10 AM ET.
ABOUT TRULIA, INC.
Trulia (NYSE: TRLA) gives home buyers, sellers, owners, and renters the inside scoop on properties, places, and real estate professionals. Trulia has unique info on the areas people want to live that can’t be found anywhere else: users can learn about agents, neighborhoods, schools, crime, commute times, and even ask the local community questions. Real estate professionals use Trulia to connect with millions of transaction-ready buyers and sellers each month via our hyperlocal advertising services, social recommendations, and top-rated mobile real estate apps. Trulia’s Market Leader subsidiary delivers the leading end-to-end technology and marketing solutions that enable real estate professionals to grow and manage their businesses. Trulia is headquartered in downtown San Francisco. Trulia is a registered trademark of Trulia, Inc.
[1] Red metros are where Governor Romney, the Republican presidential candidate, got more votes in 2012 than President Obama, and the blue metros are where Obama got more votes than Romney, according to Election Atlas.

