SAN FRANCISCO, November 5, 2012 – Trulia today released the latest findings from the Trulia Price Monitor and the Trulia Rent Monitor, the earliest leading indicators available of trends in home prices and rents. Based on the for-sale homes and rentals listed on Trulia, these monitors take into account changes in the mix of listed homes and reflect trends in prices and rents for similar homes in similar neighborhoods through October 31, 2012.
Asking Prices Rise 0.7% Month-over-Month for Largest Year-over-Year Gain to Date
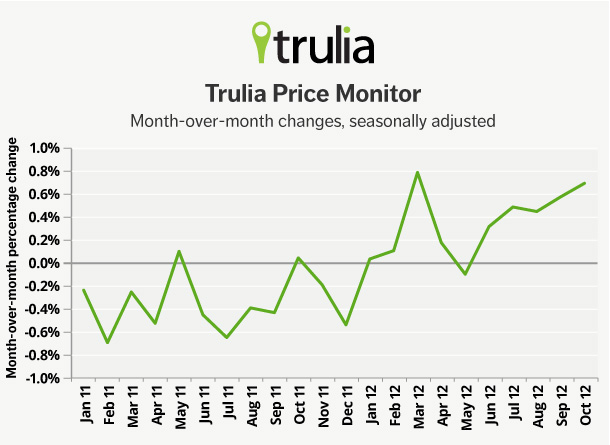
In September, asking prices on for-sale homes–which lead sales prices by approximately two or more months–increased 2.9 percent year over year (Y-o-Y). Excluding foreclosures, Y-o-Y asking prices rose 3.6 percent. Meanwhile, asking prices rose nationally 1.8 percent quarter over quarter (Q-o-Q), seasonally adjusted, and 0.7 percent month over month (M-o-M), seasonally adjusted.
|
October 2012 Trulia Price Monitor Summary |
|||
|
|
% change in asking prices |
# of 100 largest metros with asking-price increases |
% change in asking prices, excluding foreclosures |
|
Month-over-month, seasonally adjusted |
0.7% |
(not reported) |
0.5% |
|
Quarter-over-quarter, seasonally adjusted |
1.8% |
76 |
1.4% |
|
Year-over-year |
2.9% |
69 |
3.6% |
Prices Rise Almost 25% in Phoenix and 10% or More in San Jose, Las Vegas, and Denver
Asking prices rose most Y-o-Y in Phoenix. Seven metros, including Phoenix, saw prices rise 10% or more Y-o-Y. At the other extreme, prices in Chicago fell 5.3% Y-o-Y–the sharpest decline among the 100 largest metros. New Haven, CT and Philadelphia also saw prices fall more than 2% Y-o-Y. The metros with the largest price increases today have strong job growth, fewer foreclosures yet to come, and declining vacancies; they also had bigger price declines during the bust.
|
Metros with Largest Year-over-Year Asking Price Increases |
||
|
# |
U.S. Metro |
Y-o-Y % change in asking prices, October 2012 |
|
1 |
24.9% |
|
|
2 |
15.7% |
|
|
3 |
12.7% |
|
|
4 |
11.8% |
|
|
5 |
11.3% |
|
|
6 |
10.9% |
|
|
7 |
10.1% |
|
|
8 |
9.8% |
|
|
9 |
8.8% |
|
|
10 |
8.7% |
|
Rents Rose 5.1 Percent Nationally, Increasing Even in Markets Where Prices are Falling
Nationally, rent gains continued to outpace home price increases in October, rising by 5.1 percent Y-o-Y. Among the largest 25 rental markets, Y-o-Y rents rose the most in Houston, Miami, and Oakland, where they climbed 10 percent or more. Rent growth in Oakland, Denver, and San Francisco accompanied strong for-sale price growth, while in Chicago and Philadelphia rents rose despite falling prices.
|
Metros with Largest Year-over-year Asking Rent Increases |
||
|
# |
U.S. Metro |
% change in rents, Y-o-Y , October 2012 |
|
1 |
16.5% |
|
|
2 |
10.0% |
|
|
3 |
10.0% |
|
|
4 |
9.4% |
|
|
5 |
8.8% |
|
|
6 |
8.6% |
|
|
7 |
Minneapolis–St. Paul, MN-WI |
8.5% |
|
8 |
7.7% |
|
|
9 |
New York, NY-NJ |
6.1% |
|
10 |
6.0% |
|
PRE-APPROVED QUOTES
· “Continued widespread price increases are good for homeowners but not for home-seekers,” said Jed Kolko, Trulia’s Chief Economist. “For homeowners, rising prices add to their wealth and help bring underwater borrowers closer to positive equity. For home-seekers, however, rising prices could put homeownership out of reach. In markets like Denver, San Francisco, and Oakland, where prices and rents are both rising, higher prices mean higher down payments, but rising rents make it harder to save enough.”
· ”With asking prices rising again in October, sales prices by the end of this year should be just 1.1 percent lower than in January 2009,” said Jed Kolko, Trulia’s Chief Economist. “Home prices are climbing in most local markets and in eight of the eleven swing states. Rising prices have taken pressure off the presidential candidates from having to come up with detailed plans to help the housing market, and that’s a big reason why they haven’t focused on housing in the 2012 campaign.”
MULTIMEDIA
- To read the full report, see here.
- To download the full list of price and rent changes for the largest metro areas, see here.
- To download a graph of price changes from January 2011 to October 2012, see here.
METHODOLOGY
To view the full methodology and 2012 release schedule, see here. The next release of the Trulia Price Monitor and the Trulia Rent Monitor will be Tuesday, December 4, at 10AM ET.
About Trulia, Inc.
Trulia (NYSE: TRLA) gives home buyers, sellers, owners and renters the inside scoop on properties, places and real estate professionals. Trulia has unique info on the areas people want to live that can’t be found anywhere else: users can learn about agents, neighborhoods, schools, crime, commute times and even ask the local community questions. Real estate professionals use Trulia to connect with millions of transaction-ready buyers and sellers each month via our hyper local advertising services, social recommendations, and top-rated mobile real estate apps. Trulia is headquartered in downtown San Francisco. Trulia is a registered trademark of Trulia, Inc.

