SAN FRANCISCO, September 5, 2012 – Trulia today released the latest findings from the Trulia Price Monitor and the Trulia Rent Monitor, the earliest leading indicators available of trends in home prices and rents. Based on the for-sale homes and rentals listed on Trulia, these monitors take into account changes in the mix of listed homes and reflect trends in prices and rents for similar homes in similar neighborhoods through August 31, 2012.Asking Prices Post Seventh Straight Monthly Increase, For a 2.3 Percent Year-Over-Year Gain
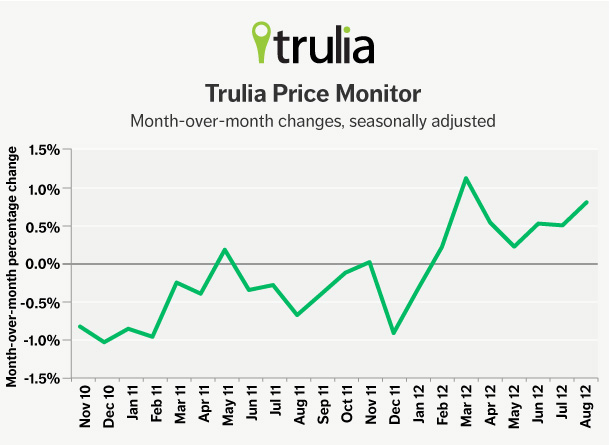
Asking prices on for-sale homes–which lead sales prices by approximately two or more months – increased 2.3 percent in August year over year (Y-o-Y) and rose in 68 of the 100 largest metros. Excluding foreclosures, prices rose 3.8 percent Y-o-Y. These are the largest Y-o-Y gains since the recession. Meanwhile, asking prices rose nationally 1.8 percent quarter over quarter (Q-o-Q), seasonally adjusted. Month-over-month (M-o-M) asking prices rose by 0.8 percent, the seventh consecutive month of increases.
|
August 2012 Trulia Price Monitor Summary |
|||
|
|
% change in asking prices |
# of 100 largest metros with asking-price increases |
% change in asking prices, excluding foreclosures |
|
Month-over-month, seasonally adjusted |
0.8% |
(not reported) |
0.7% |
|
Quarter-over-quarter, seasonally adjusted |
1.8% |
87 |
2.2% |
|
Year-over-year |
2.3% |
68 |
3.8% |
Phoenix Prices Up 24 Percent, Followed By Cape Coral-Fort Myers
Asking prices in Phoenix rose 24.2 percent Y-o-Y, by far the largest increase among the largest metros. Tucson and Las Vegas saw big price increases Y-o-Y in August despite having falling prices Y-o-Y three months ago. Meanwhile, home price gains in Miami are slowing down, from 14.5 percent Y-o-Y in May to 9.6 percent Y-o-Y in August.
|
# |
U.S. Metro |
% change in asking prices, year-over-year, August 2012 |
% change in asking prices, year-over-year, May 2012 |
|
1 |
24.2% |
17.6% |
|
|
2 |
Cape Coral–Fort Myers, FL |
16.5% |
11.1% |
|
3 |
10.4% |
6.4% |
|
|
4 |
10.4% |
6.6% |
|
|
5 |
9.9% |
-4.4% |
|
|
6 |
9.6% |
14.5% |
|
|
7 |
8.9% |
5.3% |
|
|
8 |
8.6% |
4.0% |
|
|
9 |
8.6% |
5.3% |
|
|
10 |
6.9% |
-1.3% |
Note: Among 100 largest metros.
Rents Increases Slow Down, Rising 4.7 Percent Nationally
Nationally, rents rose 4.7 percent Y-o-Y in August, compared to 5.8 percent Y-o-Y in May – making it the slowest rise since March. At the regional level, rents jumped more than 10 percent Y-o-Y in Houston and Seattle, but slowed in Denver, San Francisco, Miami, Oakland and Boston.
|
Metros with Largest Rent Increases |
|||
|
# |
U.S. Metro |
% change in rents, year-over-year, August 2012 |
% change in rents, year-over-year, May 2012 |
|
1 |
11.2% |
9.1% |
|
|
2 |
10.4% |
9.5% |
|
|
3 |
9.9% |
10.2% |
|
|
4 |
9.7% |
13.7% |
|
|
5 |
9.7% |
10.7% |
|
|
6 |
9.7% |
11.0% |
|
|
7 |
8.7% |
9.2% |
|
|
8 |
8.6% |
4.0% |
|
|
9 |
Portland, OR-WA |
7.5% |
6.8% |
|
10 |
New York, NY-NJ |
6.6% |
5.6% |
Among the 25 largest rental markets.
PRE-APPROVED QUOTES
- “Asking prices rose 2.3 percent year over year in August, hitting two housing recovery milestones,” said Jed Kolko, Trulia’s Chief Economist. “First, asking prices rose faster than at any time since the recession. Second, asking prices excluding foreclosures are now rising faster than wages, putting an end to many years of affordability gains. In addition, price gains are catching up with slowing rent increases, which will tip some renters in favor of staying put in their rentals rather than buying a home.
- “Rents had been on fire earlier this year, but some of the hottest rental markets are starting to cool,” said Jed Kolko, Trulia’s Chief Economist. “New construction that started last year is finally coming onto the market, giving renters more choices and some relief from rising rents. Still, rents are climbing in nearly all of the major rental markets.”
MULTIMEDIA
- To read the full report, see here.
- To download the full list of price and rent changes for the largest metro areas, see here.
- To download a graph of price changes from November 2010 to August 2012, see here.
METHODOLOGY
To view the full methodology and 2012 release schedule, see here. The next release of the Trulia Price Monitor and the Trulia Rent Monitor will be Thursday, October 4, at 10AM ET.
ABOUT TRULIA, INC.
Trulia gives home buyers, sellers, owners and renters the inside scoop on properties, places and real estate professionals. Trulia has unique info on the areas people want to live that can’t be found anywhere else: users can learn about agents, neighborhoods, schools, crime and even ask the local community questions. Real estate professionals use Trulia to connect with millions of transaction-ready buyers and sellers each month via our hyper local advertising services, social recommendations and top-rated mobile apps. Trulia is headquartered in downtown San Francisco and is backed by Accel Partners and Sequoia Capital. Trulia is a registered trademark of Trulia, Inc.SAN FRANCISCO, September 5, 2012 – Trulia today released the latest findings from the Trulia Price Monitor and the Trulia Rent Monitor, the earliest leading indicators available of trends in home prices and rents. Based on the for-sale homes and rentals listed on Trulia, these monitors take into account changes in the mix of listed homes and reflect trends in prices and rents for similar homes in similar neighborhoods through August 31, 2012.

