Fruitport, MI Apartments For Rent
110 rentals
 Use arrow keys to navigatePET FRIENDLY$1,080 - $1,284/mo
 1-2 Beds
 1 BathWaters Landing Apartments | 42201 Harbour Towne Dr #1-206,
Saginaw, MI 48603 Use arrow keys to navigatePET FRIENDLY$1,570 - $1,775/mo2-3 Beds2 BathsWoodland Creek Townhomes - Saginaw, MI | 2770 W Freeland Rd #4058139,
Saginaw, MI 48604 Use arrow keys to navigateNEW - 11 HRS AGOPET FRIENDLY$935 - $1,125/mo1-2 Beds1 BathGreen Acres - Saginaw, MI | 4645 Colonial Dr #1959741,
Saginaw, MI 48603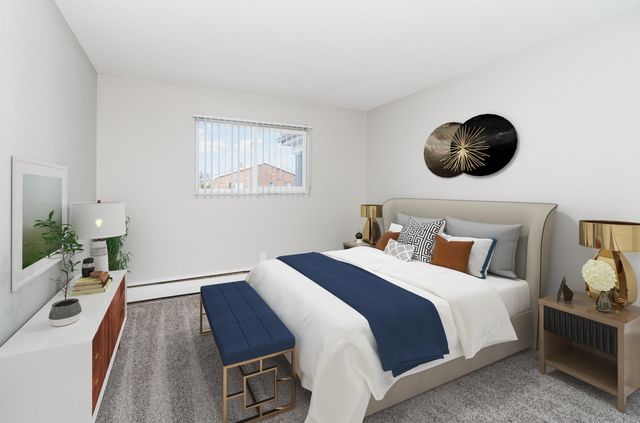 Use arrow keys to navigatePET FRIENDLY$900 - $1,000/mo1-2 Beds1 BathThe Heights Apartments | 4889 Fontaine Blvd #2B-1Ba-800Sqft,
Saginaw, MI 48603 Use arrow keys to navigateNEW - 1 DAY AGOPET FRIENDLY$1,000 - $1,320/mo1-2 Beds1 BathBancroft Luxury Apartments | 107 S Washington Ave #B402,
Saginaw, MI 48607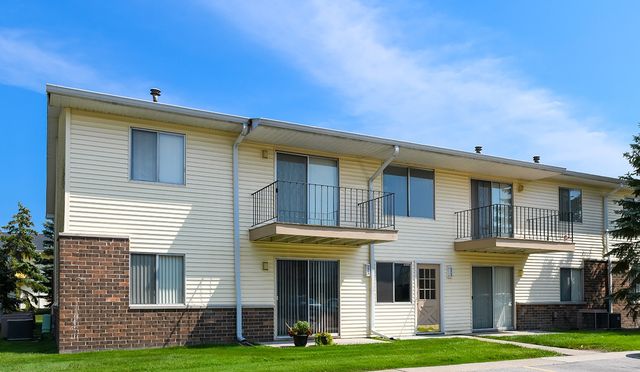 Use arrow keys to navigateNEW - 1 DAY AGOPET FRIENDLY$914 - $1,019/mo1-2 Beds1 BathAmbassador Arms Apartments | 5841 Ambassador Dr #5811-8,
Saginaw, MI 48603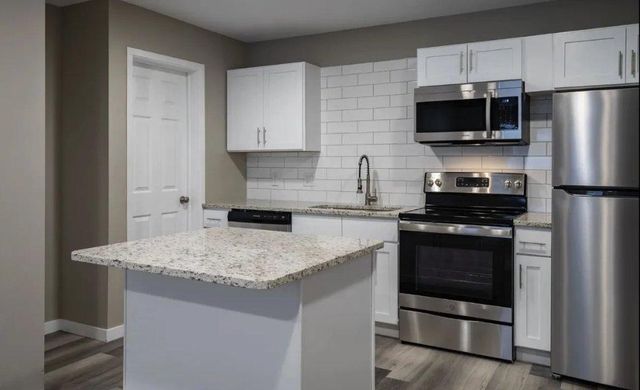 Use arrow keys to navigateSPECIAL OFFERPET FRIENDLY
 PET FRIENDLY
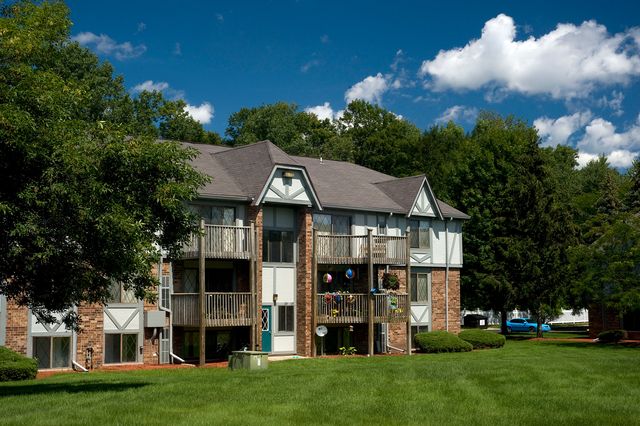 PET FRIENDLY$740 - $940/moStudio-2 Beds1 BathFox Glen Apartments & Fitness Club | 6301 Fox Glen Dr #e49c7b1ac,
Saginaw, MI 48638 PET FRIENDLY$950 - $1,350/mo1-3 Beds1-2 BathsWaterside Apartments | 4070 Green Isle Way #4061-8,
Saginaw, MI 48603 PET FRIENDLY
 APPLY INSTANTLYSPECIAL OFFERPET FRIENDLY
 PET FRIENDLY$700 - $900/mo1-3 Beds1-2 BathsCountry Way Townhomes | 113 Parkside Ct #28bacb8bd,
Saginaw, MI 48601 PET FRIENDLY
 PET FRIENDLY
 PET FRIENDLY
 NEW - 2 DAYS AGOAPPLY INSTANTLY
 APPLY INSTANTLY
 APPLY INSTANTLYPET FRIENDLY
 APPLY INSTANTLY
 NEW - 3 HRS AGOPET FRIENDLY

 NEW - 1 DAY AGO
 PET FRIENDLY
 PET FRIENDLY
 PET FRIENDLY
 PET FRIENDLY
 PET FRIENDLY
 PET FRIENDLY
 PET FRIENDLY
 PET FRIENDLY
 PET FRIENDLY

 PET FRIENDLY
 NEW - 14 HRS AGOAPPLY INSTANTLY
 NEW - 21 HRS AGOAPPLY INSTANTLY
Explore by rental type - Single Family
 NEW - 1 DAY AGO
- NEW - 1 DAY AGOPET FRIENDLY
 NEW - 1 DAY AGOAPPLY INSTANTLYPET FRIENDLY
 NEW - 2 DAYS AGOAPPLY INSTANTLYPET FRIENDLY
 PET FRIENDLY
 APPLY INSTANTLY

- APPLY INSTANTLYPET FRIENDLY
Explore by rental type - Townhome

 APPLY INSTANTLY
 APPLY INSTANTLYFURNISHED
 PET FRIENDLY
Explore by feature - Garage
- APPLY INSTANTLY
 APPLY INSTANTLYPET FRIENDLY
 APPLY INSTANTLYPET FRIENDLY
 APPLY INSTANTLYPET FRIENDLY
 APPLY INSTANTLY
 APPLY INSTANTLY
 APPLY INSTANTLYPET FRIENDLY
- APPLY INSTANTLYPET FRIENDLY
- NEW - 2 DAYS AGOAPPLY INSTANTLYPET FRIENDLY
 APPLY INSTANTLYPET FRIENDLY
Explore by feature - Air Conditioning
- APPLY INSTANTLYPET FRIENDLY
- APPLY INSTANTLYPET FRIENDLY
- APPLY INSTANTLYPET FRIENDLY
 APPLY INSTANTLYPET FRIENDLYROOM FOR RENT
- APPLY INSTANTLYFURNISHED
- APPLY INSTANTLYPET FRIENDLY
- NEW - 2 DAYS AGOAPPLY INSTANTLYPET FRIENDLY
 APPLY INSTANTLY
 APPLY INSTANTLYPET FRIENDLYFURNISHEDROOM FOR RENT
Explore by feature - Pet Friendly
- NEW - 1 DAY AGOAPPLY INSTANTLYPET FRIENDLY
- APPLY INSTANTLYPET FRIENDLY
- APPLY INSTANTLYPET FRIENDLY
- APPLY INSTANTLYPET FRIENDLY
- APPLY INSTANTLYPET FRIENDLY
- NEW - 2 DAYS AGOAPPLY INSTANTLYPET FRIENDLY
- APPLY INSTANTLYPET FRIENDLY
- APPLY INSTANTLYPET FRIENDLYFURNISHEDROOM FOR RENT
 APPLY INSTANTLYPET FRIENDLY
- NEW - 1 DAY AGOPET FRIENDLY
Explore by rental type - Single Family
- NEW - 1 DAY AGO
- NEW - 1 DAY AGOPET FRIENDLY
- NEW - 1 DAY AGOAPPLY INSTANTLYPET FRIENDLY
- NEW - 2 DAYS AGOAPPLY INSTANTLYPET FRIENDLY
- PET FRIENDLY
- APPLY INSTANTLY
- APPLY INSTANTLYPET FRIENDLY
Explore by rental type - Townhome
- APPLY INSTANTLY
- APPLY INSTANTLYFURNISHED
- PET FRIENDLY
Explore by feature - Garage
- APPLY INSTANTLY
- APPLY INSTANTLYPET FRIENDLY
- APPLY INSTANTLYPET FRIENDLY
- APPLY INSTANTLYPET FRIENDLY
- APPLY INSTANTLY
- APPLY INSTANTLY
- APPLY INSTANTLYPET FRIENDLY
- APPLY INSTANTLYPET FRIENDLY
- NEW - 2 DAYS AGOAPPLY INSTANTLYPET FRIENDLY
- APPLY INSTANTLYPET FRIENDLY
Explore by feature - Air Conditioning
- APPLY INSTANTLYPET FRIENDLY
- APPLY INSTANTLYPET FRIENDLY
- APPLY INSTANTLYPET FRIENDLY
- APPLY INSTANTLYPET FRIENDLYROOM FOR RENT
- APPLY INSTANTLYFURNISHED
- APPLY INSTANTLYPET FRIENDLY
- NEW - 2 DAYS AGOAPPLY INSTANTLYPET FRIENDLY
- APPLY INSTANTLY
- APPLY INSTANTLYPET FRIENDLYFURNISHEDROOM FOR RENT
Explore by feature - Pet Friendly
- NEW - 1 DAY AGOAPPLY INSTANTLYPET FRIENDLY
- APPLY INSTANTLYPET FRIENDLY
- APPLY INSTANTLYPET FRIENDLY
- APPLY INSTANTLYPET FRIENDLY
- APPLY INSTANTLYPET FRIENDLY
- NEW - 2 DAYS AGOAPPLY INSTANTLYPET FRIENDLY
- APPLY INSTANTLYPET FRIENDLY
- APPLY INSTANTLYPET FRIENDLYFURNISHEDROOM FOR RENT
- APPLY INSTANTLYPET FRIENDLY
- NEW - 1 DAY AGOPET FRIENDLY


What Locals Say about Fruitport
Average Rent Trends in Fruitport, MI
Rent in Fruitport, MI varies by number of bedrooms and home type. Use these charts to quickly see how rent changes.
Average rent decreased in Jun 2026 compared to the previous month. Rent previously peaked in Apr 2026.
| Month | Average rent |
|---|---|
| Feb 2025 | $2,295 |
| May 2025 | $1,250 |
| Jun 2025 | $1,500 |
| Jul 2025 | $1,500 |
| Aug 2025 | $1,550 |
| Sep 2025 | $2,288 |
| Oct 2025 | $2,000 |
| Nov 2025 | $1,900 |
| Dec 2025 | $2,150 |
| Jan 2026 | $1,250 |
| Apr 2026 | $3,000 |
| Jun 2026 | $2,200 |
Average Rent By Bedroom and Home Type
In June 2026, Apartments and Condos were the most affordable home type to rent compared with Houses.
| 1 bed | 2 beds | 3 beds | 4 beds | All | |
|---|---|---|---|---|---|
| All home types | — | — | $2,200 | — | $2,200 |
| Apartments and Condos | — | — | — | — | $1,175 |
| Houses | — | — | $2,200 | — | $2,200 |
Frequently Asked Questions about Rentals in Fruitport, MI
- What is the average rent of an apartment in Fruitport, MI?The average rent of an apartment in Fruitport, MI is $1,175 per month. This is about 40% lower than the national average.
- What is the average rent of a house in Fruitport, MI?The average rent of a house in Fruitport, MI is $2,200 per month. This is about 13% higher than the national average.
- When is the average rent cheapest in Fruitport, MI?In the last year, the average rent in Fruitport, MI was lowest in May 2025 when it was $1,250 per month.
- When is the average rent most expensive in Fruitport, MI?In the last year, the average rent in Fruitport, MI was highest in Feb 2025 when it was $2,295 per month.
- How many available rental listings are in Fruitport, MI?There are 1 available rental listings in Fruitport, MI.
- What are some zip codes in Fruitport, MI?Fruitport, MI includes zip codes such as: 49415.
- What are some cities near Fruitport, MI?Some nearby cities include: Nunica, Spring Lake, Wolf Lake, Norton Shores, Muskegon Heights. These cities may have more rental options to explore.