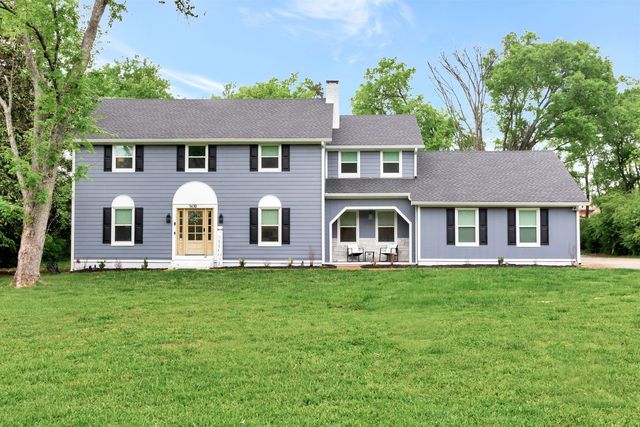
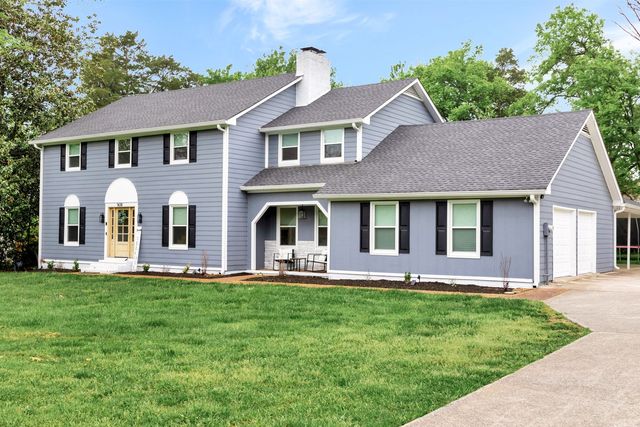
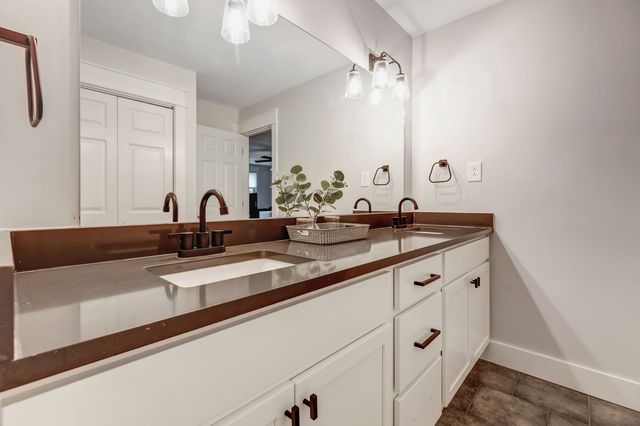
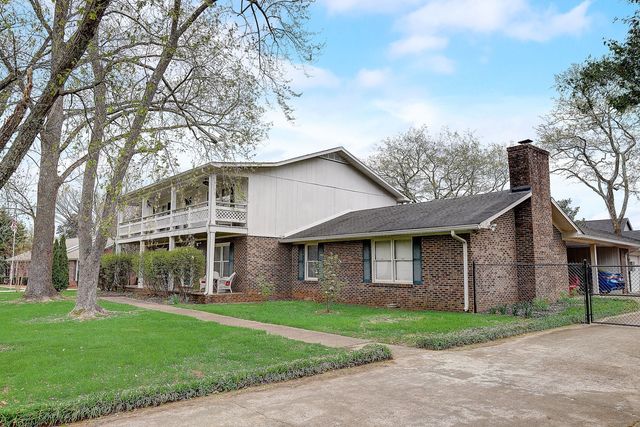
Indian Springs, Murfreesboro Real Estate & Homes For Sale
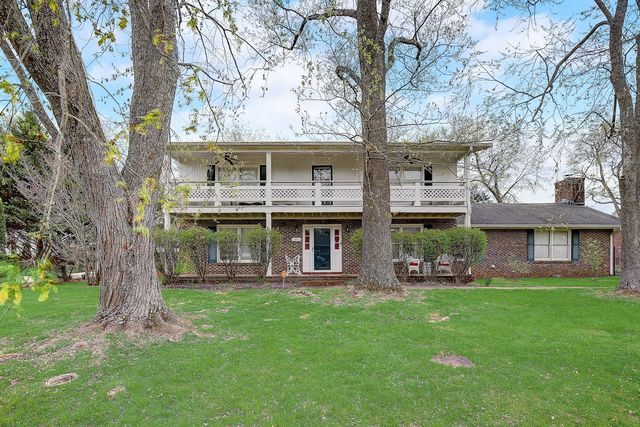
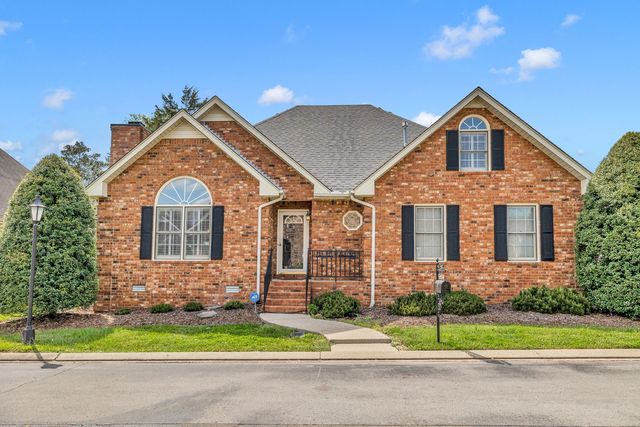
2 homes
Homes Near Indian Springs, Murfreesboro, TN
We found 6 more homes matching your filters just outside Indian Springs
Indian Springs, Murfreesboro, TN Real Estate Trends
Learn about the Indian Springs, Murfreesboro, TN housing market through trends and averages.
Affordability of Living in Indian Springs, Murfreesboro, TN
The median home value is $467,267
| Month | Median home value |
|---|---|
| April 2023 | $453k |
| May 2023 | $454k |
| June 2023 | $456k |
| July 2023 | $458k |
| August 2023 | $459k |
| September 2023 | $460k |
| October 2023 | $461k |
| November 2023 | $461k |
| December 2023 | $460k |
| January 2024 | $461k |
| February 2024 | $463k |
| March 2024 | $467k |
View as a graph
Trends and affordability stats are provided by third party data sources.

Based on information submitted to the MLS GRID as of 2024-02-09 15:39:37 PST. All data is obtained from various sources and may not have been verified by broker or MLS GRID. Supplied Open House Information is subject to change without notice. All information should be independently reviewed and verified for accuracy. Properties may or may not be listed by the office/agent presenting the information. Some IDX listings have been excluded from this website. Click here for more information
The listing broker’s offer of compensation is made only to participants of the MLS where the listing is filed.
The listing broker’s offer of compensation is made only to participants of the MLS where the listing is filed.
