
Deals to sell homes are falling through at a faster rate than than they were a year ago and it’s agreements for starter homes that are most at risk.
There is at least one thing that both parties in a home transaction usually want: for the sale to go through as quickly and easily as possible. If a loan can’t be secured or an inspection comes back with red flags, then a painless transfer could prove elusive. We wanted to see where it was most common for properties to go from agreement to sell, or what’s called an “active contingent” or “pending” status back to “for sale” or “for sale by owner”. We call these “sale fails.” Here are some key takeaways from what we found:
- Nationally, sales have been failing at an increasing rate, rising to 4.3% in Q4 2016 from 1.4% of all listed properties during Q4 2014. On an annual basis, the failure rate has nearly doubled to 3.9% in 2016, up from 2.1% in 2015.
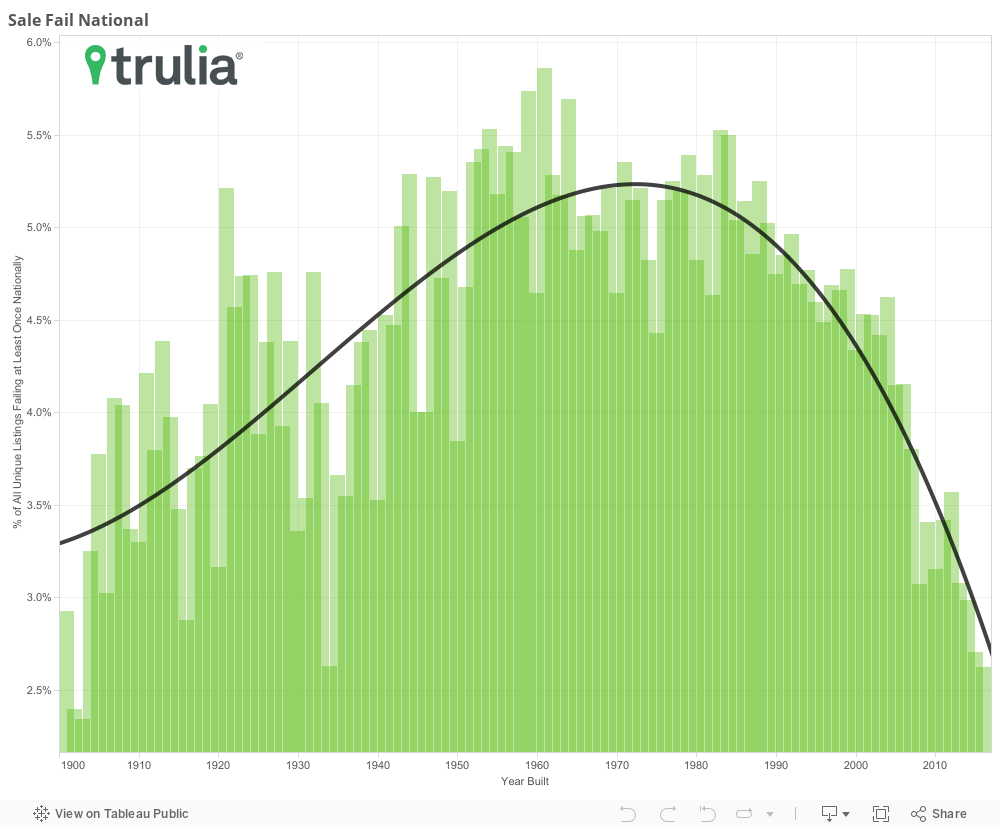
- New homes and very old homes are least likely to see deals fail. As of Q4 2016, homes built in 2016 have among the lowest proportion of failed sales at 2.6%. That proportion increases steadily as age increases to an average of 5.2% in homes built from 1959 through 1969, then falls steadily to an average of 3.5% for homes built from 1900 through 1920.
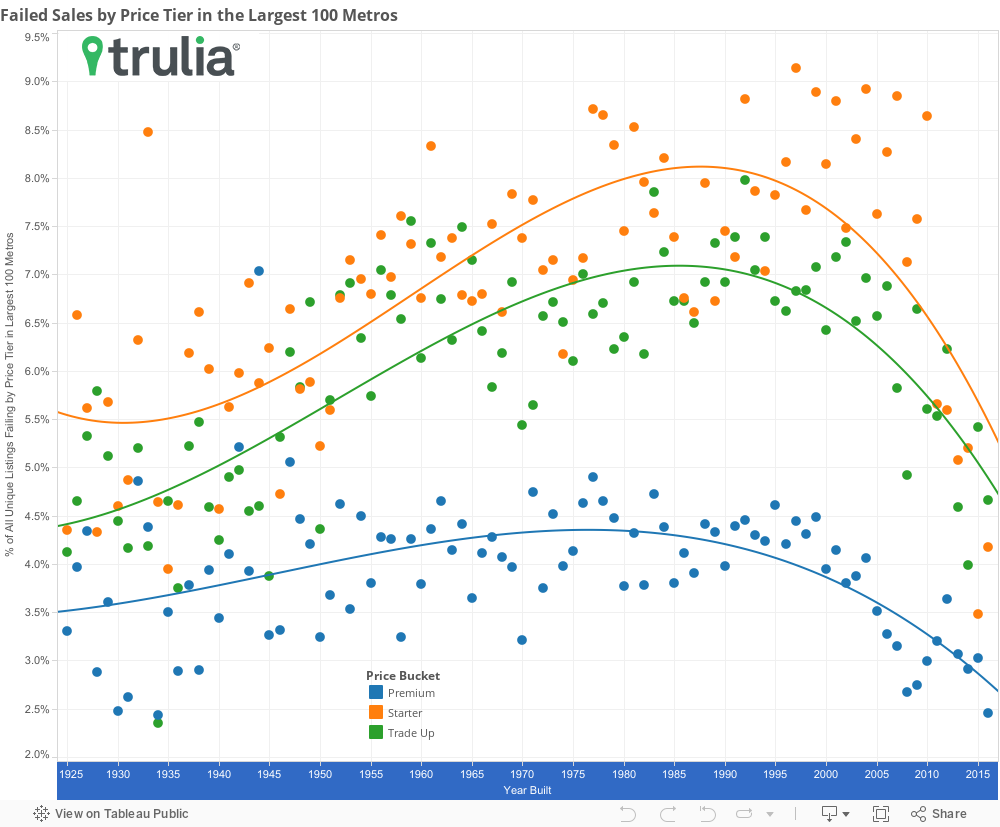
- Of all listings in the largest 100 metros, 7.1% of starter home listings failed in the most recent quarter, compared with 6.7% of trade-up homes and 3.8% of premium homes. For all of 2016, the failure rate was 6.3% for both starter and trade-up homes and 3.6% for premium homes.
- During the last two years, the places with the most failed sales are predominantly in the West with Las Vegas leading the pack at 7.6% of all unique listings reverting back to “for sale” at least once.
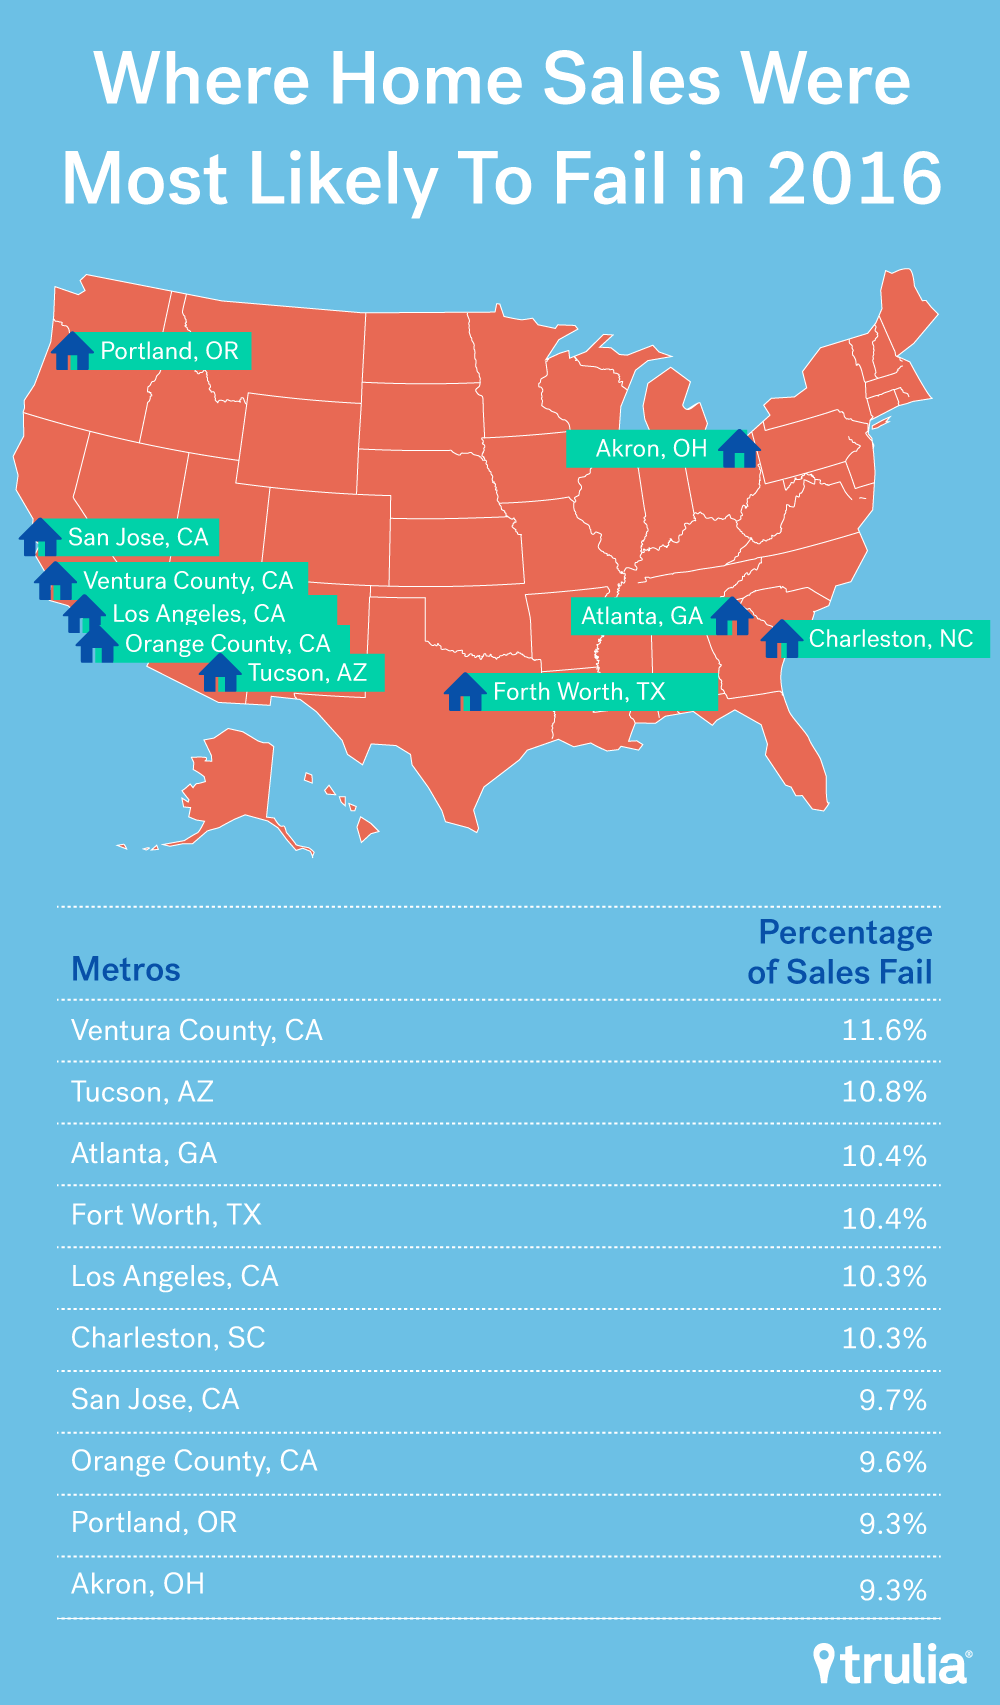
- During the most recent quarter, Tucson, Ariz., saw the highest rate of failed deals with 13.9% of all unique listings retrogressing. For all of 2016, Ventura County, Calif., had the highest fail rate at 11.6%, up from 3.1% in 2015.
- Considering both the last two years and just the most recent quarter, Madison, Wis., has had the fewest listings fall back to a “for sale” status at 0.1% of all listings.
Since the fourth quarter of 2014, the share of listings that fail at least once has increased by 2.9 percentage points to 4.3% from 1.4%, with most of this increase occurring after the fourth quarter of 2015. Annually, this rate increased from 2.1% in 2015 to 3.9% in 2016. Among possible reasons for this, we suspect that an increasing number of first-time homebuyers are getting back on the dance floor, along with people whose credit was hurt during the recession.
First-Time Homebuyers See More Failed Deals
First-time homebuyers have made up 35% of sales in 2016 up from 32% in 2015, and this is just among successful transactions, according to the National Association of Realtors. Not only are first-time hombuyers unfamiliar with the process, they face unique hurdles. They don’t bring equity or a credit history from a previous home. Their finances face additional scrutiny. And for those seeking an FHA loan for down payment, there are restrictions on type of home and its amenities.
One indication that first-time homebuyers are at least partially the source of increasing sale fails is the increasing dominance of starter and trade-up home sales that are falling through. Starter home sale fails have increased from 2.4% in Q4 2014 to 7.1% in Q4 2016. Trade-up and premium homes have increased from 2.4% and 1.5% to 6.7% and 3.8%, respectively. During the fourth quarter of 2016, of the 100 largest metros, 62 of them had the highest proportion of failed sales occurring in the lower 1/3rd of homes by value, or what we call starter homes. 36 of the remaining metros had the highest proportion of failed sales occur in the middle third of all homes by value (trade-up homes) and only 2 had the highest proportion of failed sales occur in the upper third (premium homes). In comparison, in Q4 2014 only 50 metros had the highest proportion of failed sales occur in the starter home price range while 39 and 11 metros had the highest proportion in trade-up and premium homes, respectively.
| America’s Top 10 Metros Where Starter Home Sales Failed in 2016 | |||
| U.S. Metro Area | % of Starter Sale Fails, 2015 | % of Starter Sale Fails, 2016 | %-Point Change, 2015-2016 |
| Charleston, SC | 2.7% | 16.5% | 13.8 |
| Fort Worth, TX | 5.3% | 15.3% | 9.9 |
| Dallas, TX | 6.7% | 15.0% | 8.2 |
| Atlanta, GA | 7.1% | 13.8% | 6.7 |
| Ventura County, CA | 2.7% | 13.7% | 11.0 |
| Portland, OR | 8.3% | 13.5% | 5.2 |
| Houston, TX | 8.7% | 12.8% | 4.1 |
| Tucson, AZ | 5.4% | 12.7% | 7.3 |
| Orange County, CA | 6.3% | 12.4% | 6.1 |
| Los Angeles, CA | 5.8% | 12.2% | 6.4 |
| Average Top 100 Metros | 3.4% | 6.3% | 2.9 |
| NOTE: Among 100 largest U.S. metros. To download the full data set, click here. | |||
Older Homes More Likely to be in a Sale Fail
Home age also seems to be a pretty good predictor of a sale fail. As of the fourth quarter of 2016, homes that were built in 2016, had among the lowest failed sale rates at 2.6%. In the national chart below, you can see that as homes age, the fail rate increases steadily, with homes that are around 50 years old having the highest failed sale rates (i.e. homes built in early 1960s), then declining, in a less uniform manner, as the year built approaches 1900. One reason: premium home listings make up more than 70% of all listings that were built after 2000 and less than 40% of homes built before 1980. Since premium homes have the lowest fail rate regardless of year built, their dominance drives down the fail rate in more recently built homes, and their smaller role pushes up the fail rate in older homes.
However, in all three price categories, starter, trade-up, and premium, the same pattern emerges with the newest homes having the lowest fail rate, followed by a sharp rise, then a gradual decline. Homes that are 20, 30 or 40 years old are more likely to be running to their first round of expensive necessary upkeep and improvements, which would increase their chance of having potential buyers shy away. Beyond these formative years though, in order for a home to still be livable, some minimum level of upkeep needs to have been put into it. Major structural problems and other things that deter potential buyers have likely already been taken care of. Additionally, buyers looking at older homes are probably less surprised to hear bad (expensive) news from an inspection than buyers of newer homes. In the chart below, we have taken listings from our largest 100 metros and divided them into their lower, middle and upper third price tiers based on local home values in each metro, and then broken them out by the year they were built and fail rate.
California Leads Nation in Metros With Failed Sales
Of the top 10 metros that have had the highest proportion of failed sales during the past 2 years, eight of them are in the West and three of those are in California. The two that are not in the West are Atlanta and Chicago with a quarterly average of 7.2% and 6.5%, respectively, of all unique listings reverting back to a for sale status. In comparison, looking only at the most recent quarter, seven of the top 10 metros are in the West, but four of those are in California. Charleston, S.C., has moved up to second among the top 100 metros from 88th with 11.9% of sales failing, up from 1% in Q4 2014 to second. See the full table here. {link to full table with quarterly fail rates by metro}
What does all this mean for you? As a potential buyer, make sure you’ve done everything you can in the way of mortgage approval/preapproval and know your financial limits. This will make it easier to recognize potential challenges and opportunities earlier in the search and transaction process. As a seller (or agent), it will serve you well to know your market and the home. Don’t be afraid to be forthcoming with problem areas that would likely come up in an inspection.
Methodology
The daily status of all listings were pulled for the first two months of each quarter from Q4 2014 through Q4 2016. Any properties that went from “Pending”, or “Active Contingent” back to “For Sale”, or “For Sale by Owner” were tagged as a property that reverted in status. From there, the proportions of listings that reverted in any given geography or price range or by any aspect of the homes (such as year built) could be determined.
When looking at how failed sales are distributed across price ranges, we define the price cutoffs of each segment based on home value estimates at the metro level of the entire housing stock, not listing price. For example, we estimate the value of each single-family home and condo and divide these estimates into three groups: the lower third we classify as starter homes, the middle third as trade-up homes, and the upper third as premium homes. We classify a listing as a starter home on the market if its listing price falls below the price cutoff between starter and trade-up homes.

