
High incomes and good credit scores are qualities that landlords look for in future tenants, but landlords also look favorably upon prospective tenants who offer up more information from the get go, are serious about their search, and are ready to act upon an offer.
If you’ve ever rented, you know the stress. Let’s say you just moved to the big city for a new job, all the way from your parents’ basement in suburbia. The job starts in a month, and you can’t just keep crashing at your friend’s living room. You need to find your own place and move out soon. You may have emailed numerous landlords about their properties, but many landlords don’t even acknowledge your email. Maybe that’s because you aren’t qualified enough. Perhaps there are applicants just as attractive as you who beat you to applying. In the last decade, there’s been a five percentage-point increase in the number of renters to 43.3% from 38.5.
In today’s competitive rental market, the apartment that you want is highly elusive. So what is a renter to do in order to get some love from landlords?
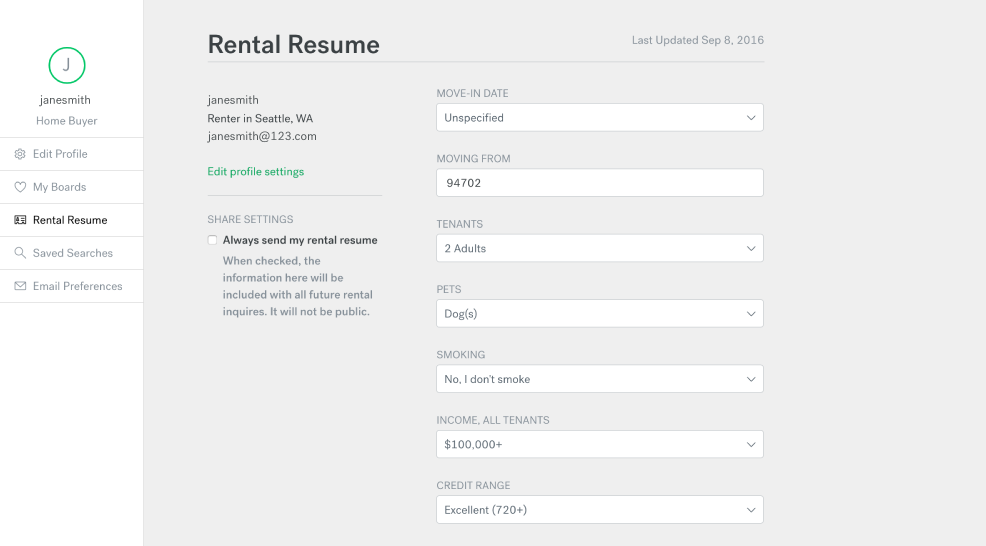
We examined information gleaned from our Rental Resume feature. The resume is a form not unlike a job application. It enables Trulia users to convey personal and financial information about themselves to landlords. When expressing interest in Trulia’s rental listings, prospective tenants have the option to attach their Rental Resumes to their inquiries in addition to sending a customized message to the landlord.
By analyzing all of this data, we found that landlords are more responsive to prospective tenants who are forthcoming. Specifically, writing a customized message to the landlord, sharing a Rental Resume, and filling out more of the questions on the Rental Resume increases the likelihood that the landlord will respond to the user’s inquiry. We found it pays to:
- Get Personal: Those inquiring about properties with a customized message were 20% more likely to hear back from landlords than those inquiring without customizing their messages. Those who shared a Rental Resume were 10% more likely to hear back from landlords than those who did not share a resume. [i]
- Give Details: When examining only those surveyed users that shared a Rental Resume, sending a customized message to the landlord increased your chances of hearing back from the landlord by 30%. Those who filled out at least five of the nine fields were 10% more likely to hear back from the landlord than those who filled out less than five fields.[ii]
- Say Something: Those who leave Rental Resume fields blank are more likely to take a longer time to find an apartment.[iii]
[i] These statistics were significant at the 5% level and were calculated based on odds ratios derived from the first logit regression specified in the methodology section.
[ii] These statistics were significant at the 10% level and were calculated based on odds ratios derived from the second logit regression specified in the methodology section.
[iii] See footnote v.
Landlords appreciate future tenants who are rich and reliable. Income ranges and credit score ranges that prospective tenants belong to are the most statistically significant variables that impact the likelihood that they will hear back from a landlord[i]. The higher the income range and the credit score range the tenant belongs to, the more likely the landlord will respond.
In addition to income and creditworthiness, we also found candidates consisting of two or more tenants who were able to find a place to live sooner than solo tenants, suggesting that they might be more attractive than single candidates are.
Landlords also appreciate prospective tenants who are ready. We found that those who specified their move-in time frame as being one-week away were able to find a place sooner than those whose move-in time frame was 30-days away.[ii]
In order to explain our findings, we developed two sets of profiles. The first set focuses on credit, income and engagement and which profiles were more likely to get a landlord response:
- Rich and Reliable: Someone who submitted a customized message to the landlord, had an income greater than $100K, and had a credit score between 720 and 850.
- Middle of the Road: Someone who did not submit a customized message, had an income between $50K and $100K, and had a credit score between 600 and 650.
- Risky and Reserved: Someone who did not submit a customized message, had an income between $0 and $25K, and had a credit score between 0 and 600.
[i] The findings below were significant at the 1% level and were calculated based on odds ratios derived from the third logit regression specified in the methodology section. We found that landlords have a strong disdain for future tenants who are not rich and not reliable, so much so that you are better off leaving the income and credit score sections of the Rental Resume blank if you fall under the $0~$25,000 income range or the 0~600 credit score range.
[ii]The following insights were derived from the forth model (Cox proportional hazard model) specified in the methodology section using model coefficient values and cumulative hazard rates. This model was fit solely using demographic data generated by the Rental Resume product. This is a survival model where survivors can be thought of as those who have not yet been able to find an apartment and are still actively searching in the market.
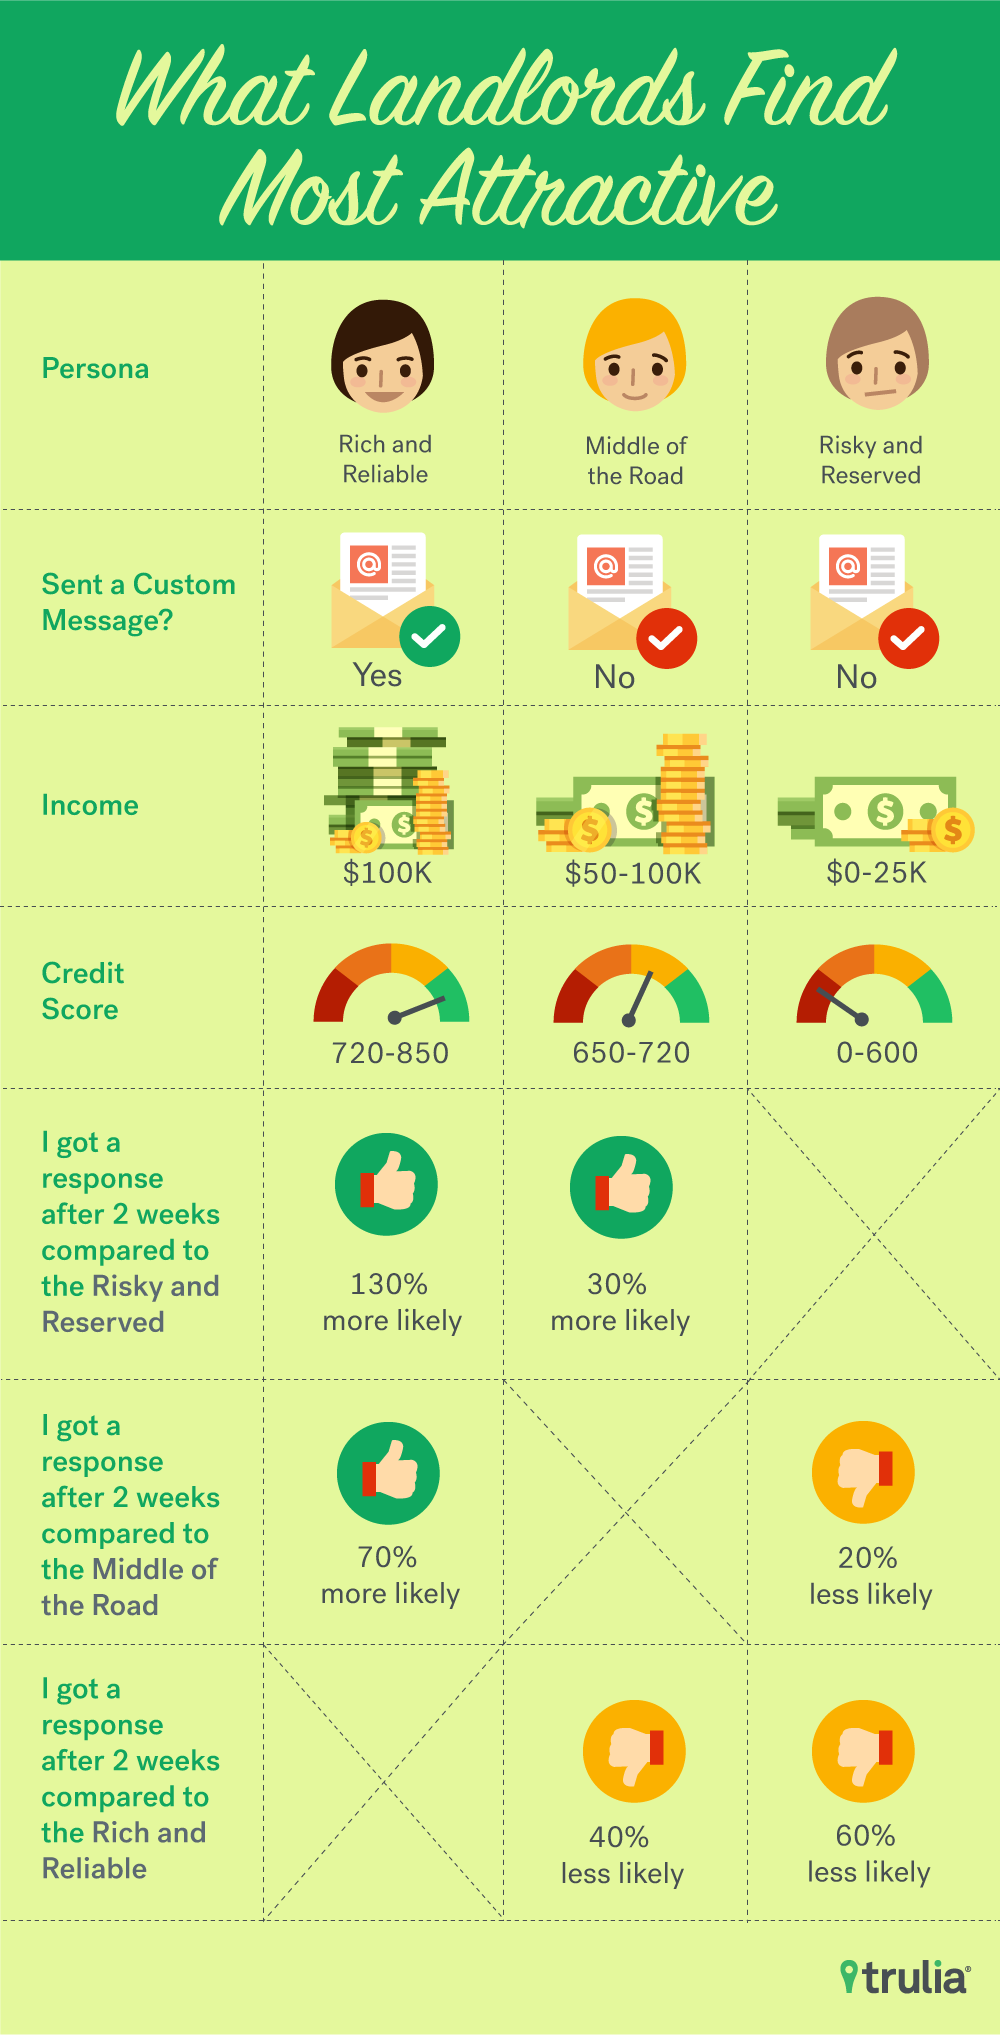
The Rich and Reliable were 70% more likely to receive a response from a landlord than the Middle of the Road candidate and 130% more likely than the Risky and Reserved. The Middle of the Road were 30% more likely to receive a response than the Risky and Reserved. Thus, it’s not a surprise we found that the higher the income and credit score, the sooner the prospective tenant was able to leave the market, most likely by finding an apartment.[i] Note that one can have a high income but a low credit score, and vice versa. In other words, many may not exactly fit the three profiles above. We developed these profiles for the sake of simplicity in explaining.
The first set of profiles and the statistical model from which they were derived enabled us to demonstrate who is more likely to receive a response from landlords than others. However, we wanted to go even further than that and explain who is more likely to have found an apartment to live in than others within a given timeframe. In order to do so, we developed the a second set of profiles using a statistical model that estimated how quickly each of these profiles can find an apartment relative to one another.[ii] This set measures how long candidates remained in the market.
- Forthcoming, Rich, Reliable, and Ready: Income $100k+, credit score 720-850, number of tenants 3, has a move-in time frame of 7 days, and submitted 13 leads.
- Average and Acceptable: Income $50k-$100k, credit score 650-720, number of tenants 1, move-in time frame 30 days, and submitted 13 leads.
- Unknown Quantity: User left all fields blank or unspecified and submitted 13 leads.
Two weeks into the rental search, the Forthcoming, Rich, Reliable, and Ready are 200% more likely to have already found an apartment than the Average and Acceptable and 420% more likely than the Unknown Quantity. The Average and Acceptable are 80% more likely to have already found an apartment than the Unknown Quantity 2 weeks into the search. Again, many renters will not exactly fit these three profiles described above. We used these profiles in order to make it easier for the broader audience to understand our findings.
[i] See footnote v.
[ii] See footnote v.
Where Renters Are Most Competitive
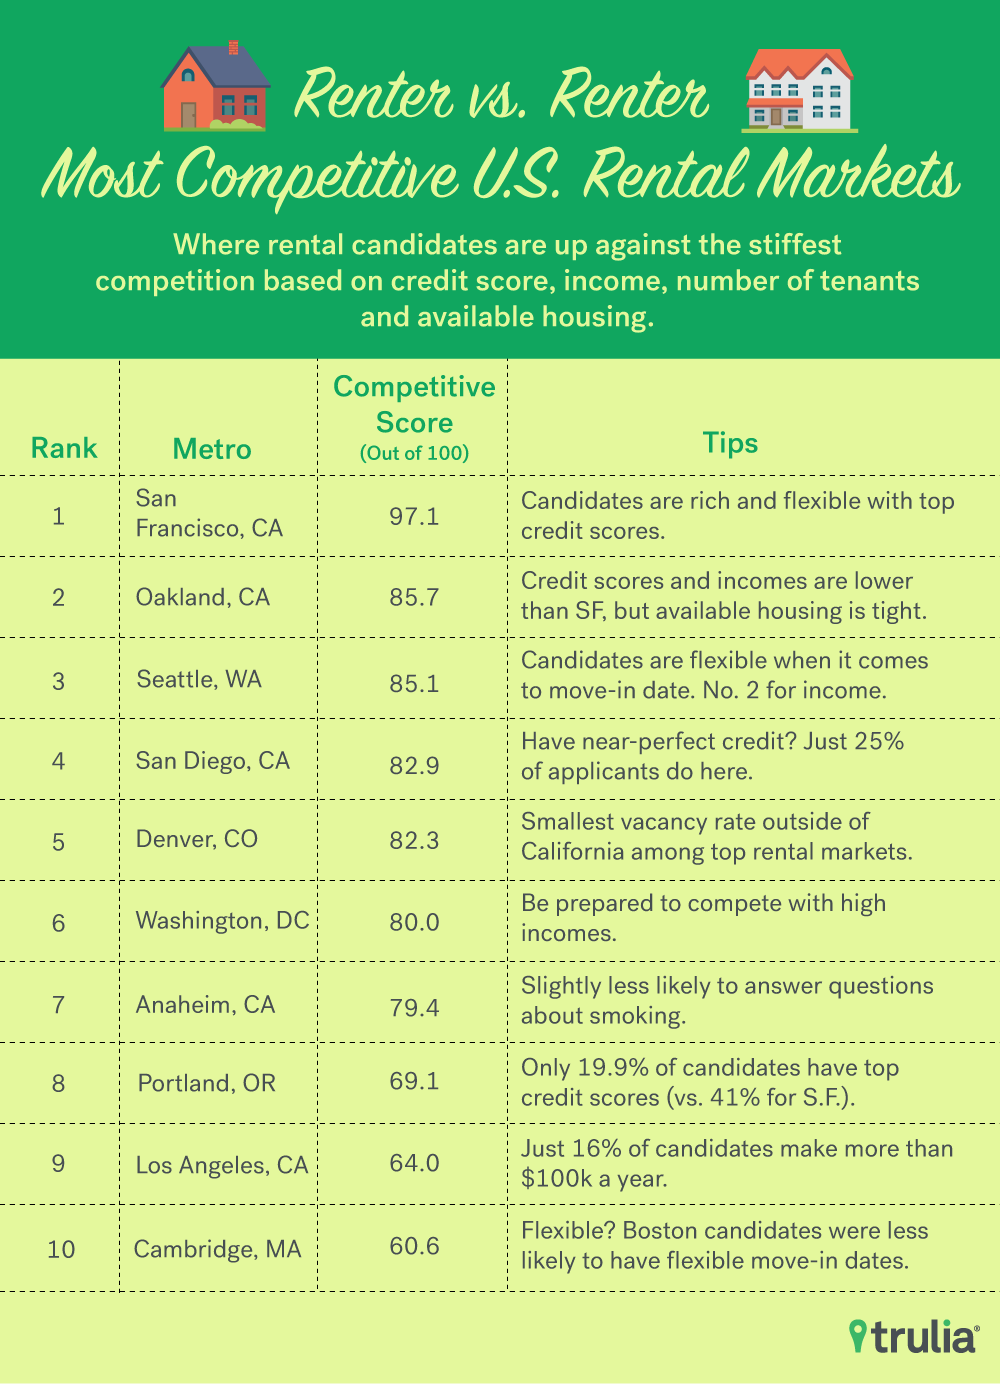
Combining the characteristics successful rental candidates bring to the table and vacancy rates, we rank the nation’s 25 largest rental markets based on competitiveness scores, which we calculated based on how well-qualified prospective renters are in each metro.
The score also takes into account home vacancy rates for each metro. Metro areas that have better qualified prospective tenants and lower vacancy rates received a higher competitiveness score. How we calculated the competitiveness score can be found in the methodology section.
We found San Francisco (competitiveness score of 97.1), Oakland (85.7), Seattle (85.1), San Diego (82.9), and Denver (82.3) to be the five most competitive rental markets. Atlanta (19.4), Tampa, Fla., (20.0), Philadelphia (20.6), Riverside, Calif., (21.1), and Newark, N.J., (21.7) came in last.
Ranking of Metro Areas Based on Rental Market Competitiveness
| Ranking | U.S. Metro | Rental Resume, Share of renters falling into the following categories… | Vacancy Rate of Homes | Competitiveness Score | |||||
| 720-850 credit score | 100K+ income | 7 to 30 days target move-in | Provided information regarding pets | Provided information regarding smoker status | Provided information regarding number of tenants | ||||
| 1 | San Francisco-Redwood City-South San Francisco, CA | 41.1% | 39.2% | 47.6% | 91.7% | 91.5% | 92.5% | 1.0% | 97.1 |
| 2 | Oakland-Hayward-Berkeley, CA | 26.4% | 29.2% | 43.9% | 90.3% | 90.7% | 91.6% | 0.6% | 85.7 |
| 3 | Seattle-Bellevue-Everett, WA | 27.4% | 26.7% | 46.4% | 90.3% | 90.4% | 91.8% | 1.4% | 85.1 |
| 4 | San Diego-Carlsbad, CA | 25.4% | 19.7% | 46.3% | 90.2% | 90.0% | 91.7% | 0.9% | 82.9 |
| 5 | Denver-Aurora-Lakewood, CO | 20.8% | 16.5% | 45.8% | 91.7% | 90.7% | 92.3% | 0.5% | 82.3 |
| 6 | Washington-Arlington-Alexandria, DC-VA-MD-WV | 23.8% | 21.2% | 44.6% | 90.6% | 90.2% | 91.4% | 0.9% | 80.0 |
| 7 | Anaheim-Santa Ana-Irvine, CA | 25.3% | 25.9% | 45.6% | 90.0% | 89.8% | 91.2% | 1.0% | 79.4 |
| 8 | Portland-Vancouver-Hillsboro, OR-WA | 19.9% | 14.5% | 45.2% | 90.3% | 89.8% | 91.9% | 0.7% | 69.1 |
| 9 | Los Angeles-Long Beach-Glendale, CA | 22.4% | 15.9% | 42.4% | 89.5% | 89.2% | 90.5% | 1.7% | 64.0 |
| 10 | Boston, MA | 27.3% | 17.2% | 30.5% | 90.0% | 89.4% | 90.6% | 1.4% | 60.6 |
| 11 | Cambridge-Newton-Framingham, MA | 27.2% | 17.5% | 35.4% | 89.5% | 89.0% | 90.6% | 1.2% | 60.6 |
| 12 | Minneapolis-St. Paul-Bloomington, MN-WI | 17.8% | 11.4% | 40.7% | 89.9% | 89.1% | 91.6% | 1.2% | 57.7 |
| 13 | New York-Jersey City-White Plains, NY-NJ | 21.9% | 14.9% | 39.5% | 88.3% | 87.6% | 89.3% | 1.3% | 47.4 |
| 14 | Dallas-Plano-Irving, TX | 9.5% | 11.4% | 43.2% | 89.2% | 88.6% | 90.1% | 1.3% | 46.9 |
| 15 | Chicago-Naperville-Arlington Heights, IL | 17.2% | 11.8% | 42.3% | 88.8% | 87.8% | 89.4% | 2.9% | 42.9 |
| 16 | Phoenix-Mesa-Scottsdale, AZ | 10.0% | 8.4% | 45.0% | 88.3% | 87.3% | 89.1% | 2.1% | 39.4 |
| 17 | Houston-The Woodlands-Sugar Land, TX | 7.9% | 7.6% | 44.1% | 88.1% | 87.5% | 88.9% | 1.8% | 33.1 |
| 18 | Baltimore-Columbia-Towson, MD | 13.7% | 11.4% | 42.0% | 88.0% | 87.0% | 89.0% | 3.2% | 31.4 |
| 19 | Miami-Miami Beach-Kendall, FL | 15.6% | 8.1% | 40.2% | 87.5% | 87.3% | 89.0% | 2.3% | 29.1 |
| 20 | St. Louis, MO-IL | 9.6% | 5.6% | 43.6% | 87.4% | 86.9% | 88.6% | 1.6% | 22.3 |
| 21 | Newark, NJ-PA | 15.2% | 10.7% | 39.4% | 86.9% | 85.8% | 87.8% | 2.0% | 21.7 |
| 22 | Riverside-San Bernardino-Ontario, CA | 8.9% | 9.1% | 40.6% | 87.1% | 86.7% | 88.3% | 4.5% | 21.1 |
| 23 | Philadelphia, PA | 15.5% | 7.8% | 36.9% | 87.2% | 86.8% | 88.5% | 3.5% | 20.6 |
| 24 | Tampa-St. Petersburg-Clearwater, FL | 12.7% | 8.4% | 43.8% | 87.1% | 85.6% | 87.9% | 1.8% | 20.0 |
| 25 | Atlanta-Sandy Springs-Roswell, GA | 7.3% | 6.7% | 42.3% | 87.2% | 86.4% | 88.0% | 2.7% | 19.4 |
Methodology
The nine fields that users can fill out on the Rental Resume as shown in Exhibit A below are move-in date, moving-from-zip-code, number of tenants, whether or not one has pets, whether or not one smokes, income range of all tenants, FICO credit score range, name of employer, and job title.
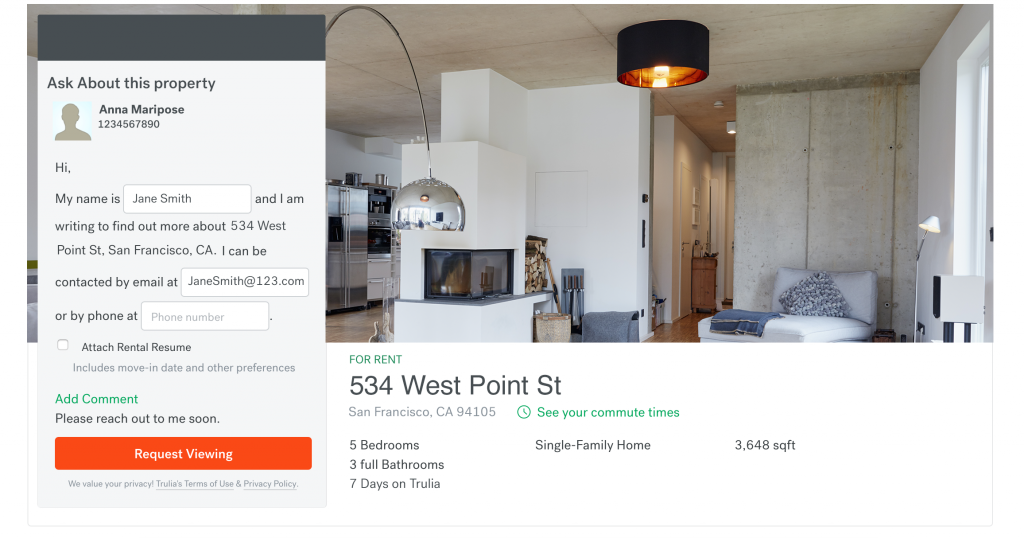
As shown below, the user can check the box to the left of “Attach Rental Resume” in order to attach a resume to the rental inquiry and also add a customized comment by clicking on the green Add Comment button, before clicking on the orange button that says “Request Viewing” to inquire about the property.
Four separate models were fit for this study.
The first model was a logit regression model fit using data from all Trulia users that participated in the survey between Jan 31st, 2016 and July 12th, 2016. This model was specified as follows. , where p is the probability that the user hears back from the landlord, CustomMessage = 1 if the user modified and sent a customized message (otherwise 0), SharedRenterResume = 1 if the user shared a Rental Resume with the landlord (otherwise 0), and NumLeadSubmit is the number of times a user expressed interest in different properties.
The second model was a logit regression model, but this second model was fit using data from Trulia users that not only participated in the survey but also shared a Rental Resume with landlords between Jan 31st, 2016 and July 12th, 2016. This second model was specified as follows. , where AtLeastHalf = 1 if the user filled out 5 or more of the Rental Resume questions (otherwise 0).
The third model was a logit regression model fit using the same data as the second model, but was specified as follows. , where IncomeRange is a categorical variable that corresponds with the possible Income Range choices found on the Rental Resume and CreditScoreRange is a categorical variable that corresponds with the possible Credit Score Range choices.
The forth model was a Cox proportional hazard model fit using all demographic/user data generated by the Rental Resume product between Jan 31st, 2016 and July 12th, 2016. The forth model was specified as follows. log(λ(t|IncomeRange,CreditRange,NumTenants,PetInfo,SmokerInfo,MoveInTimeFr,NumLeads)/λ0(t))=β1*IncomeRange+β2*CreditRange+β3*NumTenants+β4*PetInfo+β5*SmokerInfo+β6*MoveInTimeFr+β7*NumLeads. The left-hand side of the equation is the log proportional hazard rate, IncomeRange, CreditRange, NumTenants, PetInfo, SmokerInfo, and MoveInTimeFr are categorical variables that correspond to the possible income-range choices, credit-score-range choices, choices for Number of Tenants, choices regarding the tenant’s pet situation, choices regarding whether or not the renter smokes or not, and choices regarding the tenant’s move-in time frame, respectively, and NumLeads is the number of leads submitted by the user.
The competitiveness scores of the top 25 rental metro area were calculated based on the rankings of the metro areas with respect to each of the following seven metrics (rankings with respect to each of these 7 metrics were in ascending order): 1) The share of leads submitted by renters who fall into the top credit range bucket, 2) The share of leads submitted by renters who fall into the top income range bucket, 3) The share of leads submitted by renters who are looking to make a move 7 days later or 30 days later, 4) The share of leads submitted by renters who did not leave the pet information section blank or chose “Unspecified”, 5) The share of leads submitted by renters who did not leave the smoker information section blank or chose “Unspecified”, 6) The share of leads submitted by renters who did not leave the number of tenants section blank or chose “Unspecified”, 7) The vacancy rate x (-1) of residences as of July 2016 estimated using US Postal Service data. For each metro, we summed its seven rankings, then divided this quantity by 175 in order to come up with the competitiveness score.. The metro area definitions follow Metropolitan Divisions where available, then Metropolitan Statistical Areas.

