Roughly 1 in 12 civilian adults are veterans. But in some smaller metros that figure is as high as 1 in 5, while in several large metros it’s just 1 in 20. We’re marking Veterans Day the Trulia way, by taking a look at where people who served their country in the armed forces live.
Basic Training on Veteran Demographics and Homeownership
Where veterans live reflects who they are. Veterans tend to be older. Their median age is 64, nearly two decades older than the 45-year-old median age of civilian adults who didn’t serve in the armed forces. Gulf War veterans are relatively young, with a median age of 41. But they’re outnumbered by Vietnam Era vets, whose median age is 65. Veterans of the Korean War and World War II are older still.
| War or Era Served In | Share of civilian adult population | Median age |
| Gulf War | 2.2% | 41 |
| Vietnam Era | 2.9% | 65 |
| Korean War | 0.9% | 81 |
| World War II | 0.5% | 88 |
All veterans |
8.1% | 64 |
| Note: Some veterans served in multiple wars or eras, and others served only between wars and eras. Therefore, data for “all veterans” does not equal the sum or average of the above rows in the table. | ||
Veterans are also overwhelming male (92%), and born in the U.S. Just 3% of veterans are foreign-born, compared with 17% of the non-veteran civilian population.
Finally, veterans are more likely to be homeowners than other adults. Households headed by veterans have a 79% homeownership rate, significantly higher than the 63% rate for households headed by civilian non-veterans. Age accounts for most of this gap. As we noted, there’s a two-decade age gap between veterans and non-veteran civilians, and, except for the very old, the homeownership rate is higher for older adults. Nevertheless, even adjusting for this age difference, homeownership is still about seven percentage points higher for veterans, thanks in part to U.S. Department of Veterans Affairs loan programs (VA loans) and other incentives.
As we’ll see below, these demographic differences help explain where veterans live.
Top Veteran Areas are Smaller Metros Near Military Bases
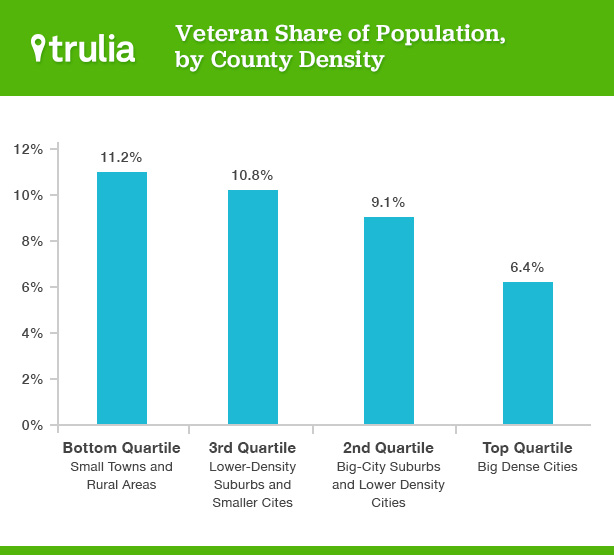
Veterans tend not to be concentrated in big cities. They account for only 6.4% of the civilian adult population in big, dense cities (see note). But they make up 11.2% in small towns and rural areas.
Because veterans tend to live outside larger markets, we looked at the largest 500 metros rather than just the 100 largest, as we typically do in Trulia Trends. In 7 of the 500 largest metros, veterans represent more than 20% of the civilian adult population. The 10 metros with the highest share of veterans have one thing in common: they are affordable. Their median asking price per square foot is below $150 in all but Oak Harbor, WA. Several of these metros have large military bases, including Camp Lejeune in Jacksonville, NC; Fort Hood in Killeen–Temple–Fort Hood, TX; and Fort Sill in Lawton, OK.
| Metros with Highest Veteran Share | |||
| # | U.S. Metro | Veteran Share of Civilian Adult Population | Median Asking Home Price Per Square Foot, $ |
| 1 | Crestview–Fort Walton Beach–Destin, FL | 22.3% | 137 |
| 2 | Oak Harbor, WA | 22.0% | 173 |
| 3 | Jacksonville, NC | 21.4% | 110 |
| 4 | Killeen–Temple–Fort Hood, TX | 21.2% | 82 |
| 5 | The Villages, FL | 20.4% | 122 |
| 6 | Sierra Vista–Douglas, AZ | 20.2% | 91 |
| 7 | Fayetteville, NC | 20.0% | 86 |
| 8 | Lawton, OK | 19.6% | 75 |
| 9 | Clarksville, TN-KY | 19.2% | 91 |
| 10 | Bremerton–Silverdale, WA | 19.1% | 142 |
| Note: among 500 largest U.S. metros. Veteran share is from Census; home prices from Trulia. | |||
None of the 100 largest metros makes the list. In fact, the largest of the top 10 is Killeen-Temple-Fort Hood, TX, which ranks just 153rd in population nationwide. Among the largest 100, Colorado Springs and Virginia Beach-Norfolk have the highest share of veterans. Both also have major military bases. Even among these larger metros with high concentrations of veterans, housing is relatively affordable.
| Metros with Highest Veteran Share (Large Metros Only) | |||
| # | U.S. Metro | Veteran Share of Civilian Adult Population | Median Asking Home Price Per Square Foot, $ |
| 1 | Colorado Springs, CO | 18.4% | 107 |
| 2 | Virginia Beach–Norfolk, VA-NC | 17.8% | 129 |
| 3 | Palm Bay–Melbourne–Titusville, FL | 16.4% | 100 |
| 4 | Tacoma, WA | 15.2% | 134 |
| 5 | North Port–Bradenton–Sarasota, FL | 14.4% | 150 |
| 6 | Jacksonville, FL | 14.0% | 109 |
| 7 | Charleston, SC | 13.2% | 134 |
| 8 | Cape Coral–Fort Myers, FL | 13.1% | 133 |
| 9 | San Antonio, TX | 12.9% | 107 |
| 10 | Tucson, AZ | 12.5% | 111 |
| Note: among 100 largest U.S. metros ONLY. Veteran share is from Census; home prices from Trulia. | |||
Where are veterans scarce? Of the largest 500 metros, the 10 with the lowest share include several large metros: Miami, New York, Los Angeles, San Jose, and San Francisco. But the list also includes Laredo and McAllen-Edinburg-Mission, TX, and El Centro, CA, on the Mexican border. Five of the bottom 10 are expensive markets, with prices over $300 per square foot: New York, the 3 big California metros, and Edwards, CO, which includes the Vail ski resort.
| Metros with Lowest Veteran Share | |||
| # | U.S. Metro | Veteran Share of Civilian Adult Population | Median Asking Home Price Per Square Foot, $ |
| 1 | Miami, FL | 3.2% | 180 |
| 2 | Laredo, TX | 3.7% | 94 |
| 3 | New York, NY-NJ | 3.8% | 320 |
| 4 | McAllen–Edinburg–Mission, TX | 4.6% | 82 |
| 5 | Los Angeles, CA | 4.6% | 334 |
| 6 | San Jose, CA | 5.1% | 430 |
| 7 | Edwards, CO | 5.2% | 336 |
| 8 | Provo–Orem, UT | 5.4% | 96 |
| 9 | El Centro, CA | 5.4% | 116 |
| 10 | San Francisco, CA | 5.5% | 613 |
| Note: among 500 largest U.S. metros. Veteran share is from Census; home prices from Trulia. | |||
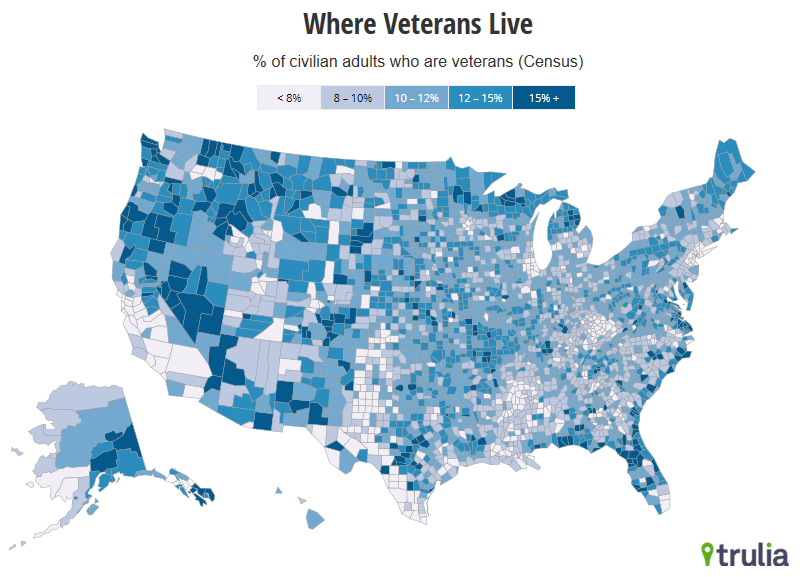
So what can we say in general about where veterans live? The map shows no clear regional pattern. Many western states have pockets where veterans live, but California has relatively few veterans. Florida includes the metro with the highest share of veterans, Crestview-Fort Walton Beach-Destin, and the lowest, Miami. Texas has Killeen-Temple-Fort Hood, with a high proportion of veterans, and border towns with low concentrations.
Still, we can make some generalizations. We should note first though that where veterans live depends on when they served. Gulf War vets tend to live in different places than World War II vets, not least because they’re on average more than four decades younger.
In sum, veterans are more likely to live:
- Near military bases and areas with active-duty residents. This is especially true for Gulf War veterans.
- In more affordable, lower density areas. Vietnam Era veterans, in particular, are more likely than other veterans or civilian non-veterans to live in small towns and rural areas.
- In areas with a lower share of foreign-born residents, especially older vets.
- In retirement areas, especially if they’re Korean War or World War II vets. In fact, the metros with the highest shares of these older veterans are in Florida.
Though their share of the population may vary, veterans can be found in nearly every community in America. If you want to thank a veteran on November 11, you probably won’t have to look far.
Notes: the Census identifies veterans as serving in the Gulf War, the Vietnam Era, the Korean War, and World War II, as well as between conflicts. See tables S2101 and B21002 in American FactFinder.
Homeownership rates are calculated from the 2013 American Community Survey (ACS) Public Use Microdata Sample (PUMS) and are based on whether the head of household, spouse, or unmarried partner is a veteran.
All national figures are based on the 2013 1-year ACS. All metro and county figures are based on the 2012 5-year ACS, covering the period 2008-2012. Nationally, veteran share of the civilian population was 8.1% in the 2013 ACS and 9.3% in the 2012 5-year ACS.
County density is based on tract-weighted density, and quartiles were defined to be roughly equal in total population. See note to this post for more detail.
To identify the location of military bases, we used Census data on the share of adults currently in the armed forces (which not does include veterans) from table DP03 in American FactFinder.

