For many U.S. housing markets it’s been a tale of two recoveries. Nearly four years after housing prices hit bottom nationally, some metro areas have seen big gains in employment, wages, housing prices. Others have seen sluggish economic growth and lagging prices. Still others have seen a seen a mix – booming employment and lagging housing market or vice versa.
We’ve crunched the numbers and asked the question: Where were the best and worst places to rent or buy since the housing market bottomed out? To create our list we factored in more than just housing prices. We looked into job prospects, wages, vacancy rates, home values or how much rent has increased to determine what places offered the best opportunities.
What we found was a wide spectrum.
- Whether you’re a renter or an owner, strong gains in the economy have helped North Carolina cities stand out as being a strong area for both renters and owners since 2012.
- New Orleans’ struggles with anemic job and wage growth have hampered home value appreciation. Meanwhile, the Crescent City’s available housing pool has declined faster than the national average, making it more expensive and difficult to find places for rent.
- Cities hardest hit by the recession — Las Vegas, Detroit and Sarasota, Fla., among them — haven’t been particularly favorable for either owners or renters.
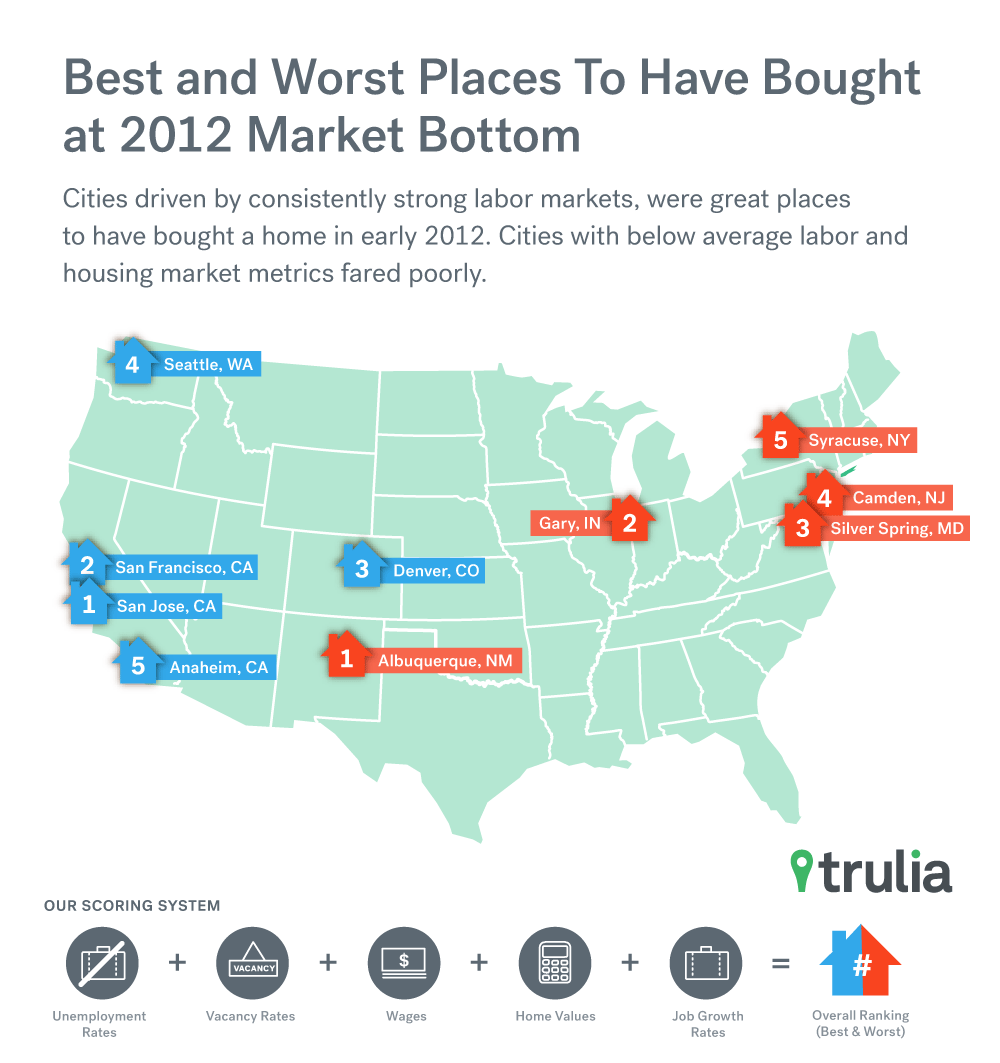
- San Francisco Bay Area cities as well as places like Denver, Seattle, and Houston, driven by consistently strong labor market fundamentals, have been great places to have bought a home in 2012 – but what’s surprising is that despite rising rents, these market’s strong job and wage growth have made them good places to rent relative to other cities.
Rounding out the list of the top 10 cities for homeowners, are places like West Palm Beach, Fla. and Anaheim, Calif.. West Palm Beach was particularly hard-hit by the recession between 2008 and 2010. Since 2012, home values have been appreciating at nearly double the average in the rest of the comparison.
While all of this price appreciation has failed to restore home values to their previous peak, labor market fundamentals have also been favorable in West Palm Beach, even compared with other cites that experienced a similarly steep employment decline during the recession. Broad job gains in multiple sectors have boosted the area. On the other side of the country, in Anaheim a similar story has unfolded, with prices not quite back to their pre-recession level, but strong labor market fundamentals and a declining vacancy rate creating better returns for those who bought homes after the recession.
| Best Places To Own Since The Housing Bottom | |||||||
| # | U.S. Metro | Owner Index | % Job Growth | % Change in Wages | % Change in Unemployment Rate | % Change in Vacancy Rate | % Change in Home Values |
| 1 | San Jose, CA | 98.2 | 12.59% | 11.64% | -45.73% | -35.58% | 44.38% |
| 2 | San Francisco, CA | 97.2 | 14.43% | 20.26% | -46.97% | -20.70% | 42.81% |
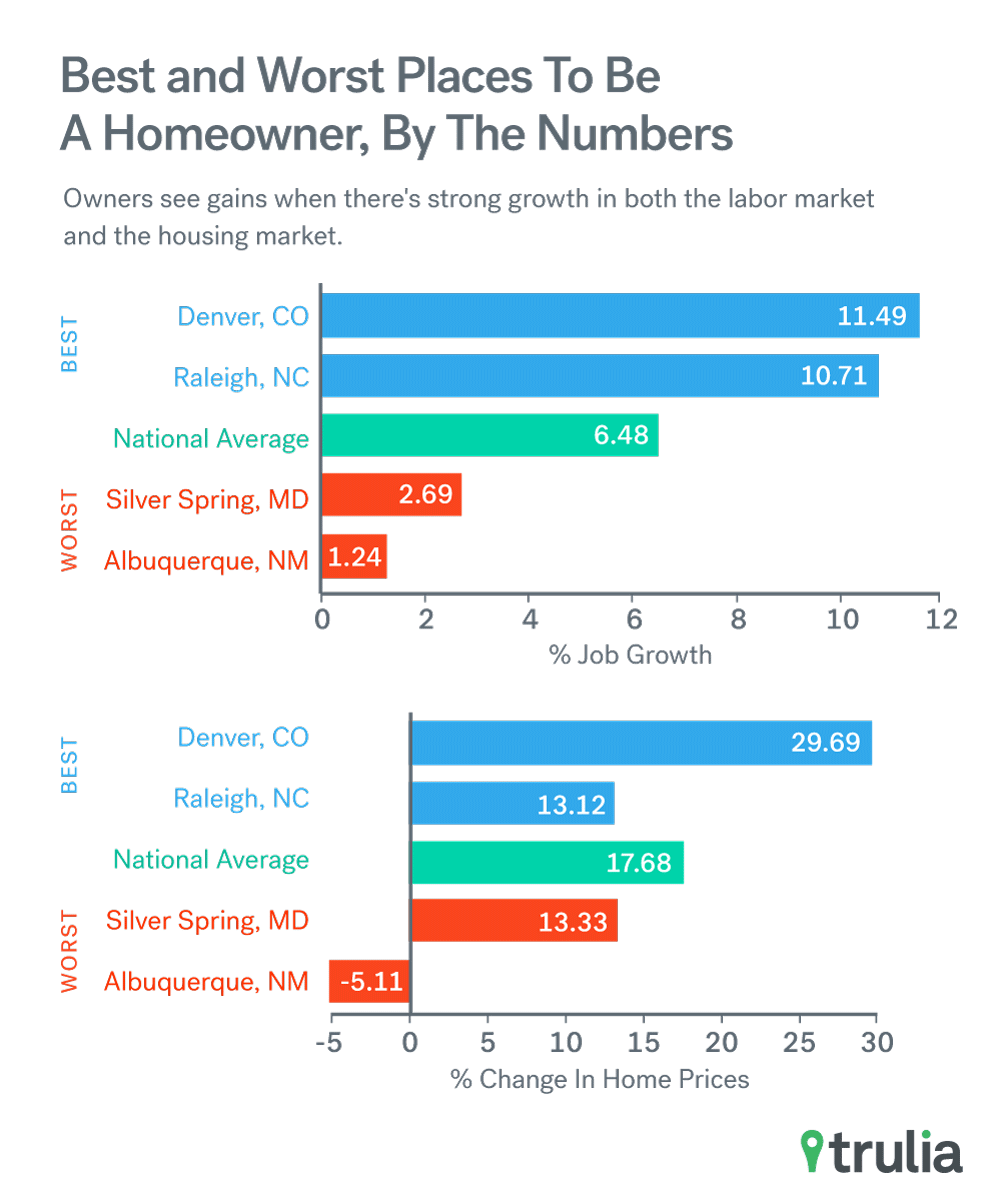
| 3 | Denver, CO | 90.8 | 11.49% | 6.55% | -44.77% | -24.03% | 29.69% |
| 4 | Seattle, WA | 86.6 | 8.80% | 9.90% | -41.81% | -19.15% | 28.66% |
| 5 | Anaheim, CA (Orange County, CA) |
82.2 | 7.77% | 6.30% | -41.32% | -26.30% | 28.19% |
| 6 | Oakland, CA | 81.6 | 9.38% | 4.59% | -43.00% | -35.39% | 48.50% |
| 7 | Raleigh, NC | 81.2 | 10.71% | 6.72% | -41.01% | -21.03% | 13.12% |
| 8 | West Palm Beach, FL | 80.8 | 10.47% | 5.60% | -41.81% | -15.13% | 34.67% |
| 9 | Charlotte, NC-SC | 80.6 | 9.97% | 6.78% | -43.57% | -15.16% | 13.84% |
| 10 | Houston, TX | 78.8 | 11.43% | 8.88% | -38.37% | -17.40% | 10.49% |
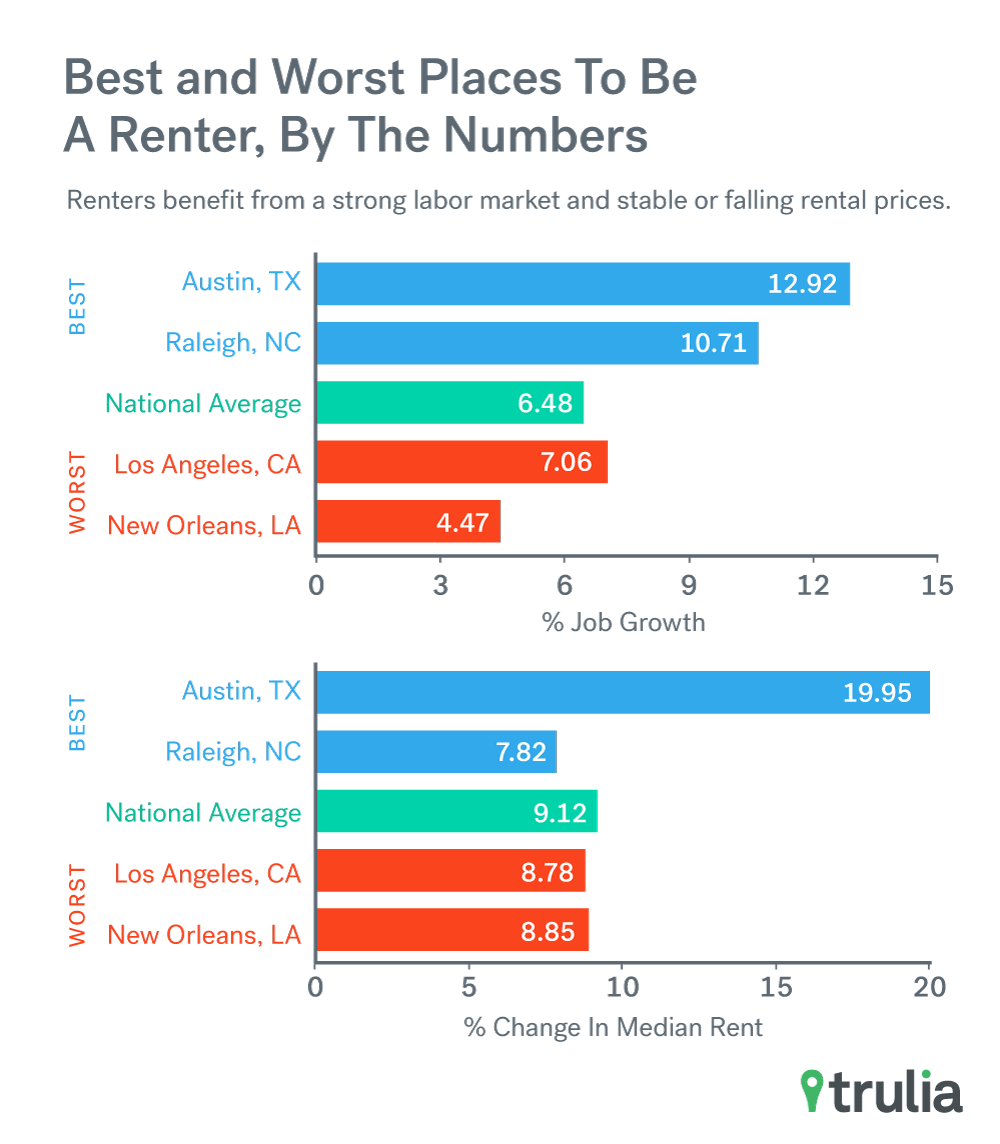
| Top 100 Metro Average | N/A | 6.48% | 5.51% | -32.56% | -7.88% | 17.68% | |
| Note: Among the 100 largest U.S. metros. To download the full dataset, click here. | |||||||
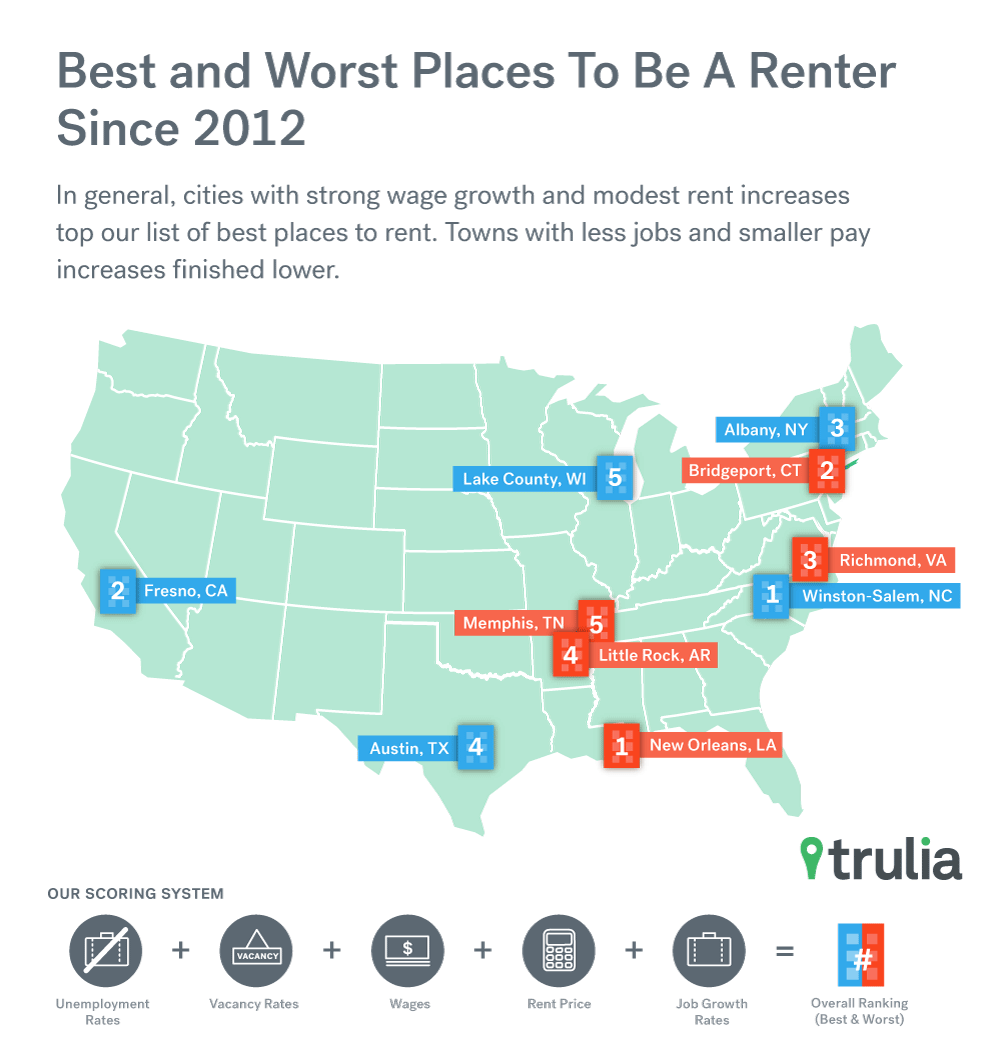
Rental markets are a different story. The things that make great ownership towns — rapid price appreciation and declining vacancy rates – tend to make them tougher places to rent. Rental markets need ample inventories and strong economies. Winston-Salem, N.C., despite having employment growth below the average 6.5%, has been the best city for renters based on its strong wage growth and modest rent increase during the past three years. Charlotte, and Raleigh both appear in the top 10 lists for owners and renters. While both have experienced rental price increases above the average of 9.2% in the comparison, and declining vacancy rates, these burdens have been fairly forgiving compared with other cities experiencing similarly steep drops in the unemployment rate and rising wages since 2012. Also, in Austin, Texas, despite experience rapid rental price appreciation, renters have benefited from strong job and wage growth, and a vacancy rate that has increased since 2012, though it is still a fairly tight market.
| Best Places To Rent Since The Housing Bottom | |||||||
| # | U.S. Metro | Renter Index | % Job Growth | % Change in Wages | % Change in Unemployment Rate | % Change in Vacancy Rate | % Change in Rent |
| 1 | Winston-Salem, NC | 72 | 4.23% | 6.37% | -43.16% | 3.09% | 5.05% |
| 2 | Fresno, CA | 69.2 | 7.21% | 4.64% | -32.06% | 33.86% | -0.49% |
| 3 | Albany, NY | 67.8 | 3.27% | 6.38% | -32.81% | 11.95% | 2.69% |
| 4 | Austin, TX | 66.6 | 12.92% | 5.53% | -39.17% | 17.78% | 19.95% |
| 5 | Kenosha, WI | 64 | 4.97% | 9.93% | -31.76% | 1.88% | 7.15% |
| 6 | Madison, WI | 63.8 | 4.75% | 7.52% | -32.25% | -9.13% | -0.04% |
| 7 | Fort Worth, TX | 63.4 | 8.62% | 6.66% | -36.11% | -6.04% | 7.85% |
| 8 | Greensboro, NC | 62.8 | 2.42% | 5.35% | -41.24% | 0.84% | 1.17% |
| 9 | Raleigh, NC | 62.8 | 10.71% | 6.72% | -41.01% | -21.03% | 7.82% |
| 10 | Charlotte, NC-SC | 62.2 | 9.97% | 6.78% | -43.57% | -15.16% | 12.37% |
| Top 100 Metro Average | N/A | 6.48% | 5.51% | -32.56% | -7.88% | 9.17% | |
| Note: Among the 100 largest U.S. metros. To download the full dataset, click here. | |||||||
On the flip side, New Orleans’ slower-than-average employment and wage growth combined with a falling vacancy rate and average rent growth have made for a fairly uncomfortable set of circumstances for renters. New Orleans made it through the recession relatively unscathed compared with other cities, as the area was still recovering from the effects of Hurricane Katrina. But as much of the rest of the country has recovered from job losses and continued to expand, employment growth in New Orleans has lagged behind. Manufacturing and construction sector job losses, partially spurred by low oil prices and declining oil and gas construction activity have offset some of the broad gains in the service providing sectors. Also on this list are Los Angeles and Washington D.C.; Los Angeles because of rising rents, slow wage growth, and a rapidly declining vacancy rate, and DC primarily because of uninspiring overall labor market improvements.
| Worst Places To Rent Since The Housing Bottom | |||||||
| # | U.S. Metro | Renter Index | % Job Growth | % Change in Wages | % Change in Unemployment Rate | % Change in Vacancy Rate | % Change in Rent |
| 1 | New Orleans, LA | 24 | 4.47% | 2.83% | -14.12% | -11.36% | 8.85% |
| 2 | Bridgeport, CT (Fairfield County, CT) |
32 | 3.81% | 0.83% | -24.44% | -3.86% | 7.10% |
| 3 | Richmond, VA | 33.4 | 4.32% | 3.85% | -26.04% | -12.14% | 7.16% |
| 4 | Little Rock, AR | 35 | 0.17% | 4.28% | -25.18% | 0.45% | 6.96% |
| 5 | Memphis, TN-MS-AR | 36.8 | 3.04% | 3.93% | -19.28% | -5.90% | 2.04% |
| 6 | Washington, DC | 37.8 | 2.05% | 3.51% | -19.13% | 6.42% | 4.81% |
| 7 | Gary, IN | 38 | 1.45% | 3.27% | -17.16% | 8.68% | 2.91% |
| 8 | Los Angeles, CA | 38.2 | 7.06% | 3.82% | -33.38% | -19.24% | 8.78% |
| 9 | Milwaukee, WI | 38.8 | 2.71% | 4.25% | -28.42% | 10.09% | 11.27% |
| 10 | Ventura County, CA | 39.2 | 4.61% | 2.74% | -36.50% | -7.67% | 8.39% |
| Top 100 Metro Average | N/A | 6.48% | 5.51% | -32.56% | -7.88% | 9.17% | |
| Note: Among the 100 largest U.S. metros. To download the full dataset, click here. | |||||||
Cities like Albuquerque, N.M.; Gary, Ind.; and Silver Spring, Md., were some of the worst places to own post-housing bottom. All of the cities on this list have performed below average on both labor market metrics and housing market metrics. In Albuquerque, for example, home of Sandia National Laboratory, Kirtland Air Force Base, and the University of New Mexico, the government sector comprises nearly 21% of all employment compared with 14% nationally. With tight state, local and federal budgets, a more robust employment expansion has been hampered since prior to 2012. In Gary, Ind., slow employment growth and net out migration during the past two years have kept home value appreciation to a minimum. Silver Spring on the other hand, has seen moderate price appreciation since 2012, but the vacancy rate has been climbing steadily and labor market improvements have been modest.
| Worst Places To Own Since The Housing Bottom | |||||||
| # | U.S. Metro | Owner Index | % Job Growth | % Change in Wages | % Change in Unemployment Rate | % Change in Vacancy Rate | % Change in Home Values |
| 1 | Albuquerque, NM | 6.4 | 1.24% | 2.40% | -17.98% | 4.75% | -5.11% |
| 2 | Gary, IN | 10.2 | 1.45% | 3.27% | -17.16% | 8.68% | 2.95% |
| 3 | Silver Spring, MD | 16 | 2.69% | 1.73% | -19.01% | 17.79% | 13.33% |
| 4 | Camden, NJ | 17.2 | 3.12% | 2.26% | -30.45% | 9.94% | -0.75% |
| 5 | Syracuse, NY | 19.2 | 0.43% | 4.61% | -30.06% | 6.29% | -1.19% |
| 6 | Little Rock, AR | 21.2 | 0.17% | 4.28% | -25.18% | 0.45% | 4.73% |
| 7 | New Haven, CT | 21.2 | 2.67% | 4.14% | -25.22% | -1.19% | -0.95% |
| 8 | Milwaukee, WI | 21.4 | 2.71% | 4.25% | -28.42% | 10.09% | 2.99% |
| 9 | Virginia Beach, VA-NC | 21.6 | 1.61% | 5.26% | -23.89% | 2.64% | 0.61% |
| 10 | El Paso, TX | 23 | 4.15% | 3.36% | -34.44% | 26.25% | -3.12% |
| Top 100 Metro Average | N/A | 6.48% | 5.51% | -32.56% | -7.88% | 17.68% | |
| Note: Among the 100 largest U.S. metros. To download the full dataset, click here. | |||||||
Additionally, since 2012, we expected to see some of the most favorable market conditions for new owners in the markets that were most impacted by the recession. That connection seems to be fairly weak though. Of the 10 cities that lost the most jobs as a percentage of their initial employment from 2008 to 2010, only West Palm Beach, FL also appears as a top place for owners. Northport, FL; Toledo, OH; and Detroit, MI; which all had lost more than 10% of their overall employment between 2008 and 2010, have not experienced the same rebound as much of the rest of the country. Rather than indicating a story of bust followed by recovery-driven boom, these indexes seem to show a picture of shifting fortunes.
Methodology
While both owners and renters can appreciate the benefits of improving labor market conditions, they likely have different ideas of what constitutes a favorable housing market. Owners are happiest when vacancy rates are declining and home values are on the rise. Renters have more leverage when vacancy rates are increasing and rent prices are flat or falling. But rising vacancy rates and falling rents are not often seen in areas with heady labor market fundamentals, and low rent and high vacancy rates don’t do you much good if you can’t find and keep a good job.
In the creation of our owner and renter indexes, we looked at several key metrics on the 100 largest U.S. metro areas. First, we combined three components of labor market data with vacancy and price metrics as a way to weight the importance of being able to find/keep a job in an area with increasing pay more heavily than housing availability and price appreciation. Wage, covered employment, and unemployment rate data were pulled from the Bureau of Labor and Statistics’ (BLS) Quarterly Census of Employment and Wages (QCEW) and Local Area Unemployment Statistics (LAUS) programs. The 4-quarter rolling average was taken for all the BLS metrics and then each metro was ranked and scored based on the percent change from the first quarter of 2012 to the first quarter of 2015, the most recent data available. To gauge changes in the vacancy rate of both the sales and rental housing market, the percent change in the United States Postal Service vacancy rate by metro was ranked and scored. For the rental index though, vacancy rate increases were treated as improvements, while in the owner index, vacancy rate decreases were treated as improvements.
Finally, the percent change in the Zillow Home Value Index (ZHVI) by metro was used to rank and score on price appreciation for the owner’s perspective, where larger price increases, were assigned better ranks & scores. For the renter’s perspective, the Zillow Rent Index (ZRI) was used to rank and score each metro on rental price appreciation, where larger price increases since 2012 were assigned worse ranks and scores.
An aggregated score and rank was then calculated for each metro for both the owner index and the renter index separately, resulting in the overall indexes discussed here.

