On April 26, the Trump Administration announced a new tax proposal that, among other things, would put many of the financial advantages of buying a home at risk.
While the proposal does not do away with the mortgage-interest tax deduction, it doubles the standard deduction and eliminates the ability of filers to deduct state and local taxes, including property taxes. While raising the standard deduction will undoubtedly put more dollars into the pockets of homeowners, it’s less clear how these changes affect the financial advantages of buying a home. We set out with our friends Prashant Gopal and Joe Light at Bloomberg to investigate who, where, and how these changes might affect the financial advantages of making the switch from renting to buying. You can read their story here.
We found that the tax plan’s biggest impact will be on:
- Who: homebuyers making between $68,540 and $129,422 looking to buy homes priced between $358,000 and $676,000.
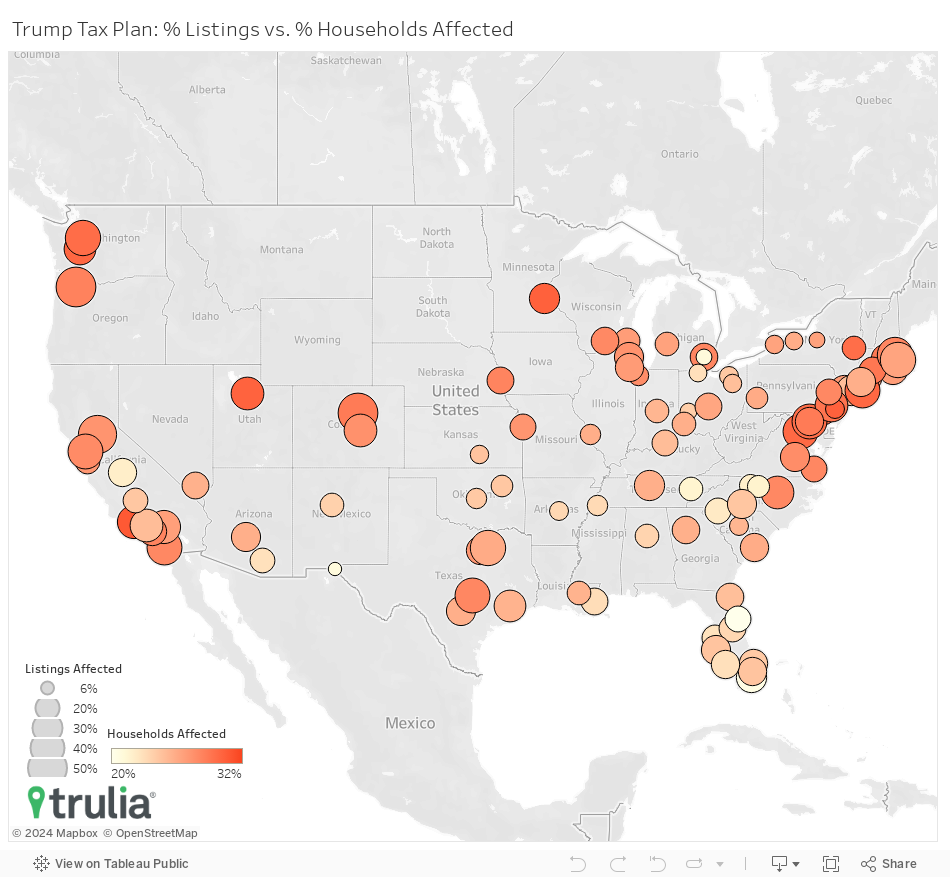
- Where: Portland, Ore., has the largest share of for-sale home listings potentially affected, while Honolulu has the largest share of households.
- How: The financial advantages of buying a home over renting would erode most in the broader New York metro area and in both major markets in Wisconsin.
Who
Currently, there are tax benefits for buying a home if the annual mortgage interest paid is greater than the current standard deduction of $12,700. Under Trump’s proposed tax reform, this would increase to $24,000. While this means that many households will be able to write an extra $11,300 off their income, raising the standard deduction will also lead to a scenario where some homebuyers would no longer take the mortgage-interest tax deduction (MITD) because the standard deduction would be greater.
For these buyers, the financial advantage of making the switch from renting to homeownership would be reduced. As it turns out, buyers most likely to be affected are middle-income American households making between $68,540 and $129,422 who are looking to purchase a home between $358,000 and $676,000 and who take out a mortgage between $322,200 and $608,400.
| Proposed Tax Reform Will Most Likely Affect Those Who: | |||
| Values | Have a mortgage balance of between: | Have a household income between: | Buy a home priced* between: |
| Minimum | $322,200 | $68,540 | $358,000 |
| Maximum | $608,400 | $129,422 | $676,000 |
| *Assumes a 10% down payment. |
The proposed tax reform will also push the benefits of the MITD further out of reach of the middle class. Under the current tax code, the top 43% of household earners can itemize their mortgage interest if they purchased a home. Under the proposed tax plan, that number would shrink to just the top 17%. Across the largest 100 metros, the share of households that would be able to take the MITD would fall most in Honolulu, moving from the top 55% of earners to the top 23% – a change of 32 percentage points. In the top 10 markets that would see the largest swings, more than 30 percentage-point fewer households would be able to take the deduction on a home purchase.
| Percentile of Household Earners Affected by Plan | |||
| Metro | Top __% of Households Eligible for MITD Under Current Code | Top __% of Households Eligible for MITD Under Proposed Code | Percentage-Point Change |
| United States | 43% | 17% | -26 |
| Honolulu, HI | 55% | 23% | -32 |
| Ventura County, CA | 56% | 25% | -31 |
| Minneapolis-St. Paul, MN | 46% | 15% | -31 |
| Camden, NJ | 52% | 21% | -31 |
| Salt Lake City, UT | 46% | 15% | -31 |
| Tacoma, WA | 46% | 15% | -31 |
| Washington, DC | 62% | 32% | -30 |
| Seattle, WA | 56% | 26% | -30 |
| Albany, NY | 44% | 14% | -30 |
| Madison, WI | 41% | 11% | -30 |
| NOTE: Among the 100 largest U.S. metro areas, full data available here. |
Where
Nationally, 21.7% of for-sale home listings on the market during the week the Trump Administration announced the proposal were priced between affected range of $358,000 and $676,000. This suggests that homebuyers of over a fifth of homes currently for sale might not be able take the MITD if the tax proposal passes.
When looking at the share of households who can afford those homes between $358,000 and $676,000 based on their household incomes, the number increases to 26%. However, these shares of listings and households who might not benefit from the MITD varies considerably across the largest U.S. housing markets.
| Markets with the Most Listings and Households Affected by Raising the Standard Deduction | |||
| U.S. Metro | % of Listings Affected | U.S. Metro | % of Households Affected |
| Portland, OR | 50.5% | Honolulu, HI | 31.9% |
| Denver, CO | 49.1% | Ventura County, CA | 30.7% |
| Sacramento, CA | 46.7% | Minneapolis-St. Paul, MN | 30.2% |
| Dallas, TX | 40.1% | Camden, NJ | 30.2% |
| Seattle, WA | 40.0% | Salt Lake City, UT | 30.1% |
| Boston, MA | 39.6% | Tacoma, WA | 29.9% |
| Cambridge-Newton-Framingham, MA | 39.2% | Long Island, NY | 29.8% |
| Washington, DC | 38.9% | Washington, DC | 29.8% |
| San Diego, CA | 38.8% | Seattle, WA | 29.5% |
| Long Island, NY | 37.4% | Albany, NY | 29.4% |
| NOTE: Among the 100 largest U.S. metro areas, full data available here. |
For example, buyers of near or more than half of the homes currently on the market in places in Portland, Denver, and Sacramento, Calif., may not benefit from the MITD if the tax reform passes. In the top 10 markets, no less than 37.4% would be at risk, which includes metros such as Seattle, Boston, Dallas, Texas, and Washington.
When looking at the share of potential homebuyers who might be affected given the home price range they can afford, nearly a third would be at risk of losing the MITD when buying home. A full 31.9% of homebuyers in Honolulu would be at risk, while 30.7% 30.2%, 30.2% of buyers in Ventura County, Calif., Minneapolis-St. Paul, and Camden, NJ, would be affected, respectively.
How
We also found that the proposal could have a significant impact on Americans’ decision to rent or buy. To shed light on this, we modified our rent vs. buy analysis to look at how the financial benefits of homebuying might be affected across the 100 largest U.S. metros. We calculated the numbers for three different house prices in the affected range (the minimum price, $358,000, the midpoint, $517,000, and the maximum price of $676,000) and for two scenarios: one where buyers would be able to take the MITD and property tax deduction, and one without. We then examined the difference between the two for each metro to find out how much it might impact buyers of these homes.
| How Raising the Standard Deduction Might Affect the Rent vs. Buy Decision: $358,000 Home | |||
| U.S. Metro | Rent vs. Buy Using Current Deduction | Rent vs. Buy Using Proposed Deduction | Percentage-Point Change |
| Madison, WI | -3.9% | 17.5% | +21.5 |
| Austin, TX | -20.0% | -0.8% | +19.1 |
| New Haven, CT | -17.1% | 0.8% | +17.9 |
| Detroit, MI | -20.9% | -3.2% | +17.7 |
| Lake County-Kenosha County, IL-WI | -19.9% | -2.2% | +17.7 |
| Camden, NJ | -22.7% | -5.2% | +17.6 |
| Salt Lake City, UT | -14.9% | 2.5% | +17.4 |
| Newark, NJ | -23.5% | -6.1% | +17.4 |
| Chicago, IL | -21.1% | -3.8% | +17.2 |
| Albuquerque, NM | -16.5% | 0.6% | +17.1 |
| NOTE: Assuming 10% down payment, staying in home for seven years, and a mortgage rate of 4.2%. Negatives numbers indicate it is cheaper to buy than rent. A negative percentage means homeownership is cheaper than renting. In Madison, Wis., it’s 3.9% cheaper to buy a home than to rent under the current standard deduction. Under the proposed tax plan, it becomes 17.5% more expensive to buy than to rent a home. |
At the lowest home price in the affected range, the proposed tax code changes swing our rent vs. buy metric from being cheaper to buy to becoming more expensive to buy a home in four markets: Madison, Wis., which moves from being 3.9% cheaper to 17.5% more expensive to buy; Salt Lake City, which moves from 14.9% cheaper to 2.5% more expensive; New Haven, Conn. moves from 17.1% cheaper to 0.8% more expensive; and Albuquerque, N.M., which swings from being 16.5% cheaper to 0.6% more expensive. What’s more, several markets make a swing from being a clear favorite for buying to being a wash with renting. For example, Austin, Detroit, Camden, N.J., and Chicago. move from being more than 20% cheaper to buy to being close enough to zero that homebuyers might be financially indifferent to homeownership.
| How Raising the Standard Deduction Might Affect the Rent vs. Buy Decision: $517,000 Home | |||
| U.S. Metro | Rent vs. Buy Using Current Deduction | Rent vs. Buy Using Proposed Deduction | Percentage Point Change |
| Newark, NJ | -6.0% | 15.8% | +21.8 |
| Madison, WI | -10.5% | 10.3% | +20.7 |
| Lake County-Kenosha County, IL-WI | -7.1% | 13.3% | +20.5 |
| New Haven, CT | -8.4% | 12.0% | +20.4 |
| Portland, OR | -13.5% | 6.3% | +19.8 |
| New York, NY | -15.0% | 4.5% | +19.5 |
| Chicago, IL | -12.7% | 6.9% | +19.5 |
| Long Island, NY | -21.9% | -2.7% | +19.1 |
| Salt Lake City, UT | -8.8% | 10.1% | +18.9 |
| Sacramento, CA | -15.6% | 3.3% | +18.9 |
| NOTE: Assuming 10% down payment, staying in home for seven years, and a mortgage rate of 4.2%. Negatives numbers indicate it is cheaper to buy than rent. A negative percentage means homeownership is cheaper than renting. In Newark, it’s 6% cheaper to buy a home than to rent under the current standard deduction. Under the proposed tax plan, it becomes 15.8% more expensive to buy than to rent a home. |
Last, we see the biggest impact at the highest price threshold of $676,000. The proposed tax code swings our rent-vs.-buy metric to being more expensive to buy from being cheaper to buy in 20 markets, including all New York metro divisions (New York, Newark, and Long Island, N.Y.), both Boston metro divisions (Boston and Cambridge, Mass.,), as well as both of the major metros in the Pacific Northwest (Seattle and Portland). We also see the most drastic swings at this price point. For example, Newark would experience a 25.9-percentage point swing from being 8.8% more expensive to buy to 34.7% more expensive to buy, while New York makes a 23.2 percentage point swing from being 3.7% cheaper to 19.4% more expensive.
| How Raising the Standard Deduction Might Affect the Rent vs. Buy Decision: $676,000 Home | |||
| U.S. Metro | Rent vs. Buy Using Current Deduction | Rent vs. Buy Using Proposed Deduction | Percentage Point Change |
| Newark, NJ | 8.8% | 34.7% | +25.9 |
| New York, NY | -3.7% | 19.4% | +23.2 |
| Long Island, NY | -12.8% | 8.7% | +21.4 |
| Seattle, WA | -15.2% | 6.2% | +21.4 |
| Portland, OR | -9.4% | 11.9% | +21.3 |
| Madison, WI | -12.0% | 9.2% | +21.2 |
| Cambridge–Newton–Framingham, MA | -8.3% | 12.6% | +20.9 |
| New Haven, CT | -10.7% | 9.6% | +20.3 |
| Lake County-Kenosha County, IL-WI | -9.4% | 10.5% | +19.9 |
| Boston, MA | -15.6% | 4.2% | +19.9 |
| NOTE: Assuming 10% down payment, staying in home for seven years, and a mortgage rate of 4.2%. Negatives numbers indicate it is cheaper to buy than rent. A negative percentage means homeownership is cheaper than renting. In Newark, it’s 6% cheaper to buy a home than to rent under the current standard deduction. Under the proposed tax plan, it becomes 15.8% more expensive to buy than to rent a home. |
The Big Picture
Do these findings mean that the housing market will be worse off under the proposed tax reform? We think not for three reasons. First, the loss of the MITD would be made up for by the much larger increase in the standard deduction, leading to more money in a household’s pocket at the end of the year. Though, as we’ve shown, the tax benefits of homeownership will erode for some, it might help increase the ability of renters to save up for the all elusive down payment. In turn, this could boost home buying activity in the long run. The critical point is how households spend their extra tax savings. If households put these savings into the housing market, the impact of the proposed tax plan may be minimal on housing demand. If they don’t, demand in some markets may see significant cooling. Second, mortgage interest and property taxes are not the only deduction that itemizers take, and other deductions, such as medical expenses and charitable contributions, may push household itemizations to be greater than proposed standard deduction. In this case, buying a home might help households write off more than the standard deduction, and thus the financial incentives wouldn’t erode much. Last, these proposed tax reforms are just that: proposed. These reforms must make it through Congress, so none of these changes are guaranteed.
Methodology
We derive our estimates of who would most be affected by the proposed plan by first calculating the mortgage balance, where the annual interest paid in the first year is between the current standard deduction ($12,600) and the proposed standard deduction ($24,000). We assume a 10% down payment and a 36% debt-to-income-ratio, and include property taxes, insurance, and mortgage insurance to calculate mortgage approval. Those with taking out a mortgage between $324,000 and $603,000 fit the bill. Next, we calculated the income a borrower would need to qualify for these loans. For the lesser amount, a borrower would need an income of $68,923; for the larger, an income of $128,273. Assuming a 10% down payment, this would translate into a purchase price of between $360,000 and $670,000.
To identify markets that are most likely to be affected by the proposed tax plan, we calculated two metrics: (1) the proportion of for-sale single-family homes, condos, townhomes, and coop listings on Trulia between $340,000 and $630,000 in the largest 100 metros from April 23 to April 29, 2017 (the week the plan was announced), and (2) the share of households that make between $49,880 and $92,424 in the largest 100 metros from the 2015 U.S. Census Bureau American Community Survey adjusted to 2017 dollars.
Last, we calculate the financial benefits of homeownership for the 100 largest metros using our rent vs. buy methodology, which can be found here. We amended our normal assumptions and assumed a 10% down payment, and calculated the metric for three different house prices in the affected purchase range (the minimum price, $340,000, the midpoint, $485,000, and the maximum price of $630,000) and for two scenarios: one where buyers would be able to take the MITD and property tax deduction, and one without. We then examined the difference between the two for each metro to find out how much it might impact these homebuyers. We calculated the associated rents for each of those price points by taking the median rental value from Trulia’s rental estimates of homes priced within $20,000 of those three prices.

