The Trulia Price Monitor and the Trulia Rent Monitor are the earliest leading indicators of how asking prices and rents are trending nationally and locally. They adjust for the changing mix of listed homes and therefore show what’s really happening to asking prices and rents. Because asking prices lead sales prices by approximately two or more months, the Monitors reveal trends before other price indexes do. With that, here’s the scoop on where prices and rents are headed.
Asking Prices Up 1.0% M-o-M in November, Regaining a Bit of Steam
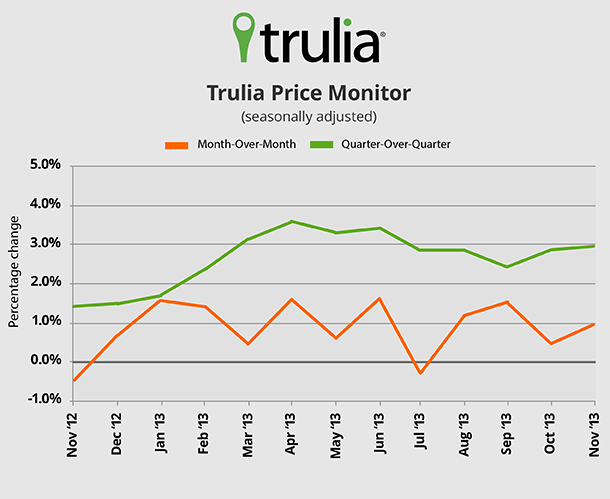
In November, asking home prices rose 1.0% month-over-month and 3.0% quarter-over-quarter. The quarterly increase is the fastest in five months, though still lower than in the spring. Year-over-year, prices are up 12.1% nationally and have increased in 98 of the 100 largest metros.
|
November 2013 Trulia Price Monitor Summary |
|||
|
% change in asking prices |
# of 100 largest metros with asking-price increases |
% change in asking prices, excluding foreclosures |
|
| Month-over-month,
seasonally adjusted |
1.0% |
Not reported |
0.6% |
| Quarter-over-quarter,
seasonally adjusted |
3.0% |
88 |
2.4% |
| Year-over-year |
12.1% |
98 |
11.9% |
| *Month-over-month change is November versus October. Quarter-over-quarter and year-over-year changes are three-month averages. Data from previous months are revised each month, so data being reported now for previous months might differ from previously reported data. | |||
Price Gains are Slowing Sharply in the Hottest Markets
Nationally, asking home prices are rising slower today than earlier this year. And it’s the local markets which had biggest year-over-year price rebounds that are experiencing the biggest price slowdown now. The slowdown – measured as the difference in the quarter-over-quarter price changes between November and August – was more than two percentage points in Las Vegas, Oakland, Detroit, Los Angeles, Atlanta, and Phoenix. In fact, the quarterly price change in November was below the quarterly price change in August in 18 of the 20 markets with the largest year-over-year increases, including all of the markets in the top 10.
|
Recent Price Changes in the 20 Hottest Markets |
|||||
| # | U.S. Metro |
Y-o-Y % change, Nov 2013 |
Q-o-Q % change, Nov 2013 |
Q-o-Q % change, Aug 2013 |
Price slowdown = Difference in Q-o-Q % change, November minus August |
| 1 | Sacramento, CA |
30.1% |
4.5% |
6.0% |
-1.5% |
| 2 | Las Vegas, NV |
28.2% |
1.9% |
8.9% |
-7.0% |
| 3 | Riverside–San Bernardino, CA |
28.2% |
5.8% |
7.3% |
-1.5% |
| 4 | Oakland, CA |
27.1% |
1.1% |
4.7% |
-3.6% |
| 5 | Warren–Troy–Farmington Hills, MI |
24.8% |
4.8% |
6.6% |
-1.8% |
| 6 | Bakersfield, CA |
24.2% |
5.6% |
6.1% |
-0.6% |
| 7 | Ventura County, CA |
24.1% |
3.9% |
5.7% |
-1.8% |
| 8 | Detroit, MI |
22.9% |
4.0% |
6.7% |
-2.6% |
| 9 | Orange County, CA |
22.7% |
3.2% |
4.7% |
-1.5% |
| 10 | Los Angeles, CA |
22.4% |
3.1% |
5.4% |
-2.2% |
| 11 | Fort Lauderdale, FL |
19.5% |
4.9% |
4.0% |
0.9% |
| 12 | Fresno, CA |
19.4% |
3.2% |
4.6% |
-1.4% |
| 13 | Orlando, FL |
19.4% |
4.4% |
4.8% |
-0.4% |
| 14 | San Diego, CA |
19.2% |
2.4% |
4.3% |
-1.9% |
| 15 | Atlanta, GA |
19.0% |
3.5% |
7.0% |
-3.5% |
| 16 | San Jose, CA |
17.6% |
2.6% |
3.1% |
-0.6% |
| 17 | Chicago, IL |
17.5% |
4.2% |
5.1% |
-0.9% |
| 18 | Phoenix, AZ |
17.1% |
1.9% |
4.5% |
-2.7% |
| 19 | Dallas, TX |
16.9% |
1.6% |
3.1% |
-1.6% |
| 20 | Cape Coral–Fort Myers, FL |
16.7% |
5.2% |
4.5% |
0.7% |
| *The final column equals the difference between the third and second data columns, but the numbers might not appear to add up due to rounding. To download the list of price changes for the largest metros: Excel or PDF. | |||||
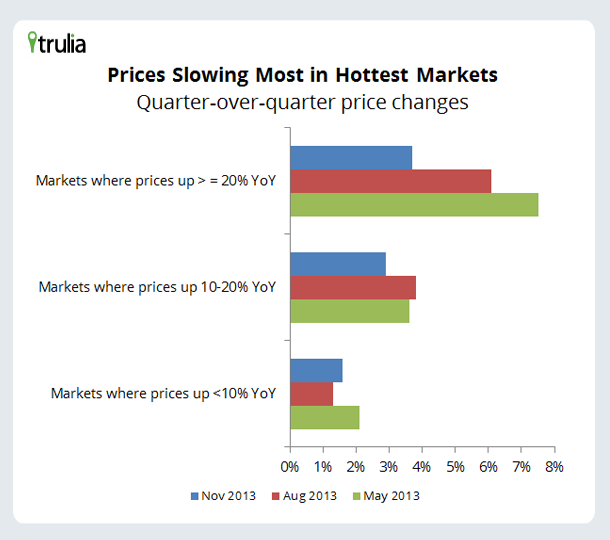
The price slowdown is sharp in the hottest metros but milder elsewhere. Among the 100 largest metros, the quarter-over-quarter price increase in the 10 metros where prices rose more than 20% year-over-year fell from 7.5% in May (six months ago) to 6.1% in August (three months ago) and to 3.7% in November. Prices are also slowing, though more modestly, in the 34 metros where prices rose between 10% and 20% year-over-year. But in the 56 markets where prices rose by less than 10% year-over-year, price gains actually accelerated in the most recent quarter, rising 1.6% quarter-over-quarter in November compared with 1.3% in August. Price gains are accelerating in Philadelphia, Pittsburgh, and Miami, for instance. Therefore, the price slowdown is really a sharp deceleration in price gains in the booming markets.
Rents Rising More Slowly Than Prices, Despite Price Slowdown
In November, rents rose 3.0% year-over-year nationally. Among the 25 largest rental markets, rents are rising fastest in San Francisco, Portland, and Seattle, while they’re falling slightly in Washington D.C. and Philadelphia. But even with the slowdown in asking prices, rent gains are being outpaced by price gains in all of the large rental markets. Even in San Francisco, where rents galloped ahead by 12.0% year-over-year, asking home prices rose faster, at 15.2%. With rents continuing to rise more slowly than prices, buying a home is becoming less affordable relative to renting.
|
Rent and Price Trends in the 25 Largest Rental Markets |
|||
| # | U.S. Metro |
Y-o-Y % change in rents, Nov 2013 |
Y-o-Y % change in asking home prices, Nov 2013 |
| 1 | San Francisco, CA |
12.0% |
15.2% |
| 2 | Portland, OR-WA |
10.0% |
16.3% |
| 3 | Seattle, WA |
9.8% |
14.9% |
| 4 | San Diego, CA |
9.6% |
19.2% |
| 5 | Miami, FL |
7.3% |
15.1% |
| 6 | Denver, CO |
5.6% |
9.4% |
| 7 | Houston, TX |
5.2% |
15.5% |
| 8 | Phoenix, AZ |
5.1% |
17.1% |
| 9 | Dallas, TX |
4.9% |
16.9% |
| 10 | Atlanta, GA |
4.2% |
19.0% |
| 11 | Chicago, IL |
4.0% |
17.5% |
| 12 | Orange County, CA |
3.5% |
22.7% |
| 13 | Riverside–San Bernardino, CA |
3.3% |
28.2% |
| 14 | St. Louis, MO-IL |
3.2% |
10.2% |
| 15 | New York, NY-NJ |
3.0% |
6.5% |
| 16 | Los Angeles, CA |
2.8% |
22.4% |
| 17 | Minneapolis–St. Paul, MN-WI |
2.6% |
10.8% |
| 18 | Tampa–St. Petersburg, FL |
2.2% |
13.6% |
| 19 | Sacramento, CA |
2.1% |
30.1% |
| 20 | Las Vegas, NV |
1.6% |
28.2% |
| 21 | Oakland, CA |
1.5% |
27.1% |
| 22 | Boston, MA |
1.4% |
9.5% |
| 23 | Baltimore, MD |
0.3% |
7.7% |
| 24 | Philadelphia, PA |
-1.2% |
5.1% |
| 25 | Washington, DC-VA-MD-WV |
-1.6% |
8.1% |
| To download the list of rent changes for the largest metros: Excel or PDF. | |||
The next Trulia Price Monitor and Trulia Rent Monitor will be released on Thursday, January 9.
How did we put this report together? To recap the methodology, the Trulia Price Monitor and the Trulia Rent Monitor track asking home prices and rents on a monthly basis, adjusting for the changing composition of listed homes, including foreclosures provided by RealtyTrac. The Trulia Price Monitor also accounts for the regular seasonal fluctuations in asking prices in order to reveal the underlying trend in prices. The Monitors can detect price movements at least three months before the major sales-price indexes do. Historical data are sometimes revised each month, and historical data in the current release are the best comparison with current data. Our FAQs provide all the technical details.


