The Trulia Price Monitor and the Trulia Rent Monitor are the earliest leading indicators of how asking prices and rents are trending nationally and locally. They adjust for the changing mix of listed homes and therefore show what’s really happening to asking prices and rents. Because asking prices lead sales prices by approximately two or more months, the Monitors reveal trends before other price indexes do. With that, here’s the scoop on where prices and rents are headed.
National Year-Over-Year Price Gain Slips to 8.0%
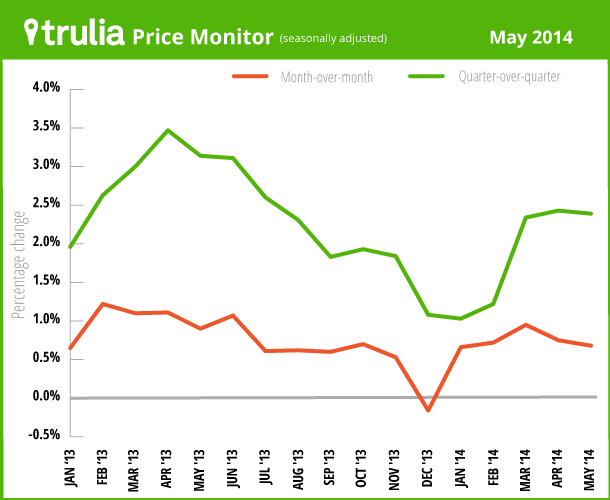
Asking home prices rose at their slowest rate in 13 months, rising just 8.0% year-over-year (7.2% excluding foreclosures). Although this year-over-year increase is slower than in previous months, an 8.0% increase is still far above the long-term historical norm for home-price appreciation. Furthermore, prices continue to climb in the most recent quarter: the 2.4% quarter-over-quarter increase in May 2014 is equivalent to 9.9% on an annualized basis. Finally, price gains continue to be widespread, with 93 of the 100 largest metros clocking quarter-over-quarter price increases, seasonally adjusted.

| May 2014 Trulia Price Monitor Summary | |||
| % change in asking prices | # of 100 largest metros with asking-price increases | % change in asking prices, excluding foreclosures | |
| Month-over-month, seasonally adjusted | 0.7% | Not reported | 0.5% |
| Quarter-over-quarter, seasonally adjusted | 2.4% | 93 | 2.2% |
| Year-over-year | 8.0% | 96 | 7.2% |
| *Data from previous months are revised each month, so data being reported now for previous months might differ from previously reported data. | |||
No More 20% Year-Over-Year Price Gains – Not Even in the West
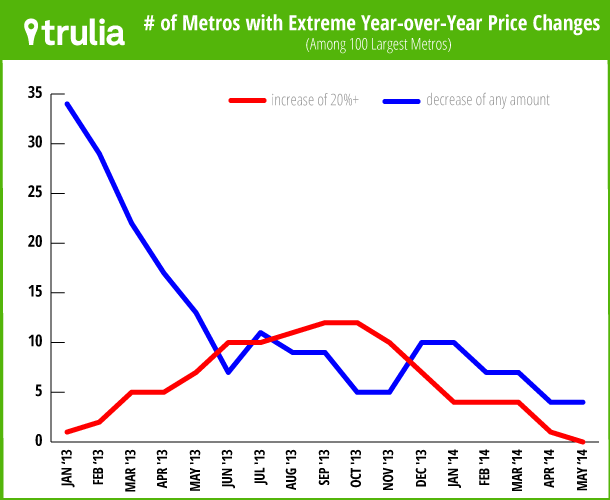
Nationally, asking home prices are rising slower than in previous months, but the real change has been the price slowdown in the hyper-rebounding markets of the West. In May 2014, none of the 100 largest metros had a year-over-year price gain of more than 20%; the steepest increase was 18.8%, in Riverside-San Bernardino. Among the markets with the biggest price gains today, three – Las Vegas, Sacramento, and Oakland – have had significant slowdowns in year-over-year gains, from around 30% in May 2013 to around 15% in May 2014. In contrast, price gains accelerated dramatically in Chicago, up 13.5% year-over-year in May 2014 versus just 3.6% in May 2013. Overall, half of the top 10 markets with the largest price gains are outside the West, another big change from last year when almost all of the biggest price increases were in the West.
| Where Asking Prices Rose Most Year-over-Year, May 2014 | ||||
| # | U.S. Metro | Y-o-Y % asking price change, May 2014 | Y-o-Y % asking price change, May 2013 | Difference in Y-o-Y % asking price changes, 2014 vs. 2013 |
| 1 | Riverside–San Bernardino, CA | 18.8% | 20.8% | -2.0%< |
| 2 | Bakersfield, CA | 16.0% | 18.3% | -2.3% |
| 3 | Atlanta, GA | 15.6% | 13.3% | 2.3% |
| 4 | Detroit, MI | 15.2% | 15.0% | 0.2% |
| 5 | Las Vegas, NV | 15.2% | 32.2% | -17.0% |
| 6 | Sacramento, CA | 15.1% | 28.8% | -13.8% |
| 7 | Oakland, CA | 14.8% | 32.4% | -17.5% |
| 8 | Miami, FL | 13.7% | 14.5% | -0.8% |
| 9 | Chicago, IL | 13.5% | 3.6% | 9.9% |
| 10 | Lake County–Kenosha County, IL-WI | 13.3% | 2.4% | 10.9% |
| Note: Among 100 largest metros. Differences were calculated before rounding; rounded differences might not equal the difference in the rounded values. To download the list of asking home price changes for the 100 largest metros: Excel or PDF | ||||
For the first time since July 2012, none of the 100 largest metros experienced a 20% gain in home prices, down from a peak of 12 metros in September and October 2013 (see chart below). The price slowdown has been especially sharp in Phoenix, where prices were up 25% year-over-year in May 2013 but rose just 8% year-over-year in May 2014, as well as in Las Vegas, Sacramento, and Oakland, as shown above.

At the same time, the number of housing markets where prices fell year-over-year is also at a post-recession low. In fact, asking home prices are down year-over-year in only four metros – El Paso, Hartford, Albany, and Little Rock. That means that the national price slowdown has NOT pushed more markets into price declines. Rather, the price slowdown has meant a deceleration in the booming markets where prices had been rising unsustainably fast.
As a result, there are fewer extreme markets with either huge price increases of 20% or with price declines. That’s a good thing. Extreme price increases create unrealistic expectations, encourage flipping, and might discourage some owners from selling if they expect big increases to continue; at the same time, price declines push people into negative equity, raising the risk of default and foreclosure. Today, with no markets seeing price gains of more than 20% and only four markets seeing price declines, home price changes are looking more balanced, sustainable, and widespread than at any point since the price recovery began.
Rent Growth Speeding Up in Most Markets
Rents are up 5.1% year-over-year nationally, with apartment rents up 5.8% and single-family rents up 2.1%. Among the 25 largest rental markets, rents rose most year-over-year in San Francisco, San Diego, and Oakland. Metro San Francisco also has the highest median rent for a 2-bedroom, $3,550,
just ahead of metro New York.
Rent growth has accelerated in the last quarter. The change in rents year-over-year was higher in May 2014 than in February 2014 in 21 of the 25 large rental markets. In fact, rents rose year-over-year in all 25 markets in May.
| Rent Trends in the 25 Largest Rental Markets | ||||
| # | U.S. Metro | Y-o-Y % change in rents, May 2014 | Y-o-Y % change in rents, Feb 2014 | Median rent for 2-bedroom |
| 1 | San Francisco, CA | 15.6% | 13.8% | $3,550 |
| 2 | San Diego, CA | 11.3% | 8.9% | $2,000 |
| 3 | Oakland, CA | 10.8% | 6.9% | $2,450 |
| 4 | Denver, CO | 10.6% | 9.2% | $1,500 |
| 5 | Atlanta, GA | 8.8% | 7.2% | $1,150 |
| 6 | Miami, FL | 8.7% | 5.8% | $2,400 |
| 7 | Seattle, WA | 8.6% | 9.8% | $1,800 |
| 8 | Sacramento, CA | 8.4% | 2.6% | $1,200 |
| 9 | Baltimore, MD | 7.4% | 2.4% | $1,600 |
| 10 | Phoenix, AZ | 6.8% | 6.4% | $1,050 |
| 11 | Chicago, IL | 6.2% | 3.7% | $1,600 |
| 12 | St. Louis, MO-IL | 6.0% | -0.1% | $1,000 |
| 13 | Los Angeles, CA | 5.7% | 3.3% | $2,350 |
| 14 | New York, NY-NJ | 5.5% | 3.4% | $3,500 |
| 15 | Philadelphia, PA | 5.1% | -0.4% | $1,550 |
| 16 | Riverside–San Bernardino, CA | 5.1% | 3.3% | $1,550 |
| 17 | Portland, OR-WA | 4.7% | 9.6% | $1,250 |
| 18 | Dallas, TX | 4.3% | 3.7% | $1,400 |
| 19 | Tampa–St. Petersburg, FL | 3.9% | 2.5% | $1,100 |
| 20 | Houston, TX | 3.7% | 3.8% | $1,450 |
| 21 | Boston, MA | 3.6% | 0.9% | $2,350 |
| 22 | Minneapolis–St. Paul, MN-WI | 3.5% | 2.9% | $1,300 |
| 23 | Las Vegas, NV | 3.2% | 0.6% | $950 |
| 24 | Orange County, CA | 3.1% | 4.1% | $2,000 |
| 25 | Washington, DC-VA-MD-WV | 1.5% | -1.3% | $2,150 |
| To download the list of rent changes for the largest metros: Excel or PDF | ||||
The next Trulia Price Monitor and Trulia Rent Monitor will be released on Thursday, July 10.
How did we put this report together? To recap the methodology, the Trulia Price Monitor and the Trulia Rent Monitor track asking home prices and rents on a monthly basis, adjusting for the changing composition of listed homes, including foreclosures provided by RealtyTrac. The Trulia Price Monitor also accounts for the regular seasonal fluctuations in asking prices in order to reveal the underlying trend in prices. The Monitors can detect price movements at least three months before the major sales-price indexes do. Historical data are sometimes revised each month, and historical data in the current release are the best comparison with current data. Our FAQs provide all the technical details.

