The Trulia Price Monitor and the Trulia Rent Monitor are the earliest leading indicators of how asking prices and rents are trending nationally and locally. They adjust for the changing mix of listed homes and therefore show what’s really happening to asking prices and rents. Because asking prices lead sales prices by approximately two or more months, the Monitors reveal trends before other price indexes do. With that, here’s the scoop on where prices and rents are headed.
Most Markets Now Have Year-Over-Year Price Increases
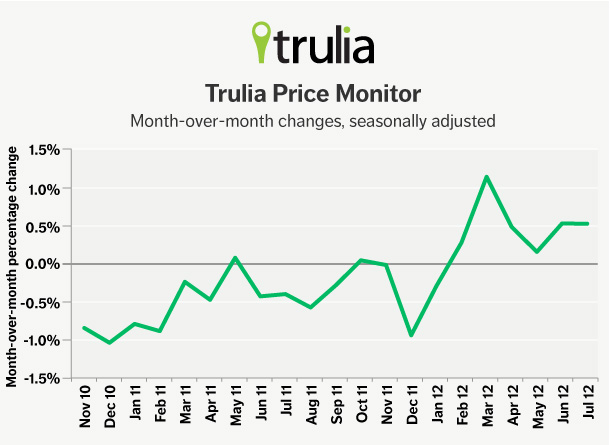
Asking prices were up once again month over month in July, by 0.5%. Asking prices have moved up six straight months since February (the May number was revised slightly upward). This means that the sales price gains starting to be reported by Case-Shiller and other indexes should continue throughout the year. The year-over-year price change is positive, at 1.1%; excluding foreclosures, prices are up 2.7% year over year. For the first time, the majority of large metros (62 out of 100) had year-over-year gains, and a strong majority (84 out of 100) had quarter-over-quarter gains.
|
July 2012 Trulia Price Monitor Summary |
|||
| % change in asking prices | # of 100 largest metros with asking-price increases | % change in asking prices, excluding foreclosures | |
| Month-over-month, seasonally adjusted | 0.5% | (not reported) | 0.9% |
| Quarter-over-quarter, seasonally adjusted | 1.2% | 84 | 2.3% |
| Year-over-year | 1.1% | 62 | 2.7% |
Look Who Made the Top Ten: Hello, Las Vegas; Goodbye, Miami
Housing prices have turned around in the past year. Last July, asking prices nationally were falling; in October they stabilized; and since February have been rising. A lot has happened in this turnaround year.
When we look at year-over-year changes in prices, we see the total effect of a year that had ups and downs. The top price gainers for the full year (July 2011 to July 2012) were Phoenix, Cape Coral – Fort Myers FL and Miami. Two other Florida metros – West Palm Beach and Orlando – are among the ten metros with the largest year-over-year increases.
|
Metros with Largest Year-over-year Asking Price Increases |
||
| # | U.S. Metro | Year-over-year: % change in asking prices |
| 1 | Phoenix, AZ |
21.6% |
| 2 | Cape Coral–Fort Myers, FL |
15.9% |
| 3 | Miami, FL |
15.1% |
| 4 | West Palm Beach, FL |
10.3% |
| 5 | Denver, CO |
8.6% |
| 6 | San Jose, CA |
8.0% |
| 7 | Warren–Troy–Farmington Hills, MI |
7.9% |
| 8 | Orlando, FL |
7.1% |
| 9 | Little Rock, AR |
6.5% |
| 10 | Omaha, NE-IA |
5.5% |
Click here to get a PDF of the asking home price changes for the largest U.S. metros.
But when we focus only on the most recent quarter, the list looks very different. Two Southwestern metros – Tucson and Las Vegas – join Phoenix, while Oakland and San Francisco join next-door San Jose in the top ten. Finally, Baton Rouge, Birmingham and Cleveland round out the newcomers on the list.
Who’s missing? Florida. NONE of the four Florida metros with the biggest year-over-year gains is on the top ten list for the most recent quarter. That means their year-over-year gains happened mostly before this quarter, and in the coming months they’ll be dropping off the list of metros with the largest year-over-year asking price increases. Comparing year-over-year gains with the most recent quarter-over-quarter gains, it’s clear that the housing price recovery has shifted from Florida to Arizona, California and Nevada.
|
Metros with Largest Quarter-over-quarter Asking Price Increases |
||
| # | U.S. Metro | Quarter-over-quarter: % change in asking prices |
| 1 | Tucson, AZ |
5.7% |
| 2 | San Jose, CA |
5.5% |
| 3 | Phoenix, AZ |
5.4% |
| 4 | Baton Rouge, LA |
5.2% |
| 5 | Birmingham, AL |
5.1% |
| 6 | Omaha, NE-IA |
4.6% |
| 7 | Cleveland, OH |
4.6% |
| 8 | Las Vegas, NV |
4.5% |
| 9 | Oakland, CA |
4.5% |
| 10 | San Francisco, CA |
4.1% |
Click here to get a PDF of the asking home price changes for the largest U.S. metros.
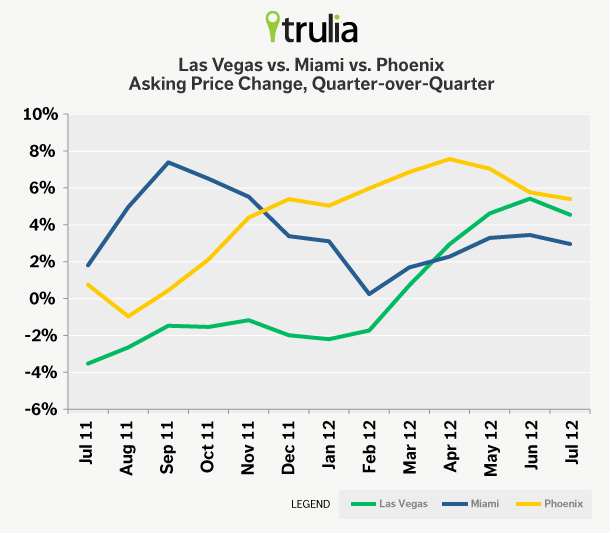
The chart below takes a closer look at Miami, Las Vegas and Phoenix. Big price increases came to Miami last fall, to Phoenix in the winter, and to Las Vegas only recently. (Remember ALL of our quarter-over-quarter changes are seasonally adjusted individually for each metro because seasonal patterns differ across the country.) For much of the last year, home prices rose sharply in Miami but fell in Las Vegas. Now the tables have turned. Gains in Las Vegas home prices have jumped ahead of Miami.
Why have the biggest price gains shifted away from Florida? One reason is job growth, which drives home price growth. San Francisco, San Jose and even Las Vegas have had strong job growth in the past quarter. Also, the hardest-hit metros during the bust are no longer getting the lift they had been enjoying: investors, including foreign homebuyers, found bargains in Florida a year ago, but Florida’s price gains over the past year make its housing less attractive to investors today. Finally, the declining vacancy rate in Las Vegas is boosting prices as buyers have fewer homes to choose from and sellers have less competition; only San Jose, where prices are also rising, saw a larger drop in vacancies.
However, the biggest lesson from these changing rankings is that no price increase is forever. What goes up must come down. Price declines attract homebuyers, who then bid prices up; price increases trigger new construction and expand supply, which then pushes prices back down. Prices can shift quickly, even though other measures of the housing market – like construction and the vacancy rate – change much more slowly.
Remember that we’re looking at asking prices for the most recent quarter. Since the Trulia Price Monitor reports price trends that are happening now, this westward shift in the home-price recovery hasn’t fully shown up on the main sales-price indexes yet – but they will.
Rents Continue their Climb
Finally, rents are still rising even faster than asking prices. Nationally, rents rose 5.3% year over year – well ahead of the 1.1% year-over-year increase in asking prices. Rents increased year over year in 24 of the 25 largest rental markets, and rose faster than home prices in 21 of those 25. Rents fell only in Las Vegas, and only by 1.4%. In six major markets, rents increased by more than 10% year over year, with San Francisco clocking the largest increase at 12.4%. To put this into perspective, only two large rental markets had year-over-year rent increases of 10% or more three months ago. What’s behind these rising rents? Markets with the largest rent increases tend to have low vacancy rates and strong job growth.
|
Metros with Largest Rent Increases |
|||
| # | U.S. Metro | % change in asking rents, year-over-year, July 2012 | % change in asking rents, year-over-year, April 2012 |
| 1 | San Francisco, CA |
12.4% |
12.9% |
| 2 | Miami, FL |
11.3% |
10.7% |
| 3 | Oakland, CA |
11.1% |
8.4% |
| 4 | Denver, CO |
10.5% |
9.2% |
| 5 | Seattle, WA |
10.2% |
8.8% |
| 6 | Boston, MA |
10.1% |
9.0% |
| 7 | Portland, OR-WA |
9.0% |
5.7% |
| 8 | Houston, TX |
8.5% |
6.5% |
| 9 | Philadelphia, PA |
8.2% |
1.9% |
| 10 | New York, NY-NJ |
6.2% |
5.8% |
Among the 25 largest rental markets. Click here to get a PDF of the rent changes for the largest U.S. metros.
That’s all for July. We’ll report on August price and rent trends on Wednesday, September 5, 2012 at 10AM ET.
How did we put this report together? To recap the methodology, the Trulia Price Monitor and the Trulia Rent Monitor track asking home prices and rents on a monthly basis, adjusting for the changing composition of listed homes, including foreclosures provided by RealtyTrac. The Trulia Price Monitor also accounts for the regular seasonal fluctuations in asking prices in order to reveal the underlying trend in prices. The Monitors can detect price movements at least three months before the major sales-price indexes do. Our FAQs provide all the technical details.


