At Trulia, we work hard to help you find the best place to live and we’ve been exploring the seedy underworld of crime, so that you don’t accidentally buy a home and move to the bad part of town.
Last year, we brought our Crime Maps to life, which illustrated where crime happens in 50 U.S. counties and later did an investigation into when crime happens. Most recently, we launched Trulia Local which expanded the coverage of our original Crime Maps across the entire country (while also providing insights on schools and neighborhood amenities) to help house hunters answer the question: “What’s it like to live here?”
What we’ve done up to this point for our heat maps is show you crime density — that is, where are the areas with the most crimes? As you can see in San Francisco, there’s a lot of action in the Tenderloin, some in the Mission and Downtown, and not much elsewhere. Given the Tenderloin’s reputation, most people (who think they know the the city) would say that sounds about right.
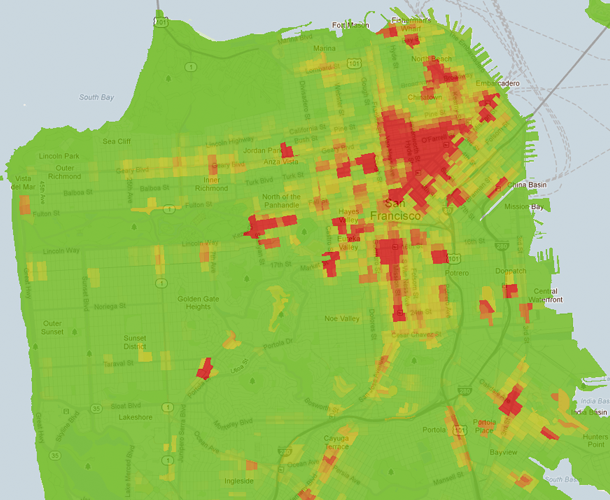
But is it right? Ask any native San Franciscans and they’ll probably balk and say, “what about Hunters Point?” (FYI, this neighborhood has a notorious reputation. In fact, the NY Times described it as being “one of the city’s most violent neighborhoods.”)
Well as it turns out, Hunters Point, which is located in the southeast part of San Francisco, doesn’t experience a ton of crime — but when it does happen, they’re violent: fights, shootings and assaults.
So to illustrate where these violent crimes happen, we’ve added a new mode on our Crime Maps which allows you to view the ratio of violent-to-nonviolent crimes. Here, we count crimes such as shootings and assaults as “violent” while petty crimes such as vandalism or theft are “nonviolent.”
Using this map, let’s look at San Francisco again. If you ask us, the Tenderloin doesn’t look that bad…at least in this light, but Hunter’s Point is looking like quite the danger zone.
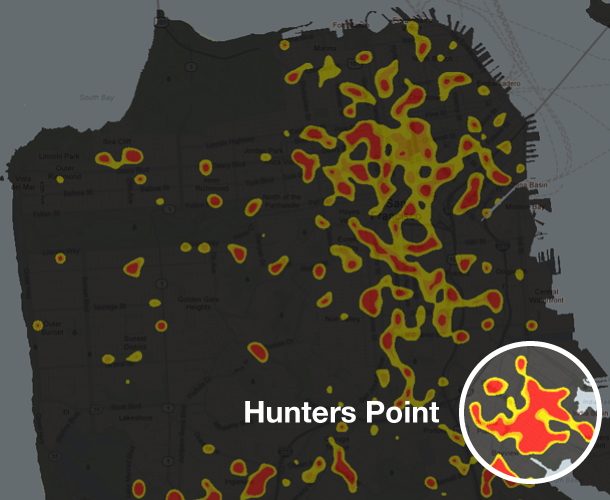
By flipping between our old heat map and our new one, you can now get a sense of which neighborhoods have a lot of reported crime and which have a high proportion of violent crime — and both are useful and necessary when you’re looking to rent or buy a home.
The Seedy Suburbs of Chicago
To show you what we mean, let’s do a deeper dive into Chicago’s Chicago crime scene.
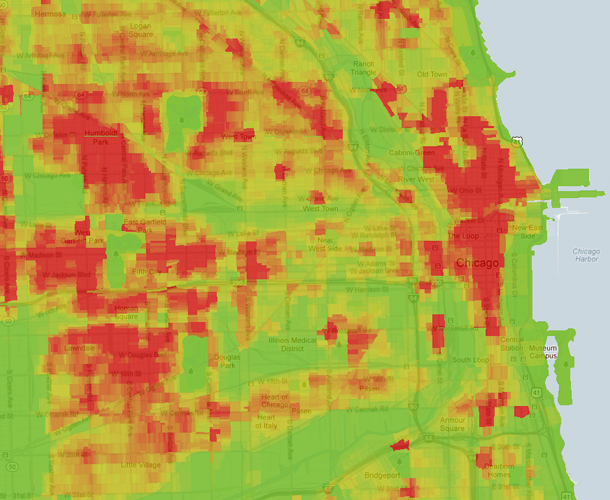
When you look at the city through our Crime Maps, there is a lot of crimes being reported downtown along the Chicago River in theLoop and Near North Side as well as pockets of crime in the suburbs.
Let’s talk about what’s happening downtown first. As most locals will tell you, this is a pretty affluent part of the city…so why does it look so shady? To figure this out, we took a closer look at the specific crimes being report and the answer was clear. This area is a prime target for thieves who are looking to rob department stores and cars, and few of these crimes are considered violent.
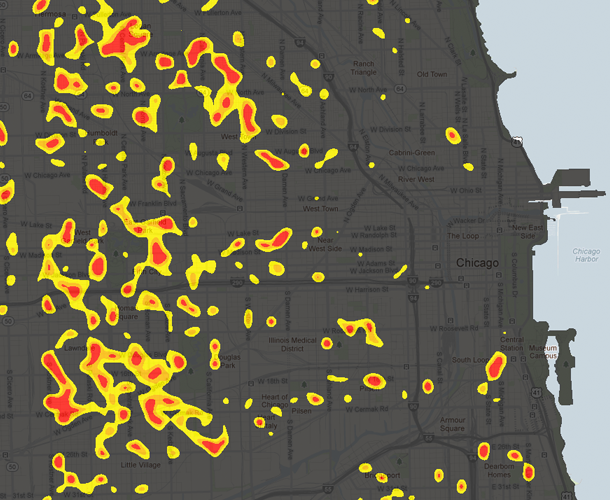
Now, let’s talk about the suburbs as we turn our attention to the violent crimes map of Chicago. When we look specifically at where there’s a higher proportion of violent crimes, Chicago’s downtown area seems really tame. Where you really need to watch your back is in the suburbs outside the city – which is where there seems to be a lot of crime in general. Dun, dun, dun…..
Party Rocking Crime in Berkeley
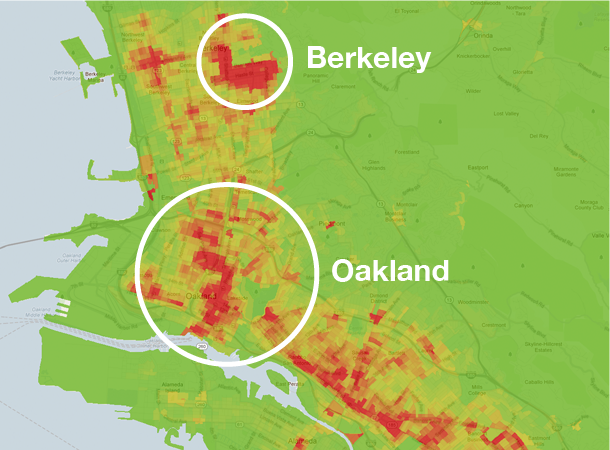
Here’s another example using the UC Berkeley campus. Compared to Oakland, which has a nationally-recognized reputation for being a dangerous place to live, Berkeley looks much worse – especially in the blocks surrounding the university. Something seems off, don’t you think?
Just as we did in Chicago, when we looked at the specific crimes being reported, we realized that almost all of the incidents are related to partying as opposed to assaults. And if you’re familiar with the layout of the campus, this actually makes a lot of sense as the “trouble” areas are along Frat Row and the dorms.
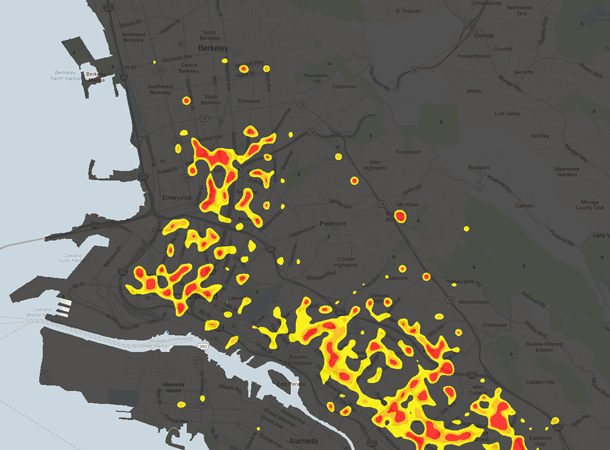
Where students should actually avoid is West and East Oakland. Looking at this same area through our violent heat map, Berkeleyalmost disappears. Clearly, the neighborhoods to the west of the I-580 freeway is where the real danger lurks and is what gives Oakland a bad name. Where it’s safer is up in the hills, past Lake Merritt and most definitely if you’re in Piedmont (a tiny city surrounded by Oakland that’s made up of 1.7 square mile of land).
Anyways. This is a very new feature we’re rolling out, and though we’re normalizing across the approximately 500 counties with crime data, we’re bound to have missed things. We know that safety is a huge factor in figuring out where to live, and we feel like we’re just scratching the surface with what’s possible. Please contact us with your comments, questions, or suggestions!
Side Note: Special thanks to Michal Migurski at Stamen for doing a lot of the early experimentation that’s driven how we’ve approached these heat maps. And if you’re skimming this post looking for words like Python, Tilestache, or PIL, you should probably just come work with us.

