Ghosts. Goblins. Ghouls. Mortgage Rates. Which should homebuyers be most scared of this fall? Only the ones starting with G. While the Federal Reserve Bank will likely increase interest rates later this year, rates would have to turn sharply higher to push the rent vs. buy decision towards renting. In fact, nationally and in the 100 largest markets, rising home prices are more likely to have an impact on homebuyers’ bottom line than increasing rates. In this edition of Trulia’s Rent vs. Buy report, we look at where, and by how much, rates and prices would have to increase to erase the financial benefits of homeownership. We find that:
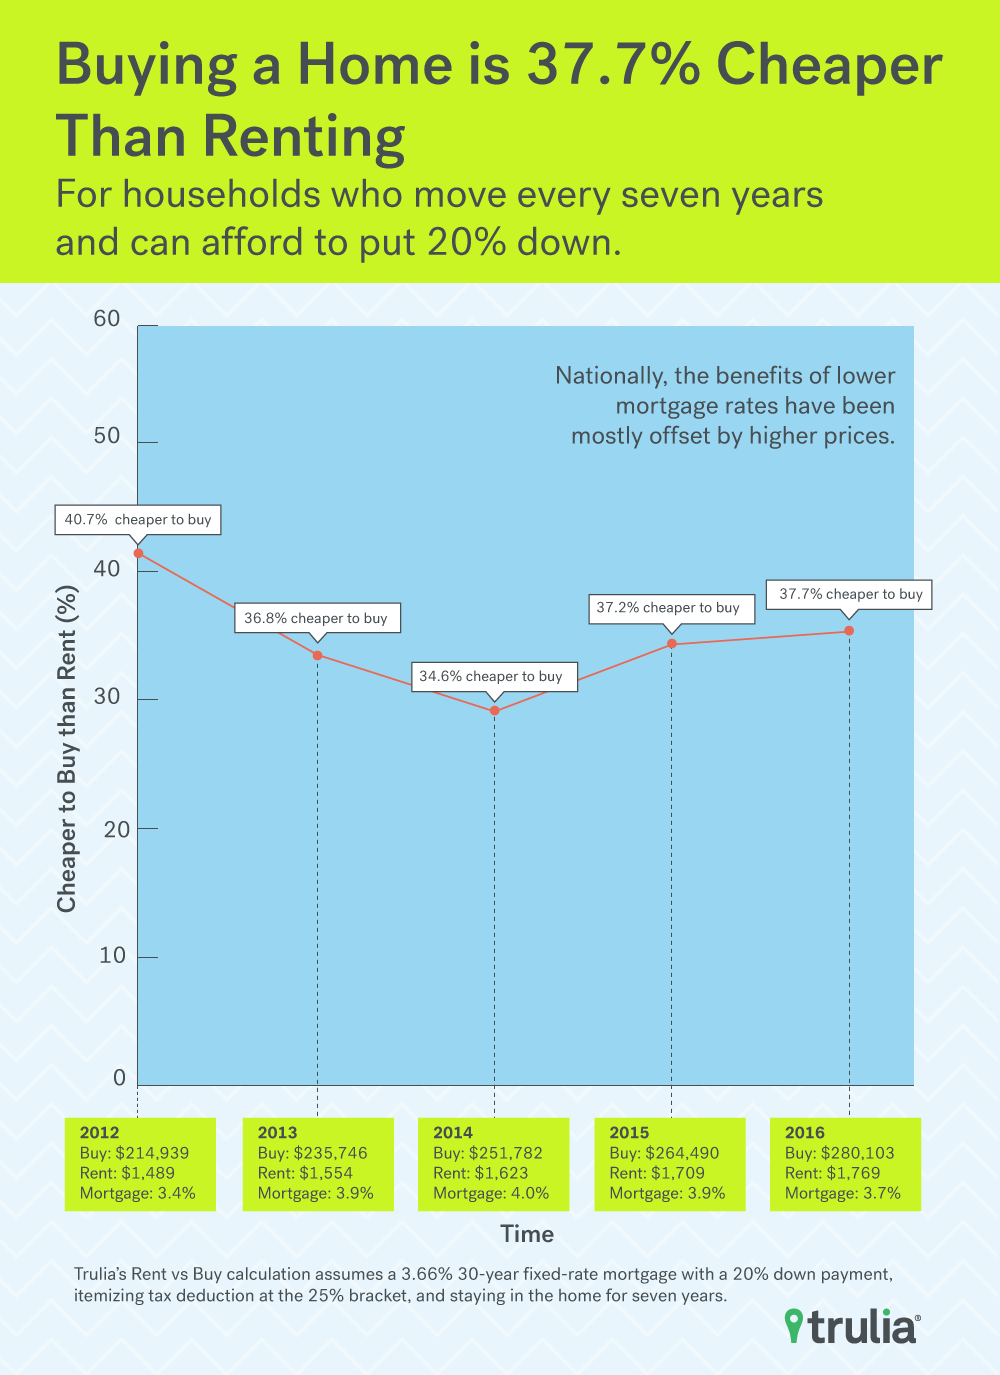
- Nationally, the benefits of lower mortgage rates have been mostly offset by higher prices. For households who move every seven years and can afford to put 20% down, it’s 37.7% cheaper to buy this year. This up just slightly compared to 37.2% last year.
- Buying is cheaper than renting in each of the 100 largest metros. The range is from over 50% cheaper in Miami and Fort Lauderdale, Fla., to under 20% in Honolulu and San Francisco.
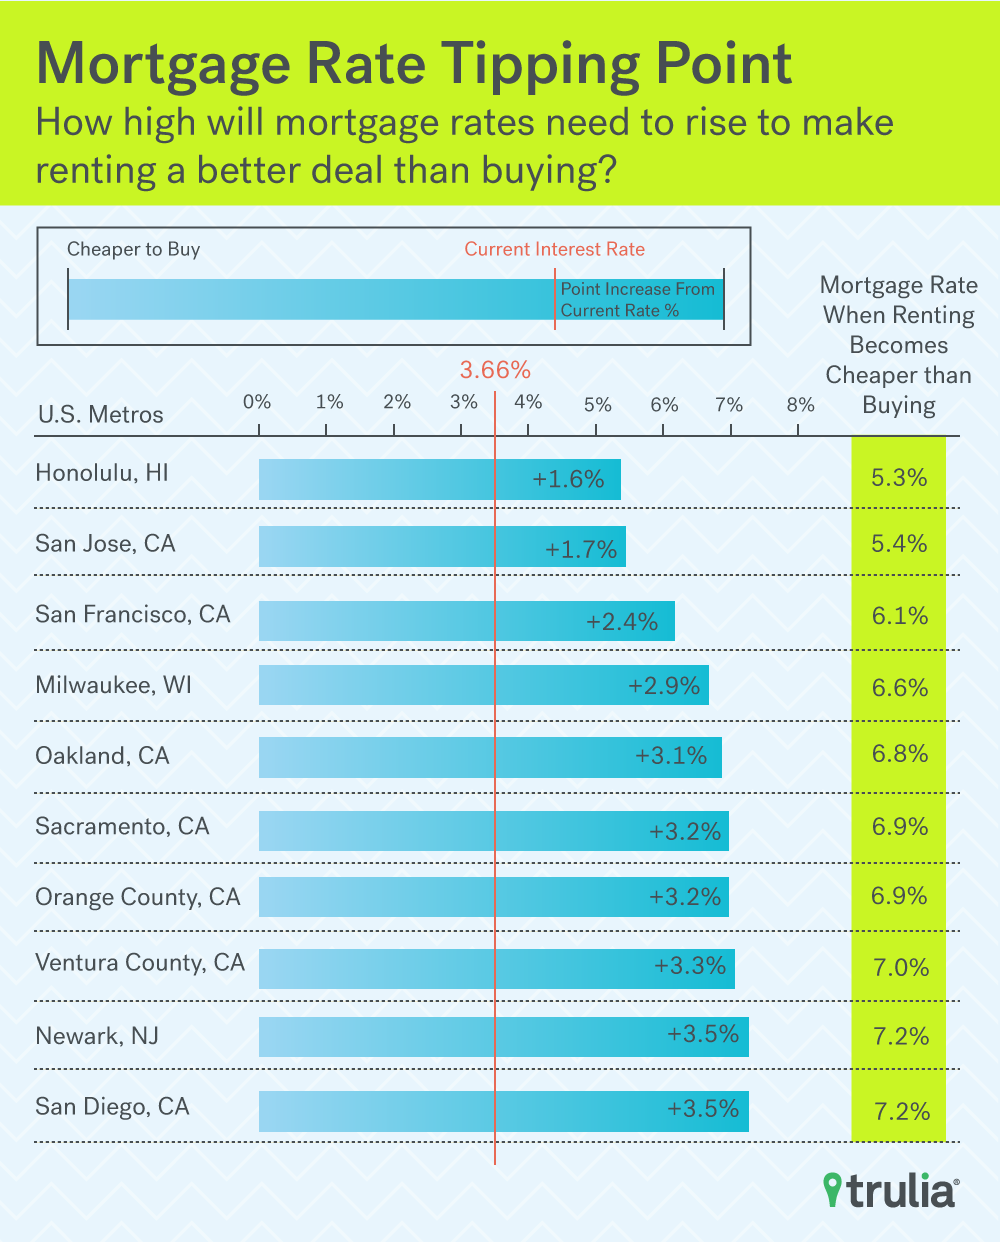
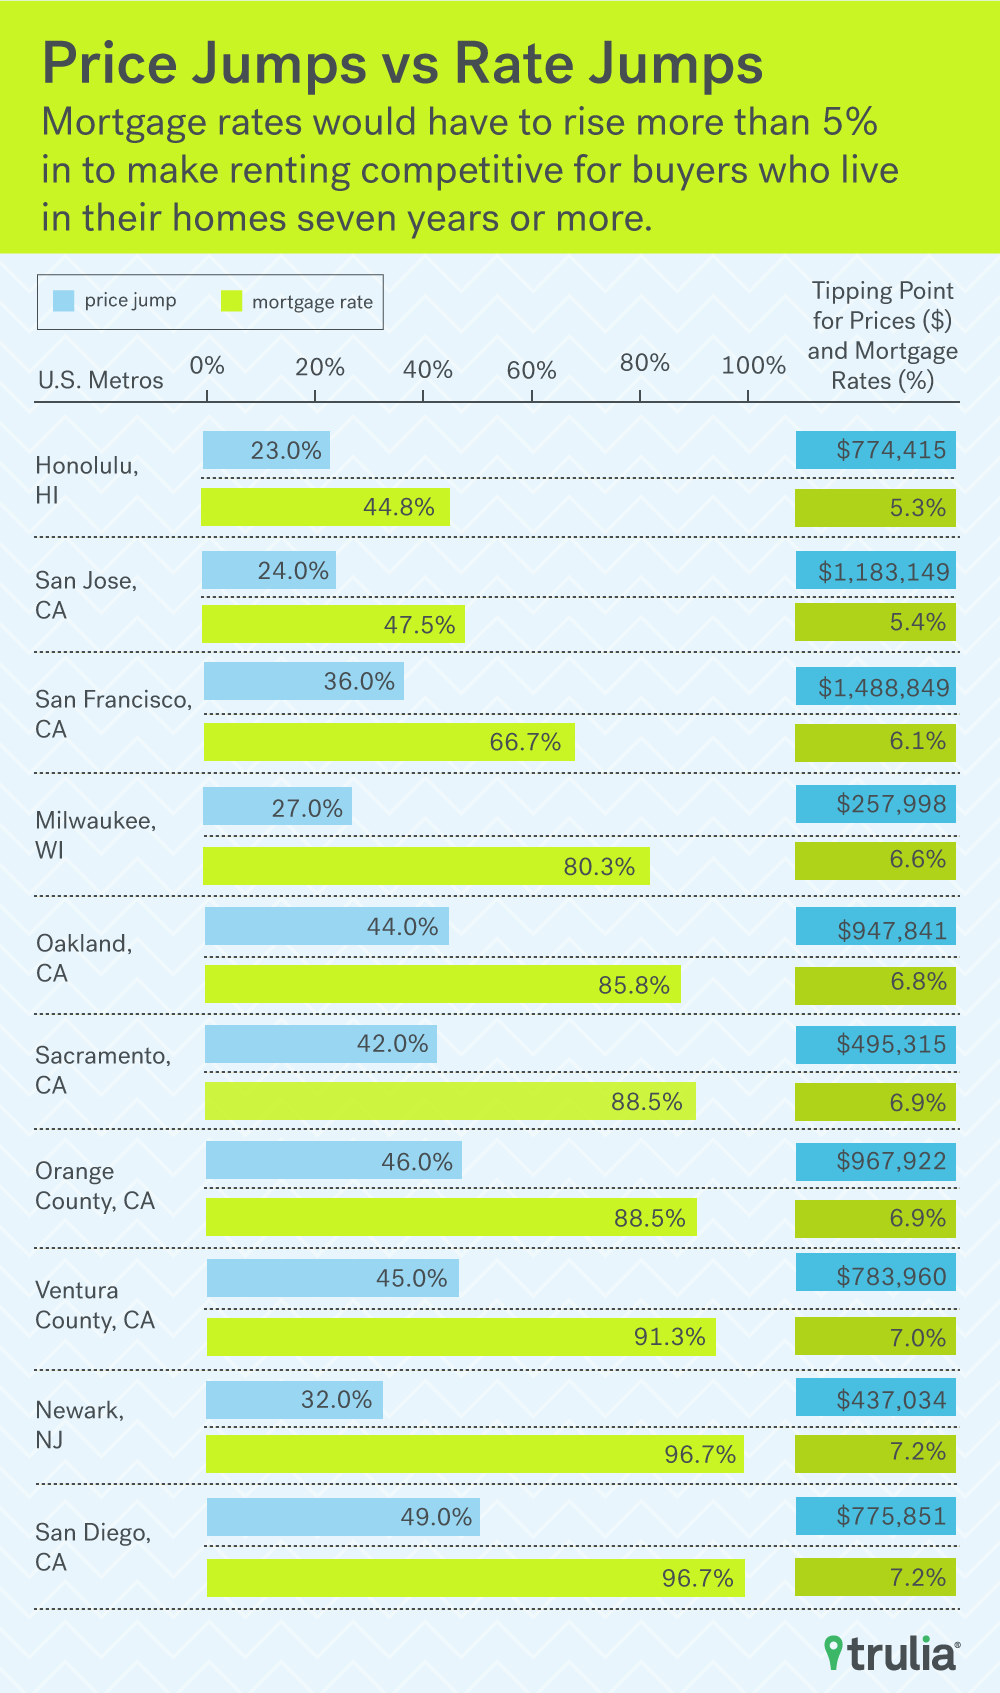
- Homebuyers should be more concerned about rising prices than rising mortgage rates. Rates would have to more than double to wipe out the financial advantage of buying, whereas prices would only need to increase by 67%. In San Jose, Calif., prices would only need to go up by 24% for the cost of buying to be the same as renting, whereas rates would have to jump by 45% – or 1.6 points – for buying to cost the same as renting.
Higher Prices Have Eroded Benefits of Lower Mortgage Rates
Mortgage rates – as measured by average rates reported by the Mortgage Bankers Association – have dropped sharply over the past year from 3.9% to 3.7%, but buying has only become a little cheaper than renting. It is now 37.7% cheaper to buy than rent on the national level and that’s only slightly better than this time last year, when buying was about 37.2% cheaper. What gives? Home prices have outpaced rents, which erased most of the savings that homebuyers received from lower mortgage rates. Nationally, prices have increased by 5.9% since last year compared to an increase of 3.5% for rents. But thanks to low mortgage rates keeping pressure on prices, buying a home today continues to be the best deal since 2012.
Those trying to decide whether to buy or rent a home this fall will have the easiest decision in the South. Eight of the 10 metros that offer the largest financial advantage of homeownership are there, with Philadelphia and Syracuse, N.Y., being the only non-Southern markets to make the list. Buying a home in Miami and West Palm Beach, Fla., will be the easiest on your wallet: after seven years of homeownership, buying a home is 53.2% cheaper than renting. Buying a home in nearby Fort Lauderdale isn’t a bad deal either, where homeownership is 52.9% cheaper.
Where Buying a Home Beats Renting
| U.S. Metro | Median Home Value, Fall 2016 | Median Rent, Fall 2016 | Cost of Buying vs. Renting (%), Fall 2016 | |
| 1 | Miami, FL | $259,527 | $2,000 | -53.2% |
| 2 | West Palm Beach, FL | $241,509 | $1,950 | -53.2% |
| 3 | Houston, TX | $176,513 | $1,575 | -52.9% |
| 4 | Fort Lauderdale, FL | $217,342 | $1,800 | -52.9% |
| 5 | Charleston, SC | $218,090 | $1,575 | -52.5% |
| 6 | Baton Rouge, LA | $158,405 | $1,350 | -51.7% |
| 7 | New Orleans, LA | $171,302 | $1,450 | -51.2% |
| 8 | Syracuse, NY | $122,040 | $1,400 | -51.0% |
| 9 | Philadelphia, PA | $141,176 | $1,300 | -50.8% |
| 10 | Columbia, SC | $124,733 | $1,125 | -50.6% |
| Note: Negative numbers mean that buying costs less than renting. Data for all metros and all scenarios presented in this report can be downloaded here. | ||||
Potential homebuyers in the West and Northeast have a more difficult decision to make, although it’s still significantly cheaper to buy than rent. Eight of the ten markets with the slimmest rent vs. buy margins are there. The financial advantage of homeownership is narrowest in Honolulu, but still 17.4% cheaper over 7 years with 20% down. In San Jose, the margin is just 18.6, and in Milwaukee – one of only two not in the West or Northeast – it’s 19.6%. Those considering buying a home in the other seven metros where the financial advantage is narrowest should fear not: it is at least 22% cheaper to buy a home than rent one in each of these markets.
Where the Financial Advantage of Buying is Slimmest
| U.S. Metro | Median Home Value, Fall 2016 | Median Rent, Fall 2016 | Cost of Buying vs. Renting (%), Fall 2016 | |
| 1 | Honolulu, HI | $629,606 | $2,500 | -17.4% |
| 2 | San Jose, CA | $954,153 | $3,600 | -18.6% |
| 3 | Milwaukee, WI | $203,148 | $1,300 | -19.6% |
| 4 | Newark, NJ | $331,086 | $2,200 | -22.9% |
| 5 | San Francisco, CA | $1,094,742 | $4,300 | -25.9% |
| 6 | Madison, WI | $224,918 | $1,525 | -27.4% |
| 7 | Sacramento, CA | $348,813 | $1,750 | -27.5% |
| 8 | Fairfield County, CT | $396,892 | $2,400 | -28.6% |
| 9 | Oakland, CA | $658,223 | $3,000 | -29.2% |
| 10 | Ventura County, CA | $540,662 | $2,600 | -29.4% |
| Note: Negative numbers mean that buying costs less than renting. Data for all metros and all scenarios presented in this report can be downloaded here. | ||||
Prices More Threatening to Homebuyers than Mortgage Rates
There’s been much speculation that the Federal Reserve Bank will increase rates in December, but homebuyers should be more concerned of rising prices than rising mortgage rates. The tipping point, that is, the price or rate at which the cost of buying equals the cost of renting, is much higher for rates than for prices. For example, the median home value tipping point for the U.S. is $467,772, which is 67% higher than today’s median value of $280,103. In comparison, the tipping point for U.S. mortgage rates is 9.1%, or 145% higher from today’s average mortgage rate of 3.7%.
Home Value and Mortgage Rate Tipping Points: Metros with Slimmest Price Margins
| U.S. Metro | Median Home Value, Fall 2016 | Median Home Value Tipping Point | % Home Value Increase to Tipping Point | Mortgage Rate Tipping Point | % Rate Increase to Tipping Point | |
| 1 | Honolulu, HI | $629,606 | $774,415 | +23.0% | 5.3% | +44.8% |
| 2 | San Jose, CA | $954,153 | $1,183,149 | +24.0% | 5.4% | +47.5% |
| 3 | Milwaukee, WI | $203,148 | $257,998 | +27.0% | 6.6% | +80.3% |
| 4 | Newark, NJ | $331,086 | $437,034 | +32.0% | 7.2% | +96.7% |
| 5 | San Francisco, CA | $1,094,742 | $1,488,849 | +36.0% | 6.1% | +66.7% |
| 6 | Madison, WI | $224,918 | $319,384 | +42.0% | 7.9% | +115.8% |
| 7 | Sacramento, CA | $348,813 | $495,315 | +42.0% | 6.9% | +88.5% |
| 8 | Fairfield County, CT | $396,892 | $567,556 | +43.0% | 7.6% | +107.7% |
| 9 | Oakland, CA | $658,223 | $947,841 | +44.0% | 6.8% | +85.8% |
| 10 | Ventura County, CA | $540,662 | $783,960 | +45.0% | 7.0% | +91.3% |
| Note: Negative numbers mean that buying costs less than renting. Data for all metros and all scenarios presented in this report can be downloaded here. | ||||||
There are some markets, though, where the tipping points are relatively lower. Prices in Honolulu, San Jose, and Milwaukee would only need to rise between 23% and 27% to reach the tipping point, while rates on the hand rates would need to increase between 44% and 80%. While such a large increase is unlikely to occur anytime soon, the point is that any threat to the financial benefits of homeownership are more likely to come from price pressures than rate pressures since rates would have to go up by a much larger proportion than prices to affect the rent vs. buy decision.
The Recap
It is slightly cheaper to buy than rent this year compared to last. While rates have dropped significantly compared to last year, rising prices have eroded much of the financial benefits of lower rates that would accrue to homebuyers. Homebuyers should also be more concerned about prices outpacing rents than any possible rate hike by the end of the year. This is because the tipping point for rates is proportionally much higher than the tipping point for prices. In other words, rates would have to go up much more than prices for the costs of buying a home to be parity with the cost of renting. But buyers don’t need to fret too much. Even in markets where it the rent vs. buy decisions is toughest, Federal Open Market Committee (FOMC) would have to raise rates aggressively. For example, in Honolulu and San Jose, the FOMC would have to increase six times at a quarter point each to reach the tipping point, and even if they did there’s no guarantee that mortgage rates would follow suit since they are more closely tied to the 10-year bond. On the other hand, price increases to the tipping point in some markets are not unprecedented. Prices in San Jose, on the other hand, climbed to near tipping point rates in 2013 at 21% year-over-year. Still, we think either scenario – aggressive price or rate increases – is unlikely to play out anytime soon. The FOMC has only raised rates once in the past 10 years, and prices would have to grow to their tipping with little movement in rents. The latter of which hasn’t happened since the housing market recovery began in 2012.
Methodology
Trulia calculates the costs of buying and renting by:
- We use our quality-adjusted measure of home prices and rents, which allows an apples-to-apples comparison between rental and owner-occupied housing units. We looked at median home value and rent in March 2016 in each of the largest 100 metros.
- We calculate the initial total monthly costs of owning and renting, including mortgage payments, maintenance, insurance, and taxes.
- We calculate the future total monthly costs of owning and renting, taking into account expected price and rent appreciation, as well as projected inflation.
- We factor in one-time costs and proceeds, including closing costs, down payment, sale proceeds, and security deposits.
- We calculate net present value, which reveals the opportunity cost of using money to buy a house instead of investing it. Net present value is the worth in today’s dollars of a future stream of payments and proceeds, taking into account expected interest rates.
Trulia’s Rent vs. Buy Calculator lets you compare renting and buying costs using other assumptions about prices, rents, and other factors. It uses the same math that powers our interactive map and this report. You can read our extended methodology here.

