Over the last few years, rents have been soaring in major cities across the country. In fact, rising rents have even outpaced home price growth in some markets, making homeownership a much cheaper deal than renting. That said, we realize that not everyone is ready to settle down and buy a house even if the math theoretically makes sense.
The trouble is, renting in some cities is prohibitively expensive. For instance, in the city of San Francisco, 78.1% of 1-bedroom homes are going for at least $2,500 a month. Meanwhile, 66.8% of 1-bedroom rentals in Boston were listed for $2,000 a month or more.
| Where You’ll Find the Most Expensive 1-Bedroom Rentals | ||||
| City or Borough | % of 1-Bedrooms Renting for $2000+/Mo | % of 1-Bedrooms Renting for $2500+/Mo | % of 1-Bedrooms Renting for $3000+/Mo | % of 1-Bedrooms Renting for $4000+/Mo |
| San Francisco | 90.6% | 78.1% | 55.0% | 15.3% |
| Manhattan (NYC) | 89.3% | 75.9% | 57.5% | 19.8% |
| Boston | 66.8% | 33.7% | 13.8% | 2.7% |
| Brooklyn (NYC) | 51.3% | 31.8% | 15.9% | 2.4% |
| Washington, D.C. | 37.8% | 13.1% | 4.8% | 0.6% |
| Los Angeles | 35.9% | 18.4% | 9.8% | 2.9% |
| Queens (NYC) | 16.8% | 3.9% | 0.5% | 0.1% |
| Bronx (NYC) | 3.0% | 0.5% | 0.2% | 0.1% |
| Note: Sorted by % of 1-bedrooms renting for $2,000+/month. | ||||
Now for renters who are no longer lone wolves and in the market for a 2-bedroom apartment, the odds of finding an affordable rental aren’t any better if you want to stay in the city center. For example, nearly half of all the 2-bedroom homes in Manhattan were listed for more than $4,000 a month. But if renters are willing to venture out to one of the other boroughs, the savings can be significant. In nearby Brooklyn, only 11% of 2-bedroom rentals are going for $4,000 a month or more as there are more rentals hovering near the $2,000 to $3,000 range.
| Where You’ll Find the Most Expensive 2-Bedroom Rentals | ||||
| City or Borough | % of 2-Bedrooms Renting for $2000+/Mo | % of 2-Bedrooms Renting for $2500+/Mo | % of 2-Bedrooms Renting for $3000+/Mo | % of 2-Bedrooms Renting for $4000+/Mo |
| San Francisco | 97.7% | 95.7% | 90.8% | 63.3% |
| Manhattan (NYC) | 95.4% | 88.6% | 76.1% | 47.7% |
| Boston | 87.4% | 67.0% | 39.5% | 12.1% |
| Washington, D.C. | 77.0% | 59.0% | 32.7% | 9.9% |
| Los Angeles | 75.0% | 56.1% | 35.7% | 14.1% |
| Brooklyn (NYC) | 72.0% | 46.4% | 28.4% | 11.0% |
| Queens (NYC) | 57.3% | 17.2% | 4.8% | 0.3% |
| Bronx (NYC) | 12.5% | 4.7% | 1.8% | 0.2% |
| Note: Sorted by % of 2-bedrooms renting for $2,000+/month | ||||
Fortunately for renters, not every neighborhood in a city is prohibitively expensive. So, to help house hunters in the country’s priciest rental markets, we’ve mapped out where most of the 1-bedroom rental are likely to be priced at more than $3,000 month or more than $2,000 a month. This is based on all the homes listed for rent on Trulia between Jan. 1, 2015 and Oct. 20, 2015, which includes single-family homes, apartments, condos, and townhouses. Only neighborhoods with a sizable sample size of rentals were included.
San Francisco – 1-Bedroom Units
Believe it or not, San Francisco is home to one of America’s most expensive rental markets. The median rent for a 1-bedroom rental in SF is currently at a whopping $3,200. The highest concentration of 1-bedroom rentals priced over $3,000 is in Fisherman’s Wharf (82.8%), followed by the Mission (78.8%), and Pacific Heights (73.8%). (Click here to see and get the embed code for interactive versions of the SF map below.)
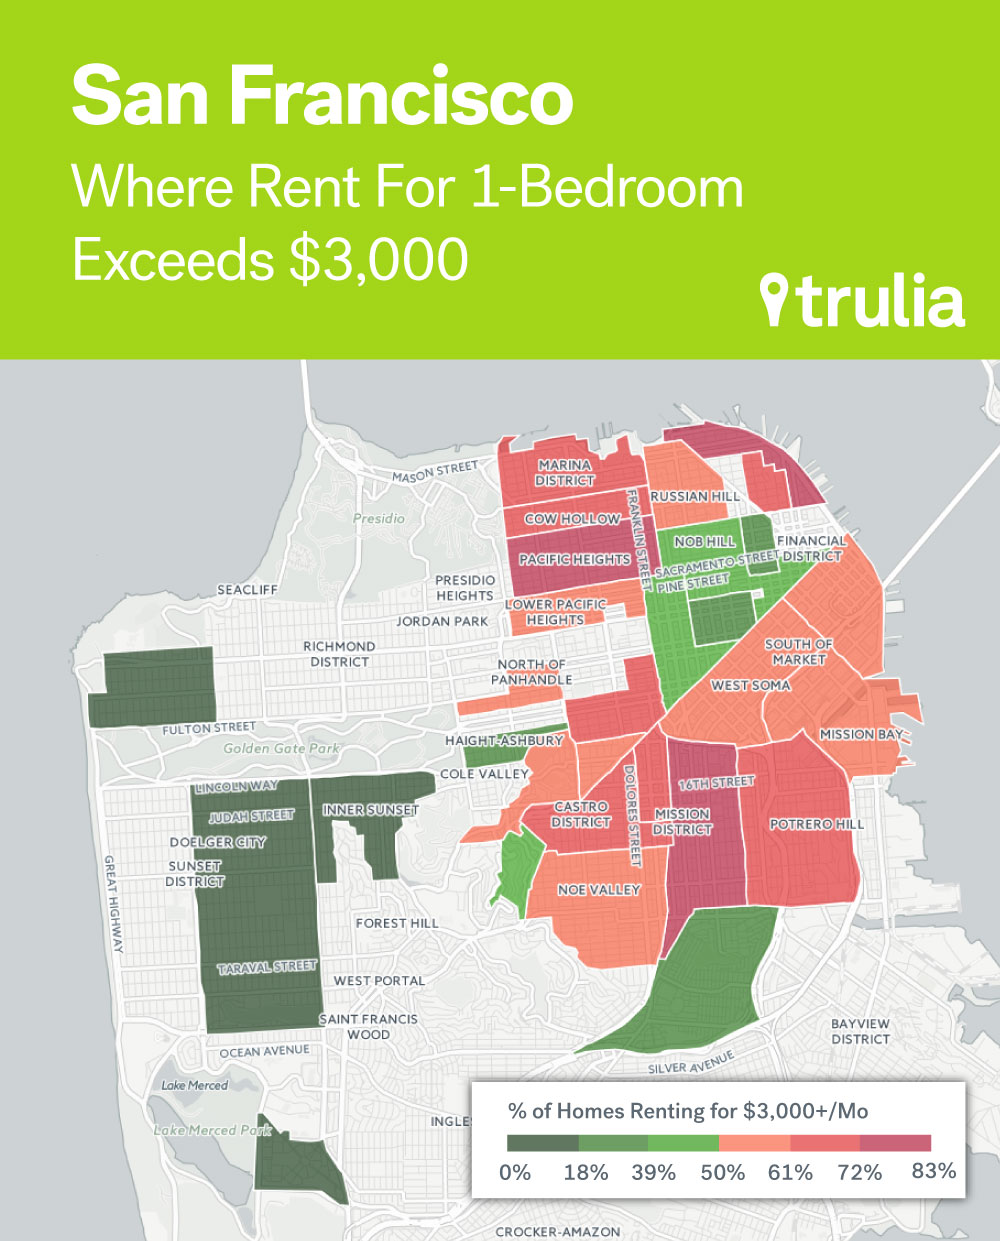
| San Francisco Neighborhoods with the Most Expensive 1-Bedroom Rentals | |||
| # | Neighborhood | % of 1-Bedrooms Renting for More than $3,000 | Median Rent |
| 1 | Fisherman’s Wharf | 82.8% | $3,500 |
| 2 | Mission | 78.8% | $3,500 |
| 3 | Pacific Heights | 73.8% | $3,600 |
| 4 | Castro | 71.9% | $3,500 |
| 5 | Potrero Hill | 71.7% | $3,600 |
| 6 | Telegraph Hill | 70.0% | $3,325 |
| 7 | Mission Dolores | 69.0% | $3,500 |
| 8 | Cow Hollow | 68.8% | $3,350 |
| 9 | Hayes Valley | 68.7% | $3,500 |
| 10 | Marina | 68.3% | $3,348 |
New York City – 1-Bedroom Units
The median rent for a 1-bedroom rental in Manhattan, currently at $3,250, is equally as high as in San Francisco. And, as can be expected, rents vary dramatically across the five boroughs. Manhattan is the priciest, with the highest concentration of pricey 1-bedroom rentals in Battery Park City (90.9%) and the Flatiron District (90.8%). You’ll find more affordable rentals in the other four boroughs, except in Vinegar Hill in Brooklyn where 94.7% of the 1-bedroom are going for at least $3,000 a month. (Click here to see and get the embed code for interactive versions of the NYC maps below.)
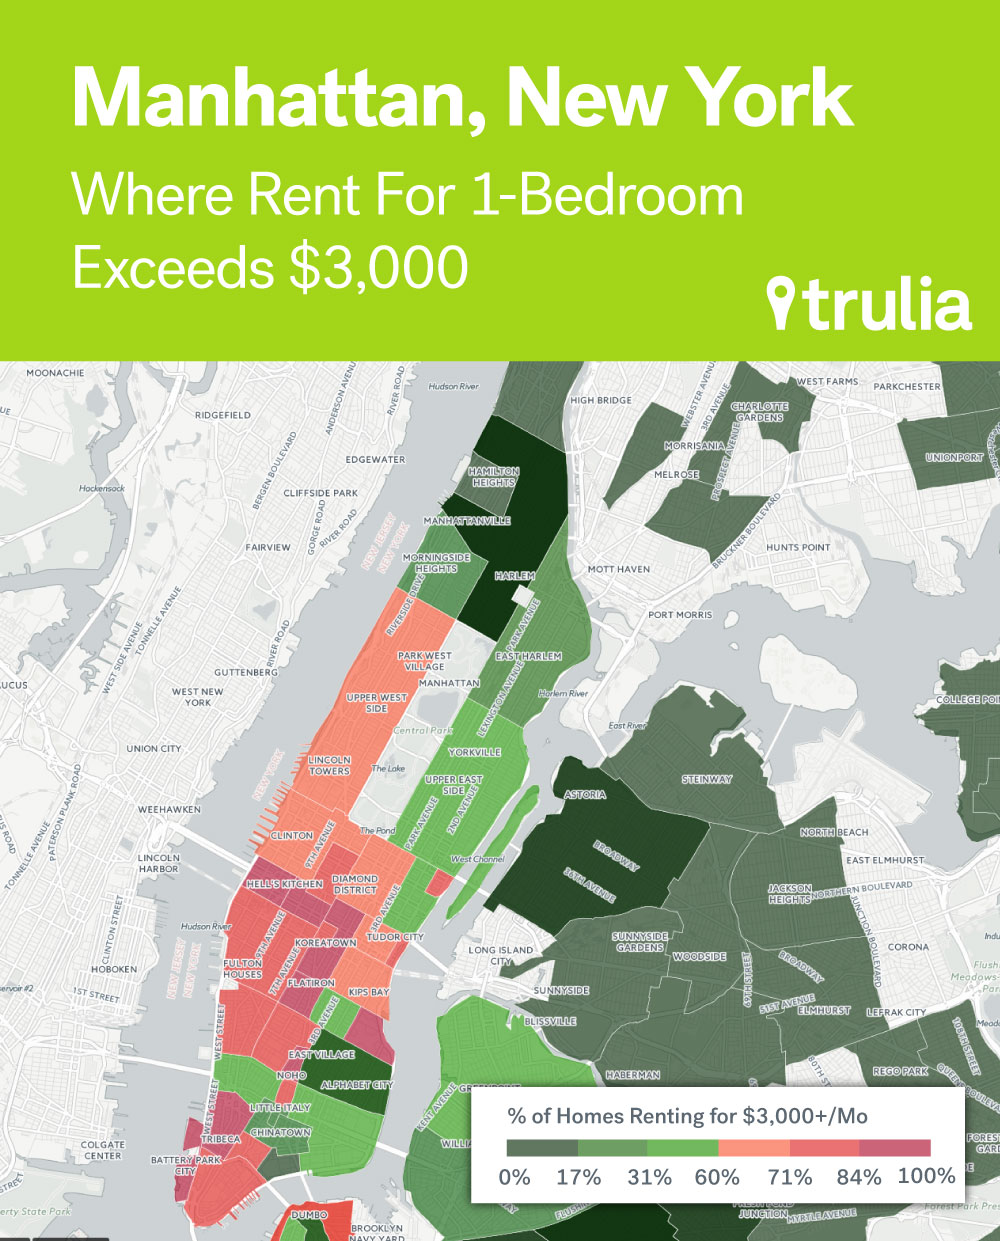
| Manhattan Neighborhoods with the Most Expensive 1-Bedroom Rentals | |||
| # | Neighborhood | % of 1-Bedrooms Renting for More than $3,000 | Median Rent |
| 1 | Battery Park City | 90.9% | $3,800 |
| 2 | Flatiron District | 90.8% | $4,195 |
| 3 | Midtown South Central | 89.7% | $4,300 |
| 4 | Hell’s Kitchen | 87.3% | $3,500 |
| 5 | Stuyvesant Town | 86.9% | $3,405 |
| 6 | Garment District | 86.6% | $3,700 |
| 7 | Tribeca | 86.4% | $3,995 |
| 8 | NoHo | 86.2% | $3,850 |
| 9 | Koreatown | 83.8% | $3,600 |
| 10 | Theater District – Times Square | 83.3% | $3,700 |
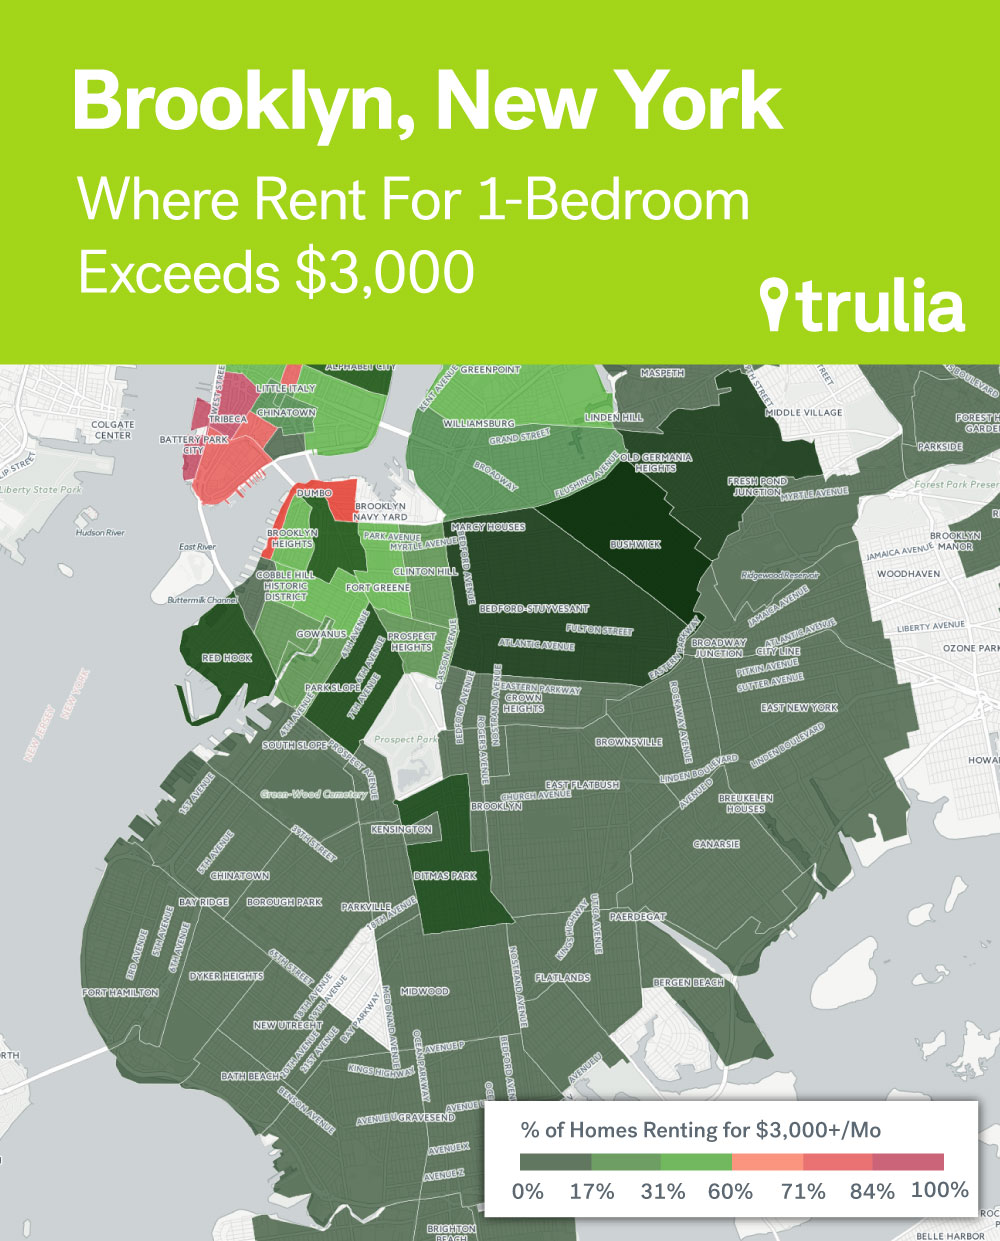
| Brooklyn Neighborhoods with the Most Expensive 1-Bedroom Rentals | |||
| # | Neighborhood | % of 1-Bedrooms Renting for More than $3,000 | Median Rent |
| 1 | Vinegar Hill | 94.7% | $3,738 |
| 2 | Downtown/DUMBO | 57.9% | $3,100 |
| 3 | Brooklyn Heights | 48.0% | $3,000 |
| 4 | Boerum Hill | 40.4% | $2,900 |
| 5 | Greenpoint | 39.6% | $2,800 |
| 6 | Cobble Hill | 37.7% | $2,800 |
| 7 | Fort Greene | 34.4% | $2,800 |
| 8 | Williamsburg | 25.1% | $2,600 |
| 9 | Red Hook | 17.5% | $1,800 |
| 10 | Carroll Gardens | 12.7% | $2,600 |
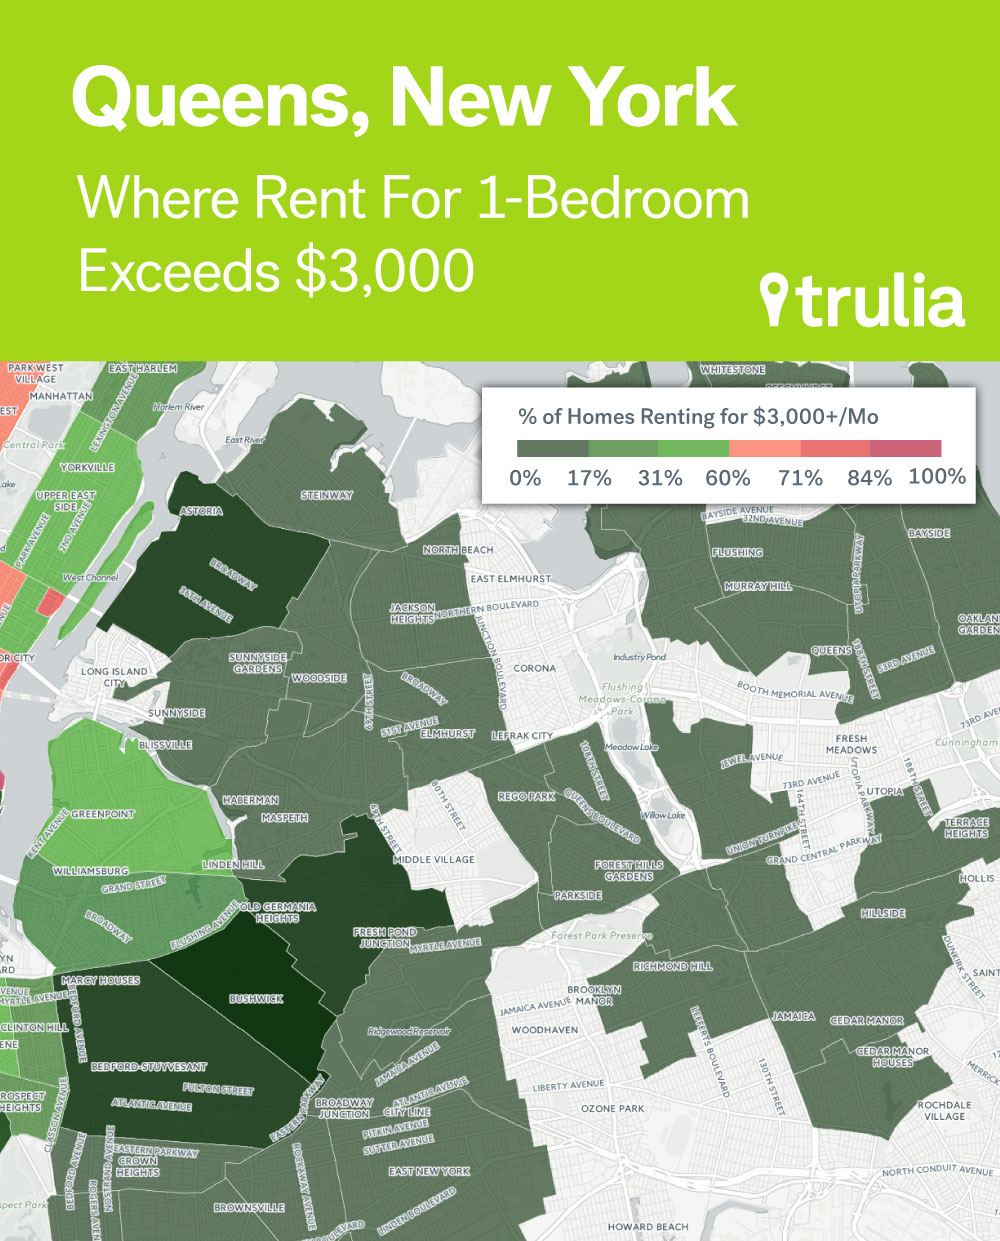
| Queens Neighborhoods with the Most Expensive 1-Bedroom Rentals | |||
| # | Neighborhood | % of 1-Bedrooms Renting for More than $3,000 | Median Rent |
| 1 | Whitestone | 3.3% | $1,550 |
| 2 | Rego Park | 1.9% | $1,775 |
| 3 | College Point | 1.5% | $1,350 |
| 4 | Ridgewood | 1.4% | $1,600 |
| 5 | Astoria | 0.7% | $1,900 |
| 6 | Jamaica Estates | 0.7% | $1,600 |
| 7 | Bayside | 0.6% | $1,600 |
| 8 | Ditmars Steinway | 0.4% | $1,750 |
| 9 | Kew Gardens | 0.3% | $1,700 |
| 10 | Flushing | 0.2% | $1,595 |
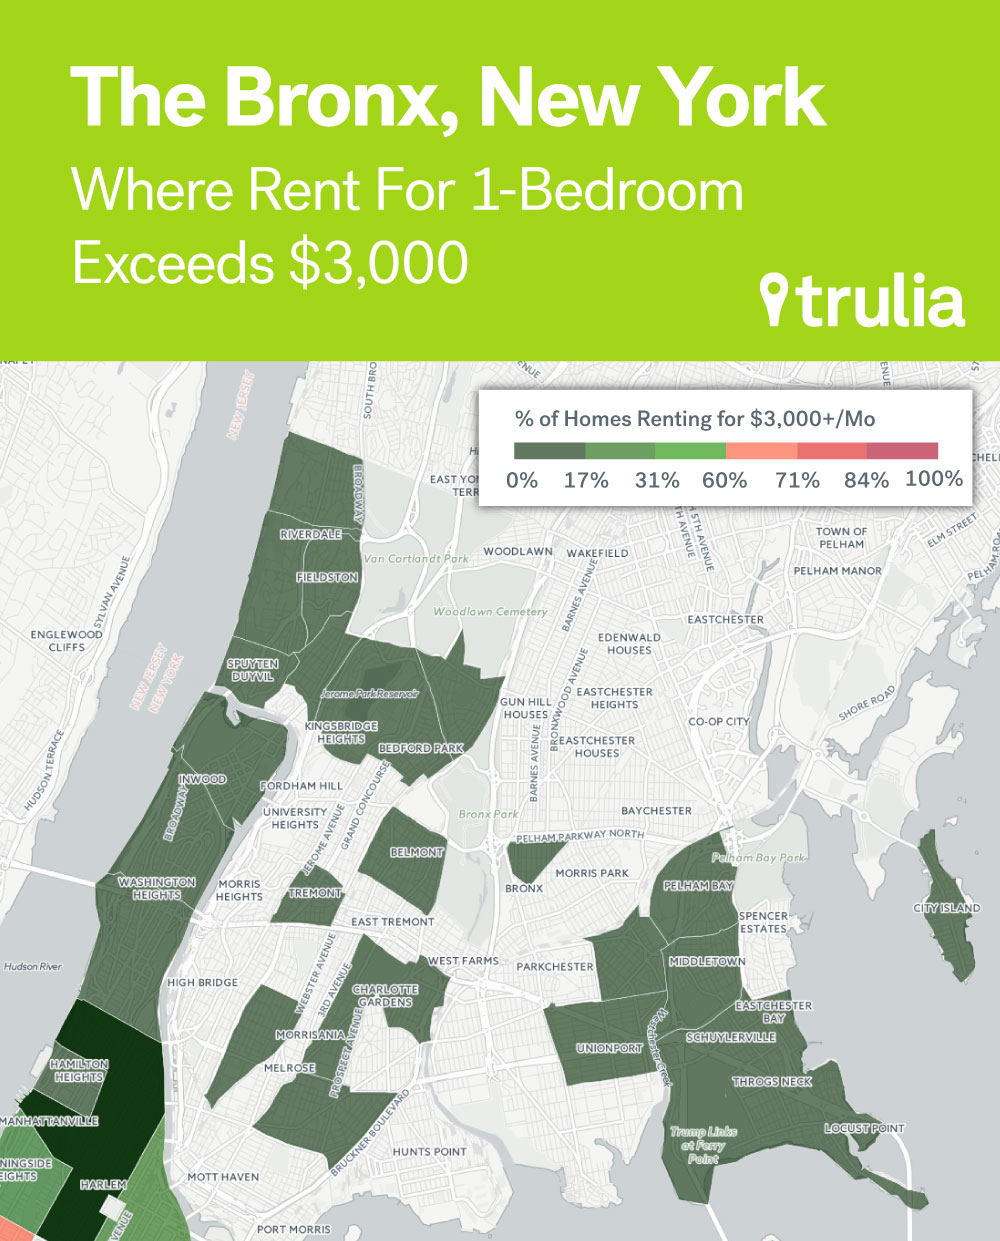
| Bronx Neighborhoods with the Most Expensive 1-Bedroom Rentals | |||
| # | Neighborhood | % of 1-Bedrooms Renting for More than $3,000 | Median Rent |
| 1 | City Island | 5.0% | $1,273 |
| 2 | Throgs Neck – Edgewater Park | 2.5% | $1,300 |
| 3 | Belmont | 1.7% | $1,200 |
| 4 | Riverdale | 1.7% | $1,850 |
| 5 | Mount Hope | 0.6% | $1,300 |
| 6 | Bronxdale | 0.4% | $1,350 |
| 7 | Norwood | 0.3% | $1,300 |
| 8 | Bronxwood | 0.0% | $1,250 |
| 9 | Claremont | 0.0% | $1,200 |
| 10 | Concourse | 0.0% | $1,300 |
Boston – 1-Bedroom Units
In Boston, the median rent for 1-bedroom rentals is $2,300 and budget-conscious renters should avoid the heart of the city. The higher end of the market is located in the West End, Chinatown/Leather District, Downtown Boston, and Back Bay. This is where you’ll find most of the 1-bedroom homes that are going for more than $2,000 a month. (Click here to see and get the embed code for interactive versions of the Boston map below.)
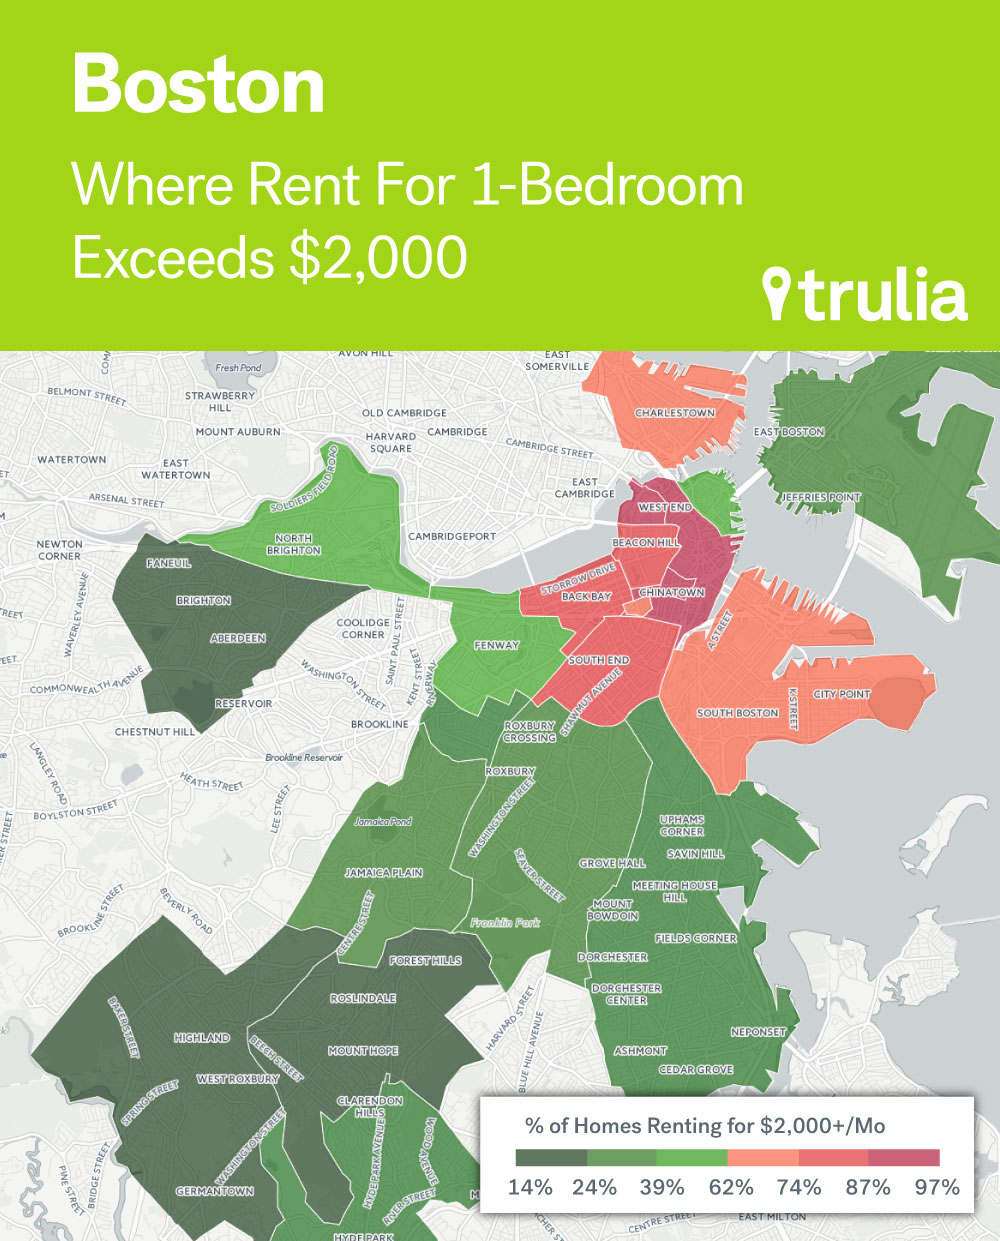
| Boston Neighborhoods with the Most Expensive 1-Bedroom Rentals | |||
| # | Neighborhood | % of 1-Bedrooms Renting for More than $2,000 | Median Rent |
| 1 | West End | 96.6% | $2,575 |
| 2 | Chinatown / Leather District | 93.9% | $3,245 |
| 3 | Downtown Boston | 88.9% | $2,875 |
| 4 | Back Bay | 85.3% | $2,500 |
| 5 | South End | 79.4% | $2,500 |
| 6 | Beacon Hill | 74.7% | $2,250 |
| 7 | Charlestown | 71.7% | $2,400 |
| 8 | Bay Village | 69.5% | $2,400 |
| 9 | South Boston | 66.6% | $2,476 |
| 10 | Fenway-Kenmore | 58.5% | $2,100 |
Washington, D.C. – 1-Bedroom Units
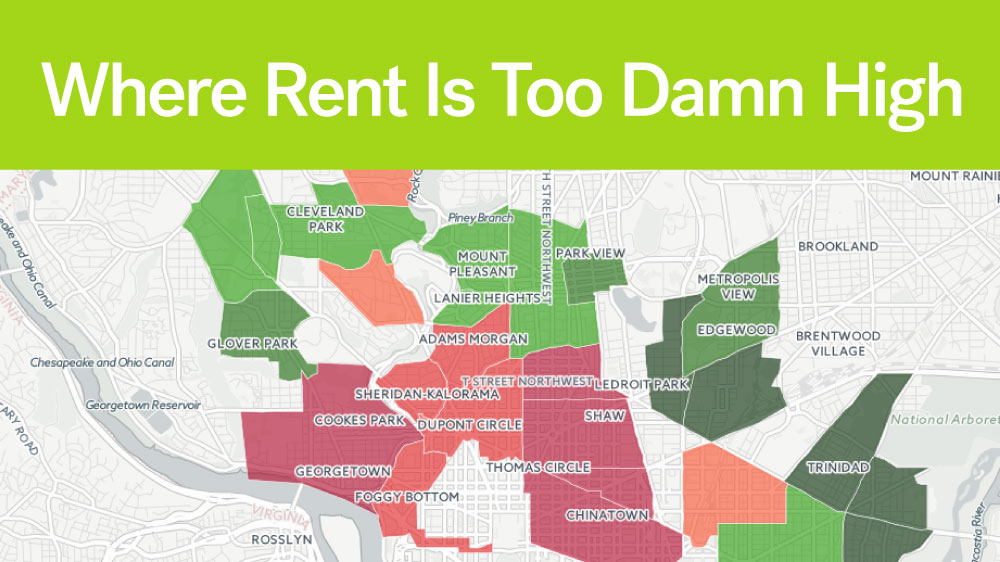
In our nation’s capital, the median rent for 1-bedroom rentals is currently $1,875. Not surprisingly, the most expensive rentals form a ring around Capitol Hill, the White House, and all the rest of our country’s national monuments and museums. Renters will find the most 1-bedroom homes priced at $2,000 a month or more in Downtown (84.3%), Logan Circle-Shaw (76.7%), Cardozo-Shaw (76.5%), and Mount Vernon Square (76.4%). (Click here to see and get the embed code for interactive versions of the Washington, D.C. map below.)
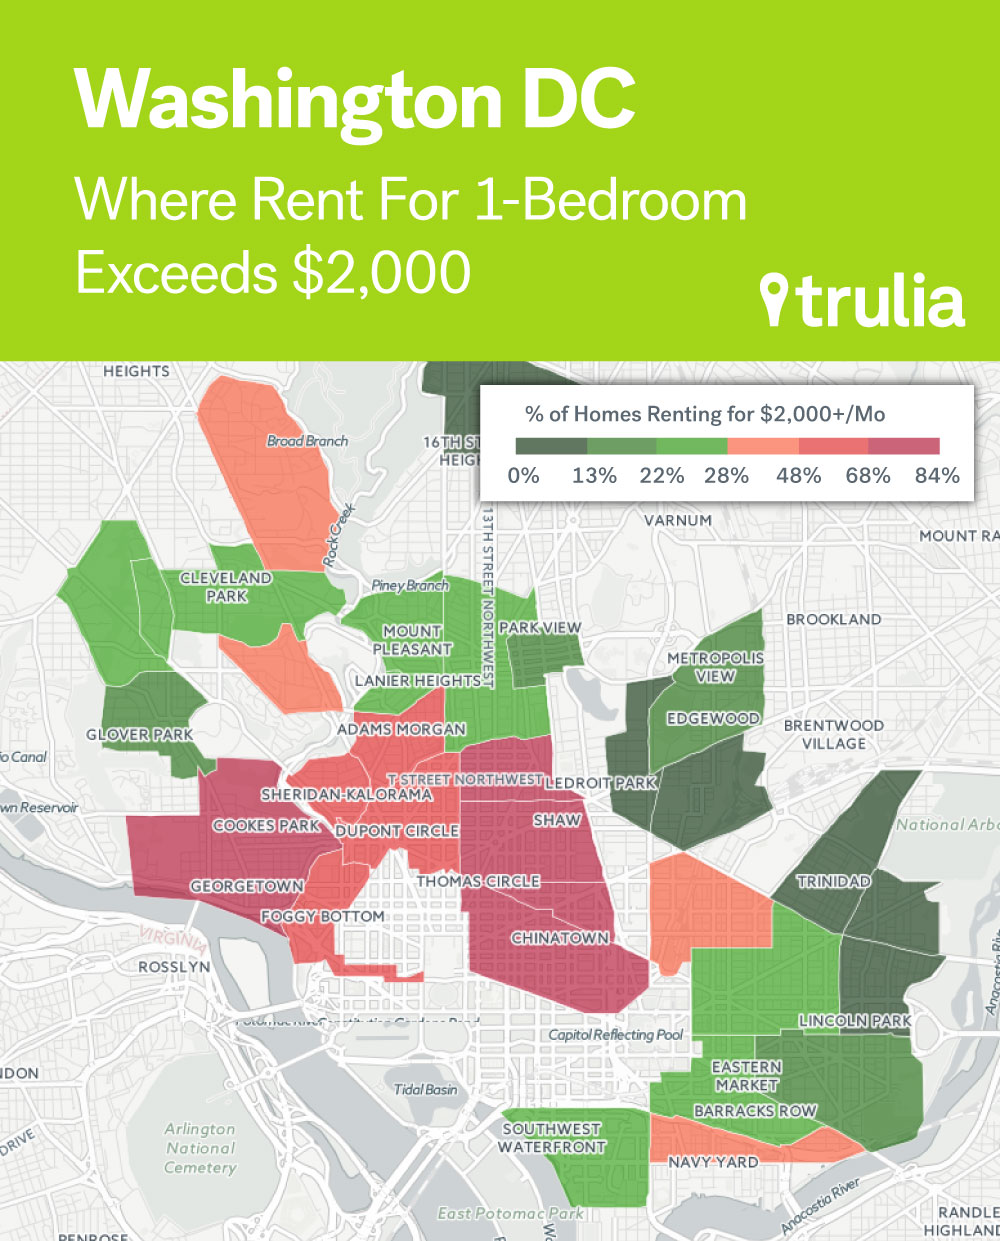
| Washington, D.C. Neighborhoods with the Most Expensive 1-Bedroom Rentals | |||
| # | Neighborhood | % of 1-Bedrooms Renting for More than $2,000 | Median Rent |
| 1 | Downtown | 84.3% | $2,385 |
| 2 | Logan Circle-Shaw | 76.7% | $2,400 |
| 3 | Cardozo-Shaw | 76.5% | $2,299 |
| 4 | Mount Vernon Square | 76.4% | $2,400 |
| 5 | Georgetown | 69.8% | $2,500 |
| 6 | West End | 68.3% | $2,363 |
| 7 | Dupont Circle | 63.6% | $2,195 |
| 8 | Foggy Bottom | 62.2% | $2,200 |
| 9 | Kalorama Heights | 50.0% | $2,075 |
| 10 | Adams Morgan | 49.6% | $2,000 |
Los Angeles – 1-Bedroom Units
While the City of Angels is known for multi-million dollar oceanfront mansions, the rental market isn’t nearly as over the top as it is in San Francisco and New York, but it’s not cheap either. The median rent for 1-bedroom rentals is currently $1,750. The neighborhood with the most 1-bedroom rentals going for more than $2,000 a month is Downtown Los Angeles (84.3%), followed by Brentwood (70.8%) and Century City (70.6%). (Click here to see and get the embed code for interactive versions of the LA map below.)
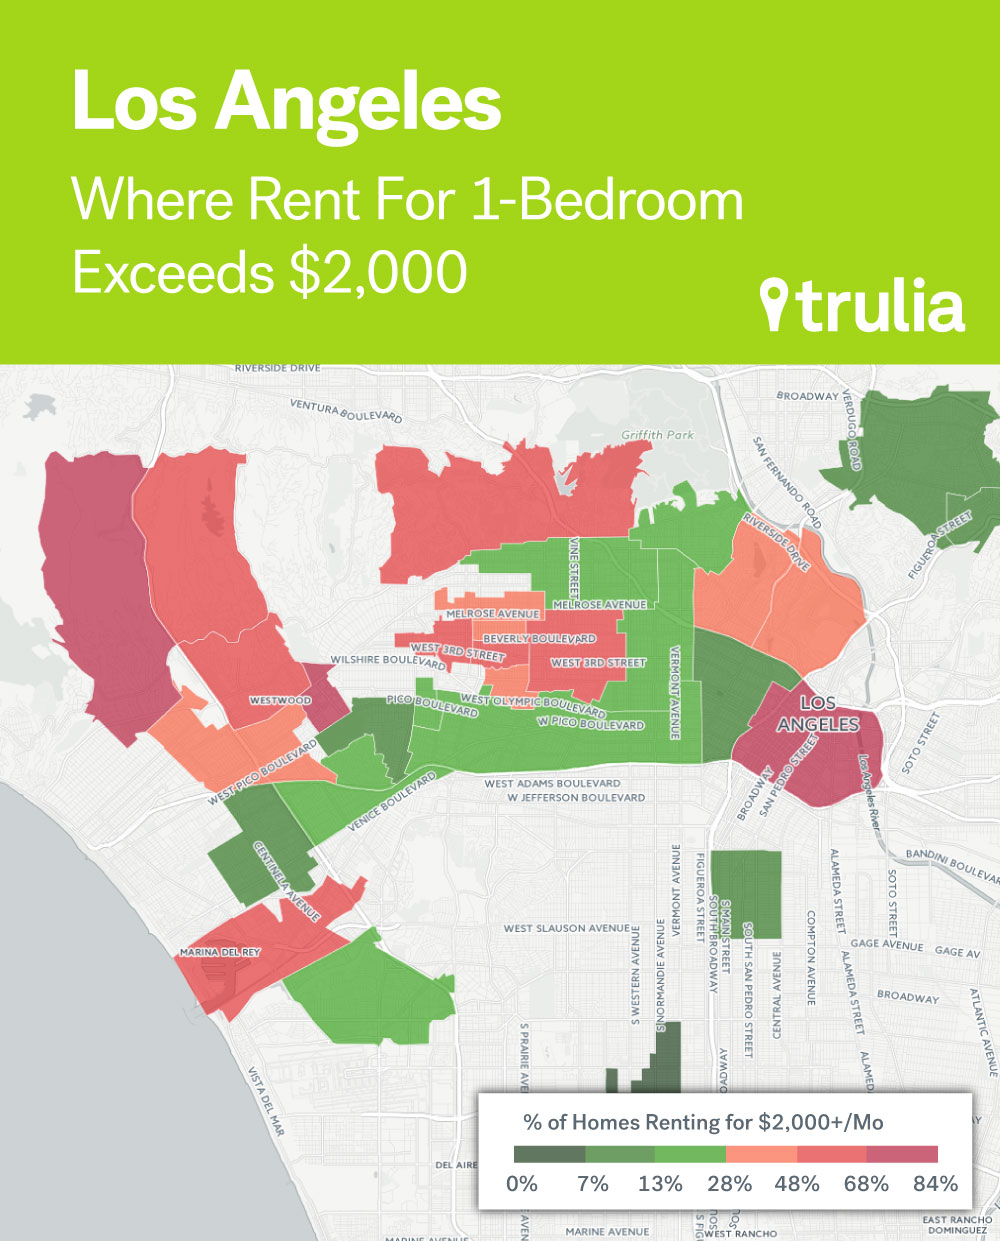
| Los Angeles Neighborhoods with the Most Expensive 1-Bedroom Rentals | |||
| # | Neighborhood | % of 1-Bedrooms Renting for More than $2,000 | Median Rent |
| 1 | Downtown Los Angeles | 84.3% | $2,550 |
| 2 | Brentwood | 70.8% | $2,195 |
| 3 | Century City | 70.6% | $2,638 |
| 4 | Marina Del Rey | 64.3% | $2,350 |
| 5 | Bel Air | 64.0% | $2,195 |
| 6 | Westwood | 58.9% | $2,290 |
| 7 | Beverly Center | 56.3% | $2,250 |
| 8 | La Brea | 55.0% | $2,075 |
| 9 | Hancock Park | 51.3% | $2,095 |
| 10 | Hollywood Hills | 48.6% | $2,000 |
Looking for more space and want an additional bedroom? If so, you will probably want at least a 2-bedroom apartment. Pricing for 2-bedroom units are equally depressing as that for 1-bedroom units, if not more.
San Francisco – 2-Bedroom Units
The median cost for a 2-bedroom rental in SF is an incredible $4,500. The highest concentration of 2-bedroom rentals priced over $3,000 is in Fisherman’s Wharf (100%), followed by North Beach (95.2%), followed by the Marina (92.1%), which is then followed by Pacific Heights (90.7%). (Click here to see and get the embed code for interactive versions of the SF map below.)
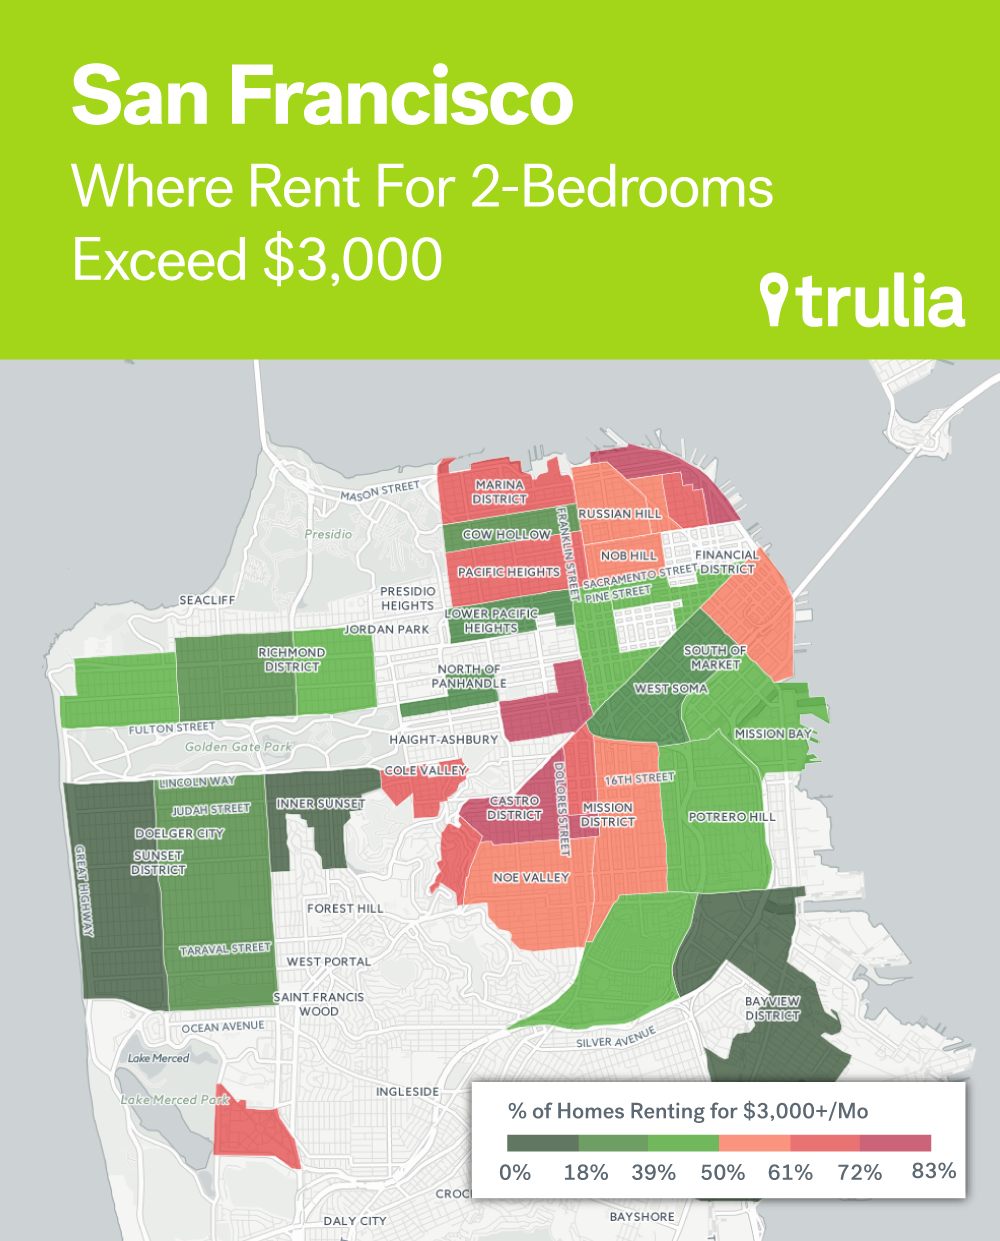
| San Francisco Neighborhoods with the Most Expensive 2-Bedroom Rentals | |||
| # | Neighborhood | % of 2-Bedrooms Renting for More than $3,000 | Median Rent |
| 1 | Fisherman’s Wharf | 100.0% | $5,150 |
| 2 | North Beach | 95.2% | $5,200 |
| 3 | Marina | 92.1% | $5,475 |
| 4 | Pacific Heights | 90.7% | $5,250 |
| 5 | Mission Bay | 86.7% | $5,100 |
| 6 | Castro | 84.7% | $4,995 |
| 7 | Noe Valley | 81.2% | $4,700 |
| 8 | South Beach | 79.3% | $5,500 |
| 9 | Cow Hollow | 78.9% | $4,798 |
| 10 | Russian Hill | 78.9% | $5,400 |
New York City – 2-Bedroom Units
Not far behind SF, the median cost of a 2-bedroom rental in Manhattan is $3,950. Much like for 1-bedrooms, Manhattan and Brooklyn dominate the other NYC boroughs when it comes to unaffordable housing for 2-bedrooms. For Manhattan, Battery Park City (98.8%) takes first place, Flatiron District (98.0%) second place, and Theater District – Times Square (97.8%) third place. Expensive neighborhoods in Brooklyn also have a very high proportion of 2-bedroom units priced above $3,000 per month. Those neighborhoods are Vinegar Hill (97.9%), DUMBO (90.7%), and Cobble Hill (87.9%). (Click here to see and get the embed code for interactive versions of the Manhattan map below.)
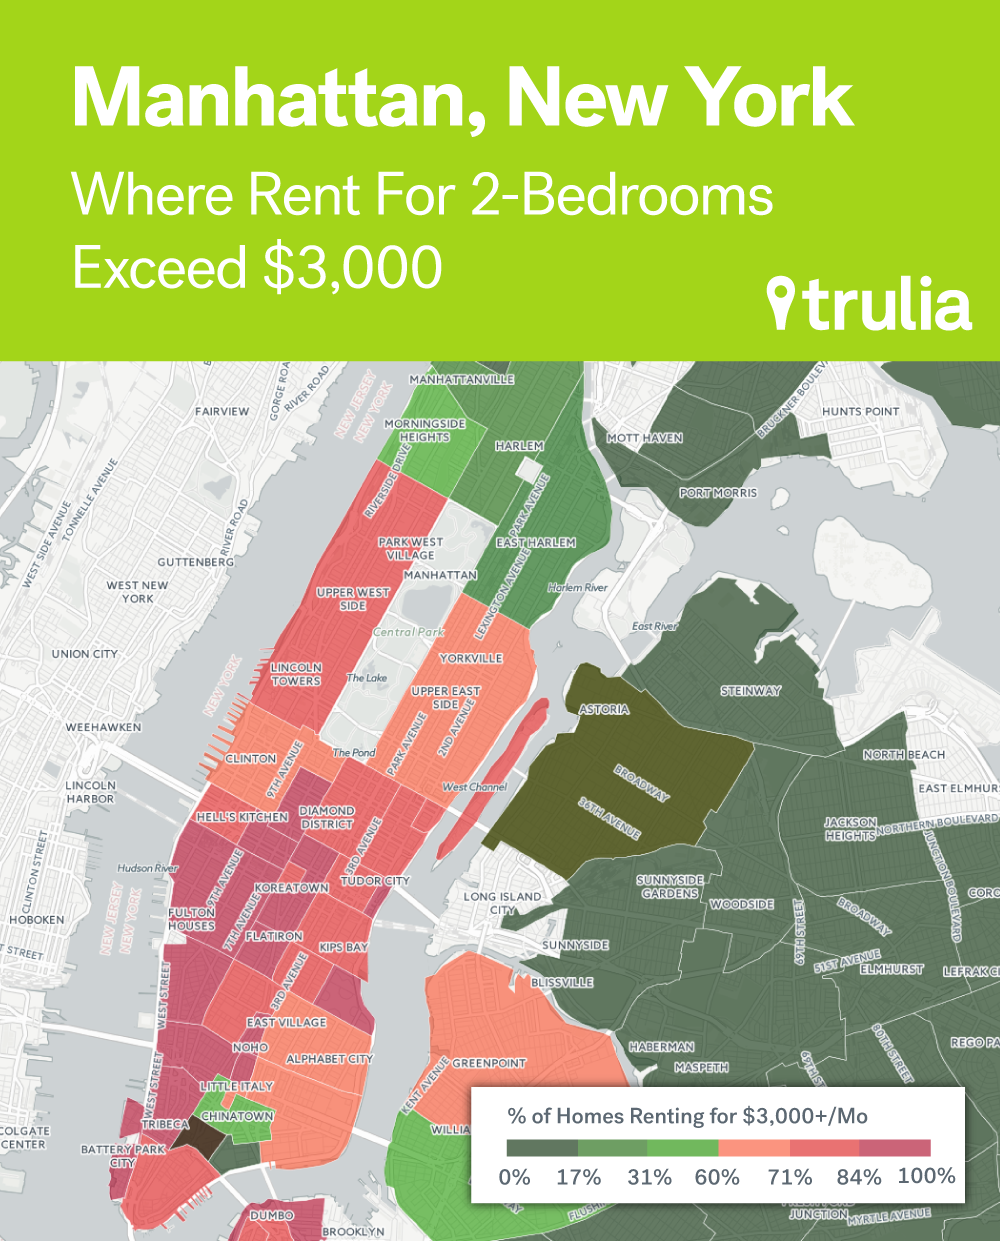
| Manhattan Neighborhoods with the Most Expensive 2-Bedroom Rentals | |||
| # | Neighborhood | % of 2-Bedrooms Renting for More than $3,000 | Median Rent |
| 1 | Battery Park City | 98.8% | $6,385 |
| 2 | Flatiron District | 98.0% | $6,223 |
| 3 | Theater District – Times Square | 97.8% | $4,898 |
| 4 | Tudor City | 97.1% | $4,475 |
| 5 | West Village | 96.5% | $4,500 |
| 6 | NoHo | 95.5% | $8,000 |
| 7 | Tribeca | 95.4% | $5,795 |
| 8 | Stuyvesant Town | 95.2% | $4,328 |
| 9 | Chelsea | 95.2% | $5,200 |
| 10 | Garment District | 95.0% | $4,995 |
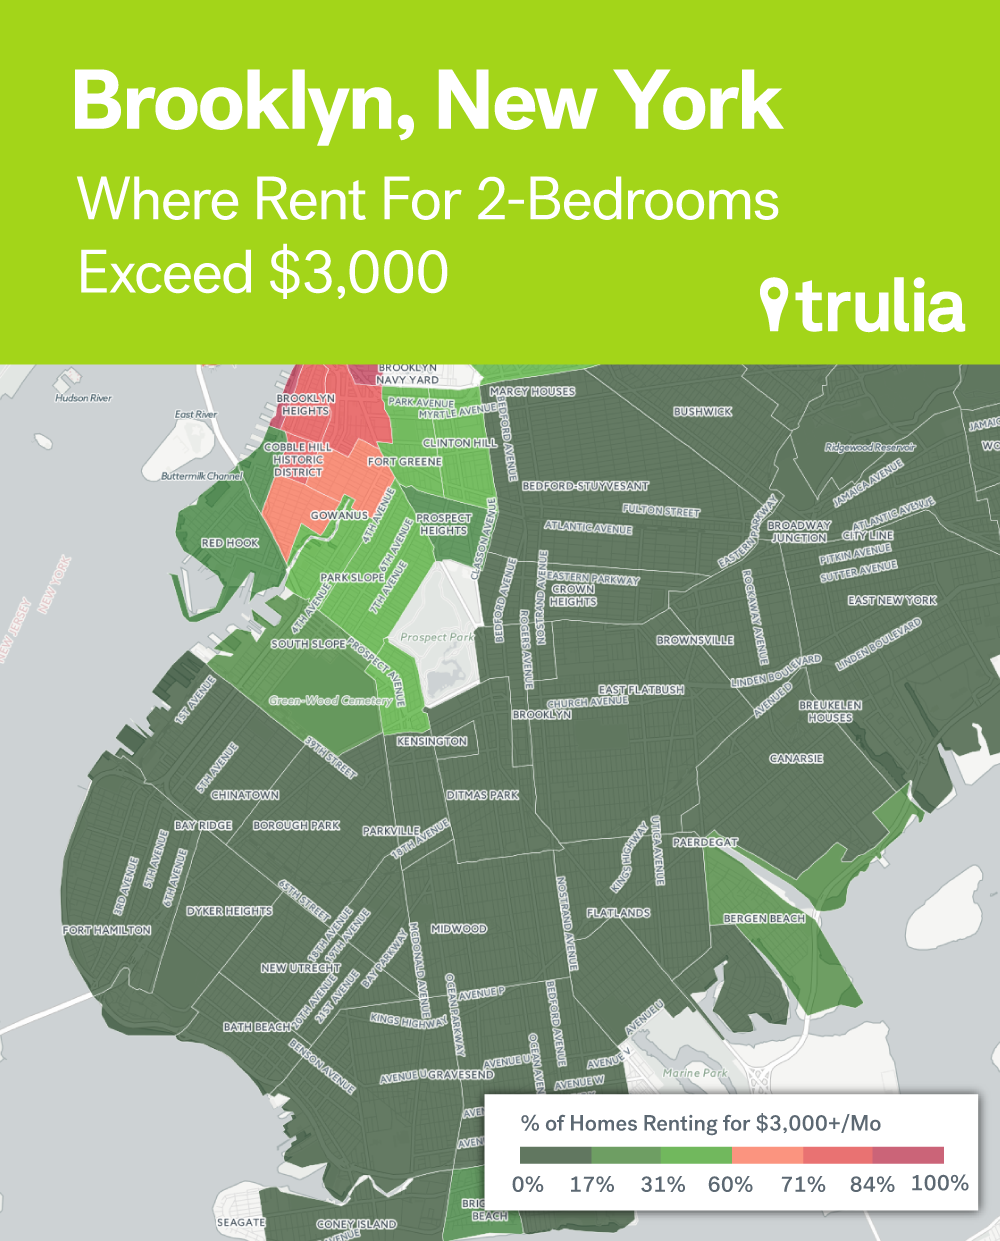
| Brooklyn Neighborhoods with the Most Expensive 2-Bedroom Rentals | |||
| # | Neighborhood | % of 2-Bedrooms Renting for More than $3,000 | Median Rent |
| 1 | Vinegar Hill | 97.9% | $5,435 |
| 2 | Downtown/DUMBO | 90.7% | $4,200 |
| 3 | Cobble Hill | 87.9% | $3,800 |
| 4 | Brooklyn Heights | 85.9% | $4,495 |
| 5 | Boerum Hill | 77.6% | $3,600 |
| 6 | Carroll Gardens | 66.5% | $3,500 |
| 7 | Greenpoint | 62.1% | $3,350 |
| 8 | Fort Greene | 59.0% | $3,350 |
| 9 | Gowanus | 53.2% | $3,100 |
| 10 | Williamsburg | 47.9% | $3,000 |
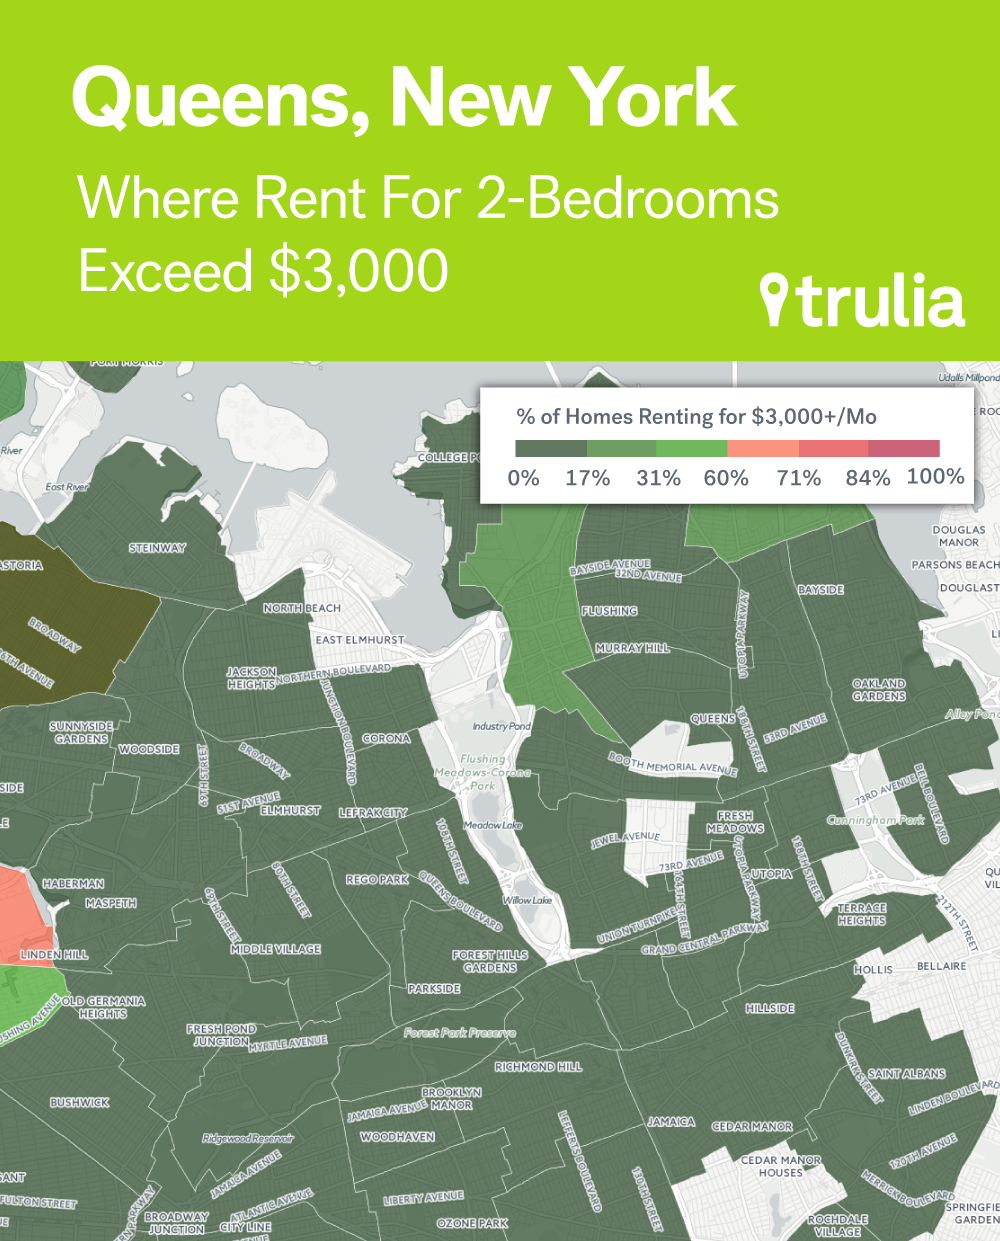
| Queens Neighborhoods with the Most Expensive 2-Bedroom Rentals | |||
| # | Neighborhood | % of 2-Bedrooms Renting for More than $2,500 | Median Rent |
| 1 | Astoria | 31.8% | $2,376 |
| 2 | Sunnyside | 26.9% | $2,325 |
| 3 | Rego Park | 25.7% | $2,325 |
| 4 | Clearview | 25.6% | $2,100 |
| 5 | Ditmars Steinway | 24.0% | $2,300 |
| 6 | Forest Hills | 21.1% | $2,300 |
| 7 | Flushing | 15.8% | $2,100 |
| 8 | Kew Gardens | 13.2% | $2,100 |
| 9 | Woodside | 12.4% | $2,175 |
| 10 | Jackson Heights | 10.2% | $2,063 |
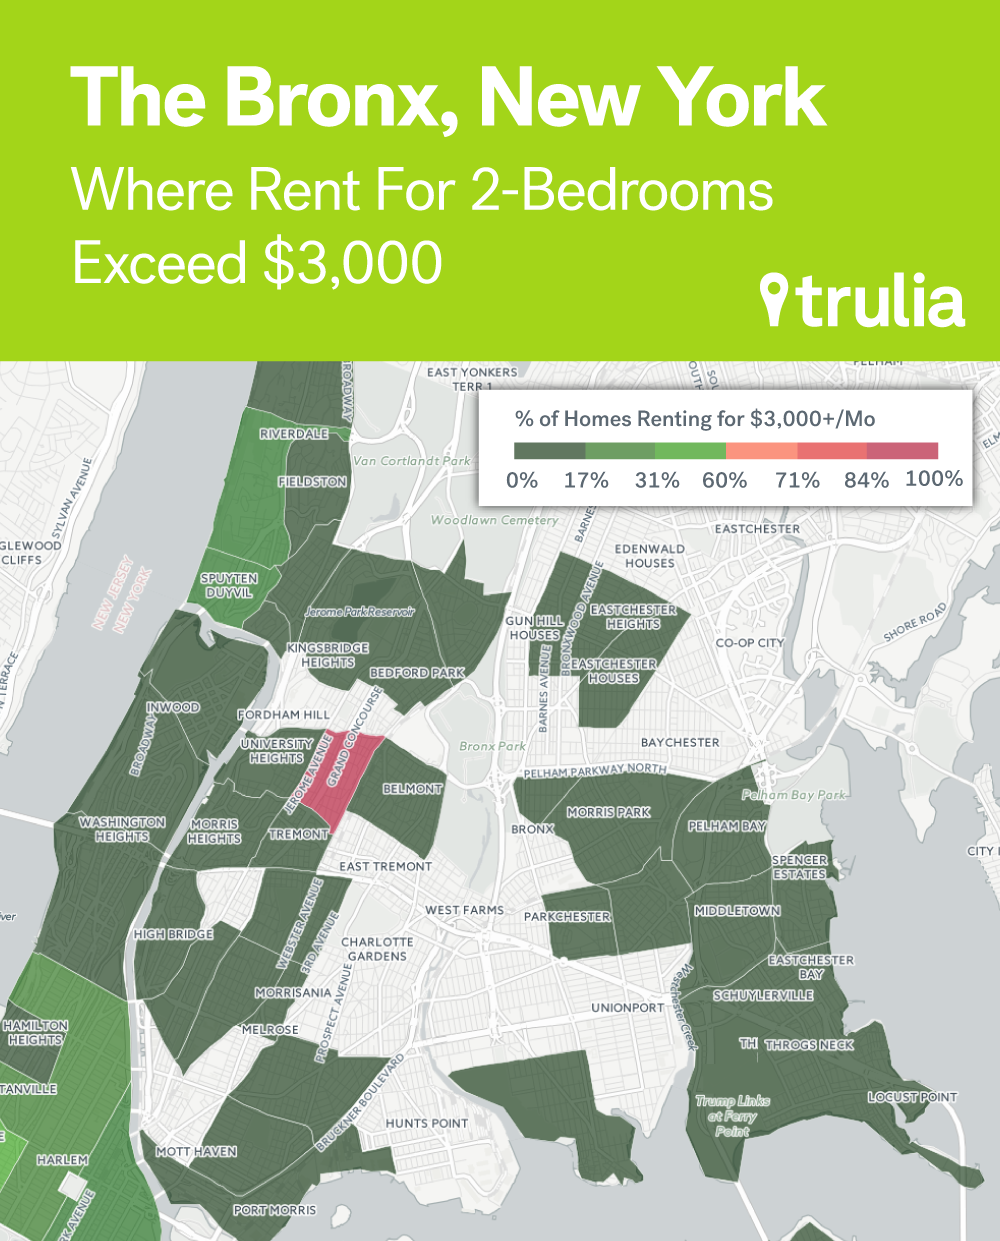
| Bronx Neighborhoods with the Most Expensive 2-Bedroom Rentals | |||
| # | Neighborhood | % of 2-Bedrooms Renting for More than $2,500 | Median Rent |
| 1 | Spuyten Duyvil | 57.7% | $2,700 |
| 2 | Riverdale | 38.6% | $2,400 |
| 3 | Kingsbridge | 20.2% | $1,863 |
| 4 | Fieldston | 13.3% | $2,100 |
| 5 | Throgs Neck – Edgewater Park | 6.7% | $1,700 |
| 6 | North Riverdale | 6.4% | $1,900 |
| 7 | Woodstock | 2.1% | $1,450 |
| 8 | Mount Hope | 1.0% | $1,530 |
| 9 | Belmont | 0.0% | $1,500 |
| 10 | Bronxdale | 0.0% | $1,660 |
Boston – 2-Bedroom Units
The median cost of a 2-bedroom rental in Boston is $2,845. Chinatown / Leather District (87.6%) came out on top of the list of the most expensive 2-bedroom rentals, followed by Downtown (79.1%) and Back Bay (75.4%). (Click here to see and get the embed code for interactive versions of the Boston map below.)
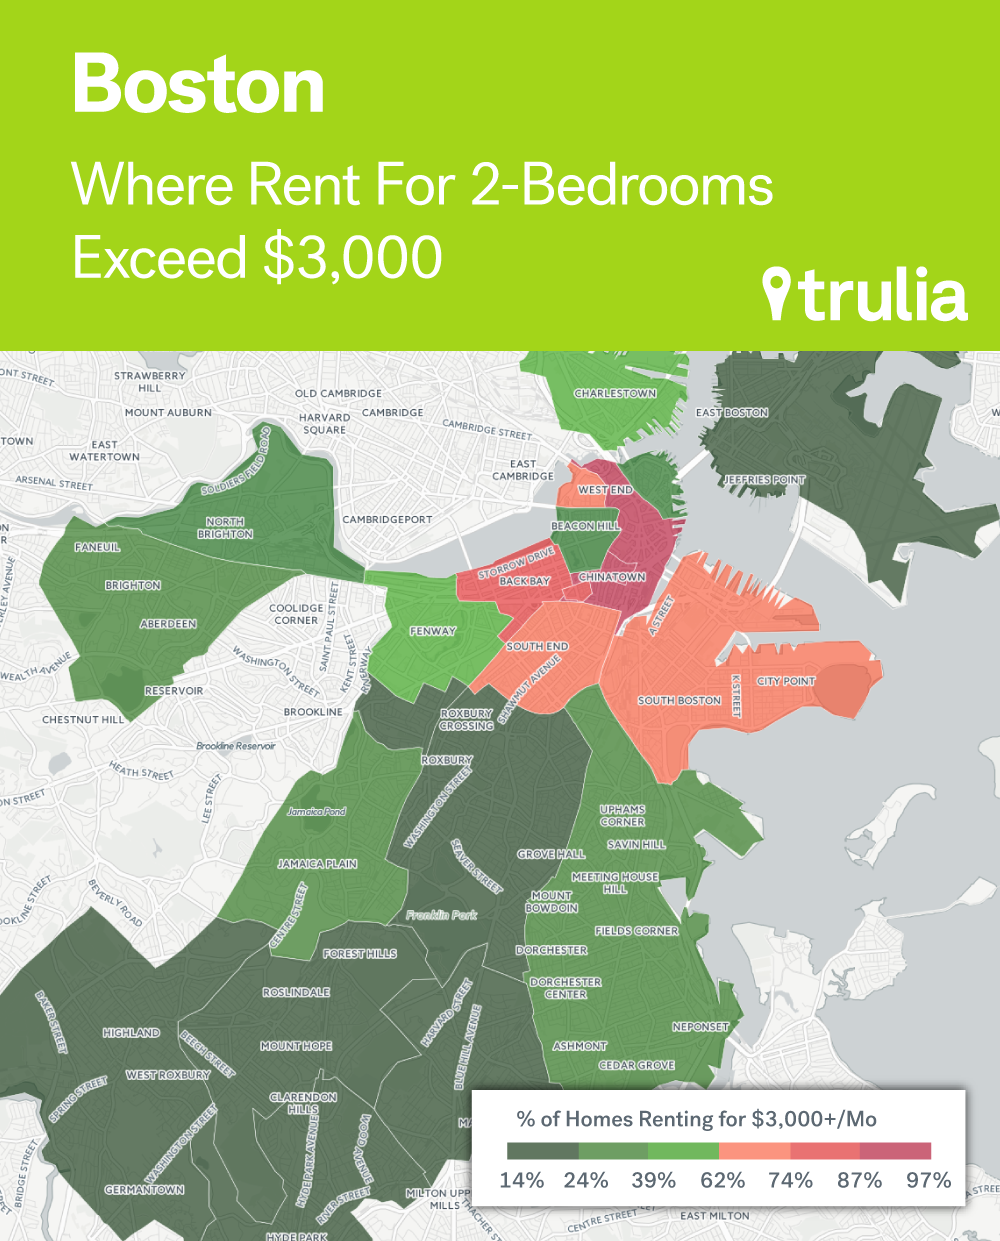
| Boston Neighborhoods with the Most Expensive 2-Bedroom Rentals | |||
| # | Neighborhood | % of 2-Bedrooms Renting for More than $3,000 | Median Rent |
| 1 | Chinatown / Leather District | 87.6% | $4,550 |
| 2 | Downtown Boston | 79.1% | $3,878 |
| 3 | Back Bay | 75.4% | $3,650 |
| 4 | Bay Village | 59.1% | $3,300 |
| 5 | South End | 56.7% | $3,175 |
| 6 | West End | 56.5% | $3,080 |
| 7 | South Boston | 37.2% | $2,800 |
| 8 | Fenway-Kenmore | 36.3% | $2,820 |
| 9 | Charlestown | 34.2% | $2,800 |
| 10 | Allston | 27.0% | $2,400 |
Washington, D.C. – 2-Bedroom Units
In Washington, D.C., the median cost of a 2-bedroom rental is $2,700 and Georgetown (76.0%) came out on top in our analysis, followed by West End (74.0%) and Downtown (73.6%). Georgetown and West End were not among the top three neighborhoods in our 1-bedroom analysis. These two neighborhoods came out on top in our 2-bedroom analysis because many luxury properties in these neighborhoods tend to be larger in size (2+ units) and command a higher premium over smaller units. (Click here to see and get the embed code for interactive versions of the Washington, D.C. map below.)
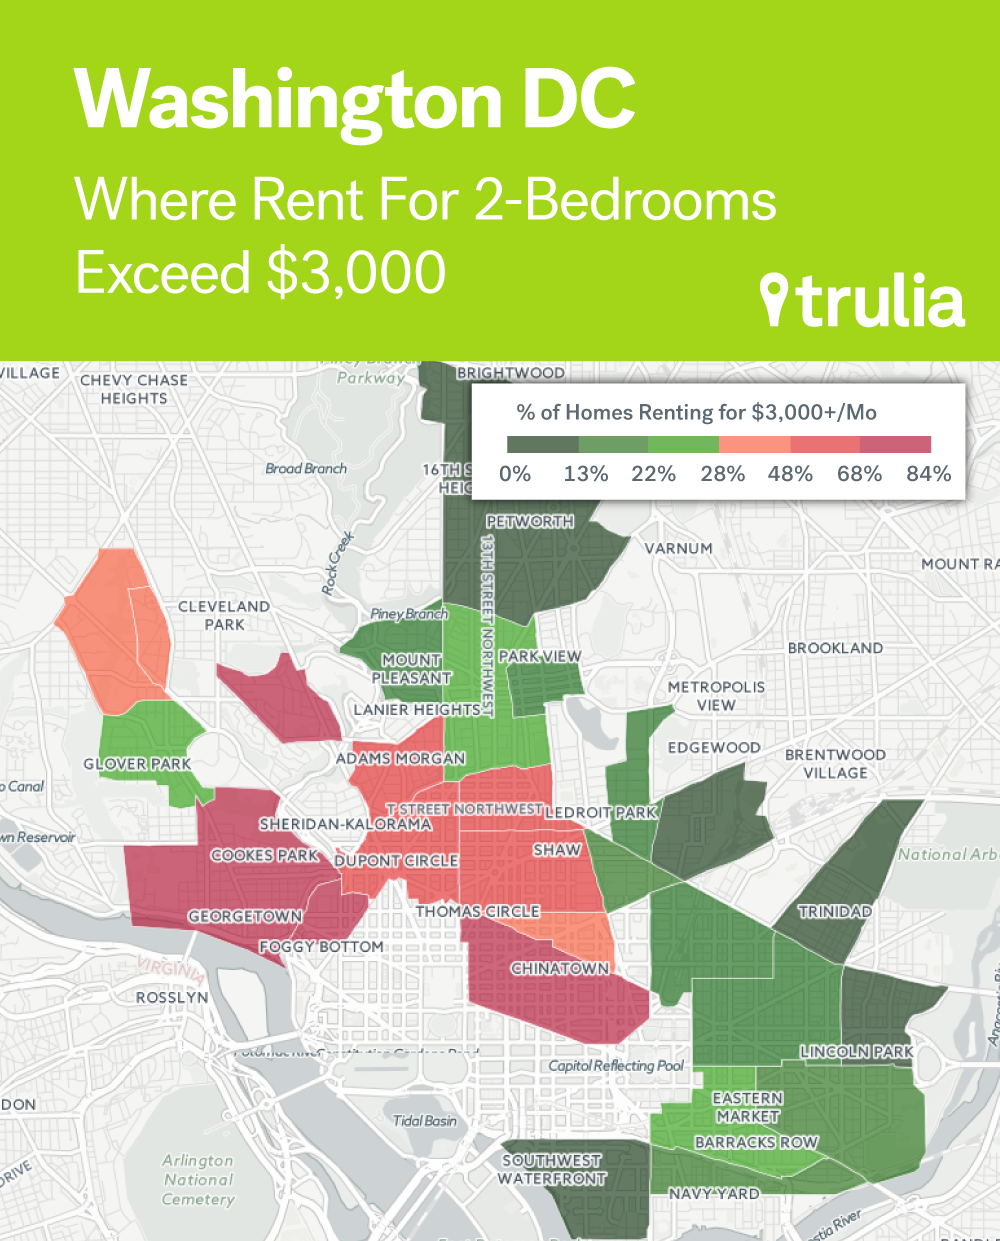
| Washington, D.C. Neighborhoods with the Most Expensive 2-Bedroom Rentals | |||
| # | Neighborhood | % of 2-Bedrooms Renting for More than $3,000 | Median Rent |
| 1 | Georgetown | 76.0% | $3,500 |
| 2 | West End | 74.0% | $3,550 |
| 3 | Downtown | 73.6% | $3,300 |
| 4 | Woodley Park | 60.0% | $3,200 |
| 5 | Logan Circle- Shaw | 56.5% | $3,195 |
| 6 | Cardozo – Shaw | 55.8% | $3,100 |
| 7 | Dupont Circle | 48.1% | $3,000 |
| 8 | Adams Morgan | 44.6% | $3,000 |
| 9 | Mount Vernon Square | 42.3% | $2,995 |
| 10 | Cathedral Heights | 41.2% | $2,950 |
Los Angeles – 2-Bedroom Units
Ranking for 2-bedroom units is similar to that for 1-bedroom units in Los Angeles, though the median price for a 2-bedroom is higher than a 1-bedroom at $2,695. Century City (84.1%) ranked highest, followed by Beverly Center (76.7%) and Downtown Los Angeles (70.0%). (Click here to see and get the embed code for interactive versions of the Los Angeles map below.)
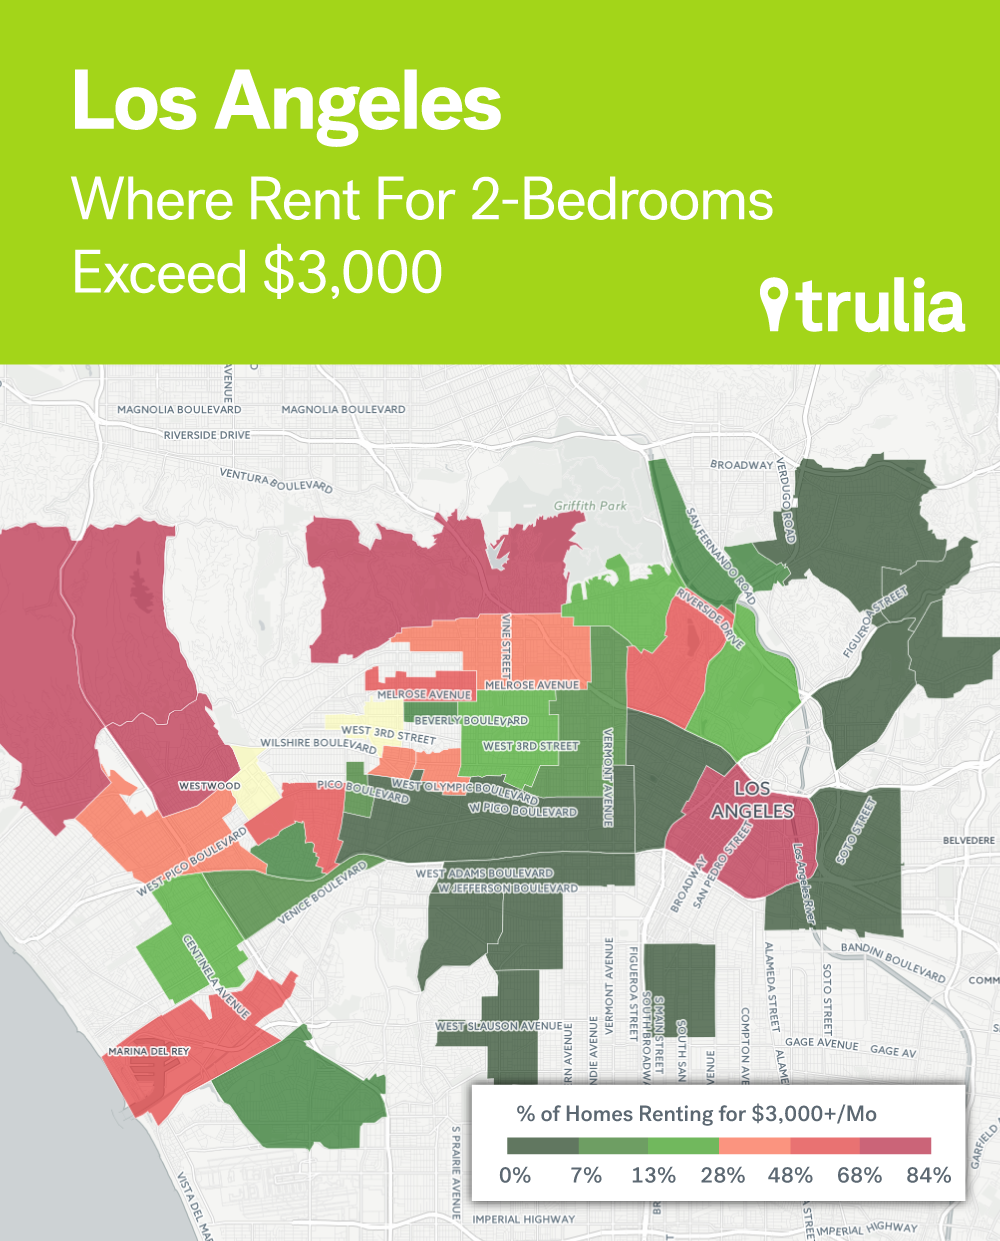
| Los Angeles Neighborhoods with the Most Expensive 2-Bedroom Rentals | |||
| # | Neighborhood | % of 2-Bedrooms Renting for More than $3,000 | Median Rent |
| 1 | Century City | 84.1% | $3,985 |
| 2 | Beverly Center | 76.7% | $3,688 |
| 3 | Downtown Los Angeles | 70.0% | $3,525 |
| 4 | Bel Air | 67.7% | $3,500 |
| 5 | Brentwood | 67.1% | $3,550 |
| 6 | Westwood | 63.0% | $3,500 |
| 7 | Hollywood Hills | 60.0% | $3,800 |
| 8 | Beverlywood | 50.0% | $3,025 |
| 9 | Marina Del Rey | 46.7% | $2,973 |
| 10 | Silver Lake | 46.4% | $2,995 |
Buying a home in these major cities, as we have learned, is not cheap. However, renting in these big cities, particularly in expensive neighborhoods that are close to a city center, is not cheap either. Affordable housing in both the for-sale and rental markets has become incredibly scarce in desirable neighborhoods in urban centers.
