The latest Census data shows homeownership is still falling for young adults, and the National Association of Realtors (NAR) reports that the share of first-time home-buyers is slipping. While the housing market is clearly improving, with four of the five key indicators of the housing recovery from our Housing Barometer at least halfway back to normal, it looks like the recovery is happening even without much improvement in first-time homeownership. Does that mean the housing recovery isn’t for real?
Not so fast. The official homeownership rate published by the Census gives a misleading picture of homeownership trends. In fact, homeownership among young adults is both on the rise and not too far off from where demographics say it should be. To see this, we did two things in this analysis: (1) account for changes in household formation to get a true measure of homeownership, and (2) adjust for longer-term demographic shifts to compare homeownership levels today with pre-bubble levels.
The answer: our “true” homeownership rate disagrees with the published homeownership rate, and shows that homeownership among young adults increased between 2012 and 2013 after hitting bottom in 2012. However, once we adjust for the huge demographic shifts among young adults – far fewer young adults are married or have kids than two or three decades ago – homeownership in 2013 was roughly at late-1990s levels. That means that the demographic shifts among young adults account for the entire decline in homeownership for 18-34 year-olds over the last twenty years. In other words, if the pre-bubble years of the late 1990s can be considered relatively normal, than today’s lower homeownership rate for young adults might be the new normal, thanks to demographic changes.
But that doesn’t mean all’s well. There may be longer-term damage to homeownership from the recession – but to the middle-aged, not millennials. Homeownership among 35-54 year-olds is lower today than before the housing bubble, even after accounting for demographic shifts. Here’s why.
Young Adult Homeownership Actually On the Rise
The published homeownership rate equals the share of households that own their home instead of rent. It does not, however, capture changes in whether people are dropping out of the housing market to live under someone else’s roof, like those millennials in their parents’ basement, who – in case you missed it – are for real. But if, say, people move out of their parents’ homes and into their own rental apartments, the published homeownership rate would still be falling even if the share of young adults who own remains the same.
Instead, we looked at the true homeownership rate, which equals the number of owner-occupied households divided by the number of all adults; in contrast, the published homeownership rate equals the number of owner-occupied households divided by the number of all households. Of course, the true homeownership rate is always going to be much lower – by half or more – than the published homeownership rate because there are roughly twice as many adults as there are households. The key point, though, is that the published and true homeownership rates can move in different directions if the number of adults per household is changing. That is, in fact, what happened during the recession and recovery (see note #1).
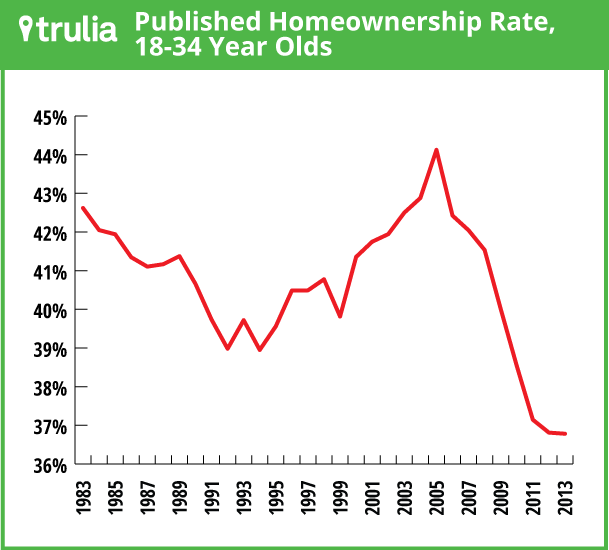
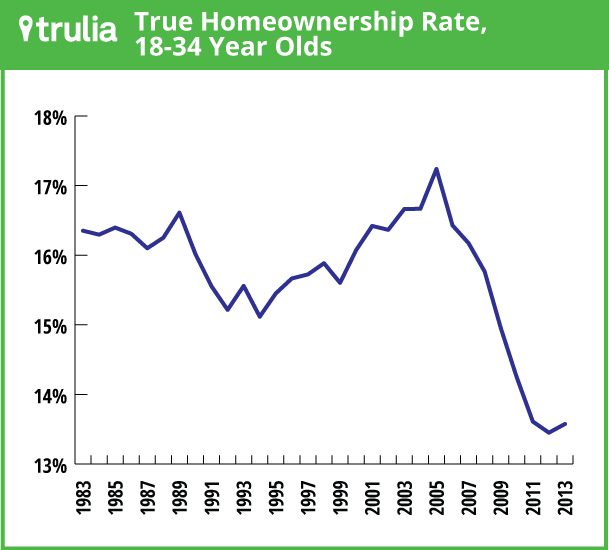
During the recession, as more young people moved in with their parents and fewer headed their own households, published homeownership rate fell from 44.1% in 2005 to 36.8% in 2012 – the 7-point decline was a 17% drop in homeownership. (What we’re calling “published” numbers actually differ slightly from the quarterly and annual homeownership estimates by age group published by the Census – see note #2.) However, the published rate understated the decline: the true homeownership rate for young adults fell from 17.2% in 2005 to 13.5% in 2012 – a drop of 22%.
Then, during the recovery, more young people started to form their own households, primarily as renters. The additional renters pushed the published homeownership rate for 18-34 year-olds down further in 2013 to its lowest level since our analysis begins in 1983:

But our true homeownership rate, which takes household formation into account, turned up slightly in 2013. It’s still the second-lowest year historically, but the tide has turned.

The true and published homeownership rates diverged in 2013 because the headship rate – the share of young adults who head their own household – rose in 2013 back to the highest level since 2010. The headship rate is still low compared with during and before the bubble, but its recent increase must be taken into account in order to get the trend in homeownership right.
Is Today’s Millennial Homeownership Rate the New Normal?
With our true homeownership rate, we can now determine how much of today’s low homeownership level among millennials is due to longer-term demographic shifts or due to the recent recession. The demographics of 18-34 year-olds have changed dramatically over the past 30 years, between 1983 and 2013, such as:
- The percent married fell from 47% to 30%
- The percent living with their own children fell from 39% to 29%
- The percent non-Hispanic white fell from 78% to 57%
Each of these demographic shifts is a headwind for homeownership. Young people who are married, have children, or are non-Hispanic white are more likely to own a home than among young people who aren’t.
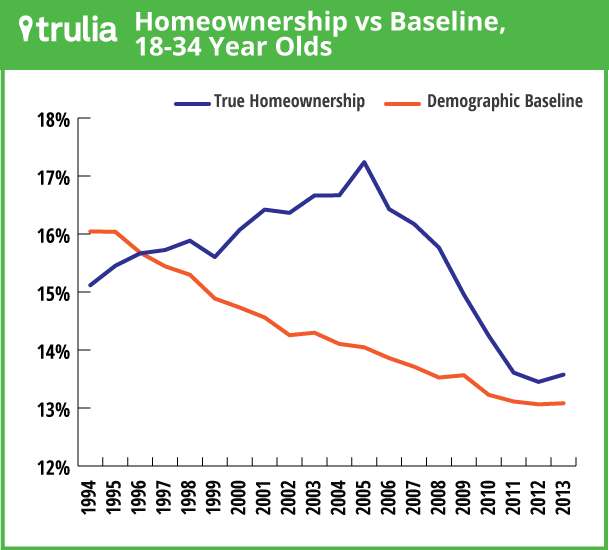
One way to quantify the total effect of these demographic factors on homeownership is to predict what might have happened to homeownership with these demographic shifts if none of the changes in behaviors or circumstances that evolved during the bubble, recession, and recovery took place. In other words, pick a baseline time period for a regression analysis – such as the years just before the bubble started (1994-1999) – and estimate what would have happened to homeownership if the likelihood of owning a home for someone with particular demographics in the baseline time period stayed constant and were applied to the actual demographic shifts that really happened (e.g., fewer people getting married, having kids, being non-Hispanic white; see note #3). This “demographic baseline” shows that demographics alone would have predicted a steady decline in the true homeownership rate over the past two decades, from 16.0% in 1994 to 13.1% in 2013 – a drop of 18%.

As we saw above, the true homeownership rate among young adults rose from 1994 to 2005 – bucking the demographic baseline – then fell sharply until 2012 before turning up slightly in 2013. Surprisingly, this means that homeownership in 2013 was still actually a bit above the demographic baseline – which implies that that the overall drop in homeownership for young adults in the past 20 years can be explained by demographic trends alone. Of course, within those two decades the true homeownership rose thanks to easy credit during the bubble and then plunged during the recession, but the bigger point is that it plunged back down only to just above the underlying demographic baseline (see note #4).
In short: although the share of young adults who actually own a home remains considerably lower today (even with the uptick in 2013) than at any time since 1983, it is roughly at late 1990s levels after taking demographic shifts into account. Unless those long-term demographic trends reverse, there might be little room for young-adult homeownership to increase. You’d have to ignore demographic trends that pre-date the bubble to believe that young-adult homeownership will eventually return to its unadjusted pre-bubble levels.
This also implies that there probably hasn’t been a huge shift in millennials’ attitudes toward homeownership, either, since today’s millennials are roughly as likely to own homes as people with similar demographics two decades ago (see note #5).
Worry Instead About Middle-Aged Homeownership
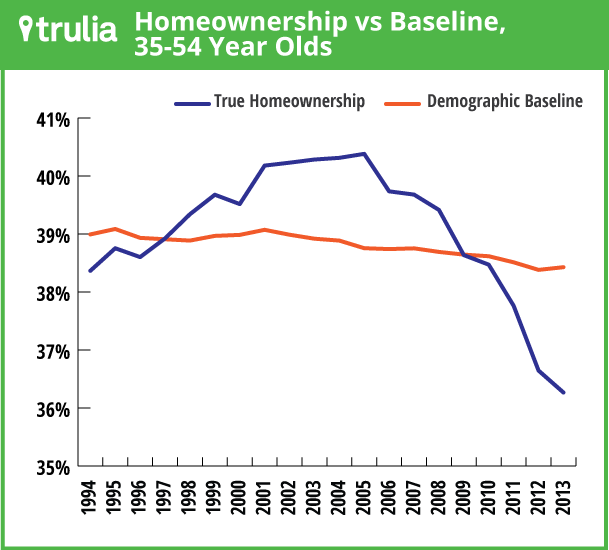
Here’s the surprise: it’s the middle-aged, not millennials, whose homeownership rate today looks lower than before the bubble. Using the same demographic-baseline analysis, the 2013 homeownership rate for 35-54 year-olds is below the “demographic baseline” (which barely budged over the past 20 years for this age group). Furthermore, homeownership for the middle-aged has not yet begun to turn around as of 2013, unlike for millennials:

Whereas the 2013 homeownership rate for millennials, after adjusting for demographics, is at 1997 levels, the 2013 demographics-adjusted homeownership rate for the middle-aged is at its lowest level in at least two decades (and probably in almost four decades: see note #6).
To see why homeownership is now lagging more among the middle-aged, we repeated the demographic-baseline analysis for five-year age bands. In 2005, the year when the true homeownership rate peaked for most age groups, 25-29 year-olds were the age group for which homeownership was highest relative to the demographic baseline, followed by 30-34 year-olds. These were first-time home-buyers getting easy credit for overpriced homes; then, they bore the brunt of the foreclosure crisis, losing their homes and wrecking their credit history. Eight years later, in 2013, 35-39 year-olds were the age group where homeownership was lowest relative to their demographic baseline; homeownership among 40-44, 45-49, and 50-54 year-olds was also low relative to baseline. Of course, 25-29 or 30-34 year-olds in 2005 grew into 35-39 year-olds in 2013: they are essentially the same people, eight years older.
And that’s the point: the rise and fall of homeownership during the housing bubble and bust is about people who are middle-aged today. The millennial generation was still in their early 20s or younger in the mid-2000s – too young to have bought during the bubble and then to have suffered a foreclosure: Only the oldest among the 18-34 year-old group in 2013 would have been of home-buying age during the bubble.
Turning more millennials into homeowners, therefore, may not be the missing piece of the housing recovery after all. Long-term demographic changes mean that homeownership among young adults is roughly where it should be. The real missing homeowners are the middle-aged.
Notes:
- The true homeownership rate equals the published homeownership rate times the headship rate, which is the number of households relative to the adult population. This post explains in more detail why the published homeownership rate can be misleading.
- All data in this post are based on the Current Population Survey’s Annual Social and Economic Supplement (ASEC). What we call the “published homeownership rate” in this post differs from published homeownership data in the Census Homeownership and Vacancy Survey (HVS) because the ASEC and HVS cover slightly different time periods and slightly different survey samples, even though both are based on the CPS. More importantly, we used a different approach for identifying head-of-household than published Census reports do. Whereas Census homeownership rates by age (and other demographics) reflect the demographics of the individual identified in the survey as the householder/head-of-household, we treated married couples where one is identified as head-of-household as co-heads, each weighted at 50%. This does not affect the published or true homeownership rate for all adults since each household still has one head, but it does affect the published and true homeownership rates for specific age groups. Until the early 1990s, the woman in a married-couple homeowner household was identified as the head-of-household less than 10% of the time; in 2013, it was nearly 40%. Because men are, on average, older than women in married couples, the male bias in head-of-household systematically understates the homeownership rate for young adults (e.g. if a 33-year-old woman is married to a 36-year-old man, and he is recorded as the head of household, the homeownership rate among 35-54 year-olds is overstated while the homeownership rate of 18-34 year-olds is understated). We estimate that this bias toward assigning head-of-household to husbands resulted in an understatement of the true homeownership rate among young adults by 10% in 1983 and 3% in 2013.
- The analysis requires making some judgment calls about which factors are longer-term demographic trends that would probably have happened regardless of the recession versus recession effects that are likely to reverse in the recovery. We include sex, age sub-groups, marital status, presence of children, race, ethnicity, and nativity (i.e., born in U.S. or abroad) as our demographics. We also include school enrollment and educational attainment as demographic factors, though that’s a tougher call since school enrollment tends to rise in recessions because people can’t find jobs. We did not include employment status or income because those are clearly affected by the recession. Some clear-cut demographic factors – like marital status and having children – are also affected by economic conditions, but the longer-term shifts pre-date the recession. We regress true homeownership on demographics for a single model covering 1994-1999; calculate predicted homeownership based on those coefficients applied to the entire sample 1994-2013; and report annual averages of predicted homeownership (the “demographic baseline”) and the true homeownership rate. The demographic-adjustment analysis begins in 1994, which is the earliest year that the ASEC includes all of the important demographic variables.
- Determining whether true homeownership is above or below the demographic baseline depends on which years are chosen as the baseline. As an alternative to using a baseline, we used all years 1994-2013 to estimate the trend in homeownership while stripping out the effect of changing demographics: it shows that young-adult homeownership in 2013 is back roughly to 1997 levels.
- The fact that the true homeownership rate for young adults is near the demographic baseline mean, more precisely, that the cumulative, aggregate effect of all non-demographic factors on homeownership is minimal. These non-demographic factors include changing economic circumstances, credit conditions, attitudes, and more. It’s possible that separate non-demographic factors moved in opposite directions, cancelling each other out. In reality, it’s unlikely that attitudes toward homeownership, say, improved while economic circumstances worsened, though possible.
- The full demographic adjustment for creating the demographic baseline is possible for years starting with 1994, when all demographic variables were available. The same analysis can be extended back historically if school enrollment and nativity are omitted from the list of demographics. It shows that the demographics-adjusted true homeownership rate for 35-54 year-olds was lower in 2013 than any other year since 1976.
- The data analyzed in this post were downloaded from the IPUMS CPS website, which requests to be cited as: Miriam King, Steven Ruggles, J. Trent Alexander, Sarah Flood, Katie Genadek, Matthew B. Schroeder, Brandon Trampe, and Rebecca Vick. Integrated Public Use Microdata Series, Current Population Survey: Version 3.0. [Machine-readable database]. Minneapolis: University of Minnesota, 2010.

