More than two-thirds of adults with children under 12 say that the neighborhood school district is among the most important considerations when choosing a home, according to a June 2013 Trulia survey. However, some parents factor schools into their housing choices differently. Nationally, 10% of school kids grades 1-12 attend private schools, and in some neighborhoods, the majority of kids go to private school.
In recognition of the back-to-school season, we analyzed where private school enrollment is high and low across the U.S. These geographic differences reveal why parents choose private or public schools for their kids.
For parents looking to move, knowing whether neighborhood kids go to private or public schools can help them decide where to live. First, a neighborhood’s level of private school enrollment signals whether you too might want to send your kids to private school if you lived there. Second, even if you plan to send your kids to public school, the share of neighborhood children in private schools affects whether most of the neighborhood kids will be at school with them.
Who Sends Their Kids to Private School
Let’s start with two essential facts about private schools, which explain a lot about who goes to private school:
- Essential fact #1: Just 20% of private school students attend non-sectarian schools; the other 80% are in religiously-affiliated private schools, of which half are Catholic.
- Essential fact #2: The cost of private schools is high, but varies widely. On average, tuition is almost $11,000, not counting discounts or scholarships. This ranges from $7,000 for Catholic schools and $9,000 for other religious schools to $22,000 for non-sectarian private schools. Tuition tops out at about $40,000 for the most expensive prep schools.
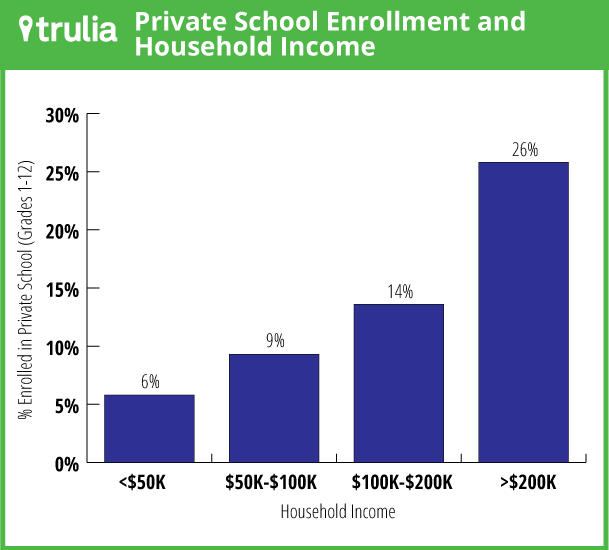
Given the high cost, kids from richer families are far more likely to go to private school than kids from poorer families. Only 6% of kids in households with incomes under $50,000 attend private schools, compared with 26% of kids in households with incomes of $200,000 or more.

Education level, race, and ethnicity matter too. Even adjusting for income, kids whose parents have a college or graduate degree are much more likely to go to private school. Furthermore, non-Hispanic Whites are more likely to attend private school than African-Americans, Asian-Americans, or Hispanics with the same household income and parental education level.
Since most private schools are religiously affiliated, shouldn’t religion matter as well? Sure enough, even after adjusting for income, education, race, and ethnicity, kids of Irish, Italian, or Polish ancestry—traditionally Catholic groups—are more likely to attend private school than kids of English, German, or Scandinavian ancestry (the Census does not ask about religion). Moreover, when we look at non-Census data on religious congregations, private school enrollment is significantly higher in counties that have a bigger share of Catholic, orthodox Jewish, or Amish congregants after adjusting for other demographic factors (most data in this post are from the Census; see note for data sources).
In short, kids are more likely to attend private school if their family is rich, highly educated, non-Hispanic White, Catholic, orthodox Jewish, or Amish. That makes private school attendance much more common in some places than others, as we’ll see next.
Where Private School Enrollment is Highest
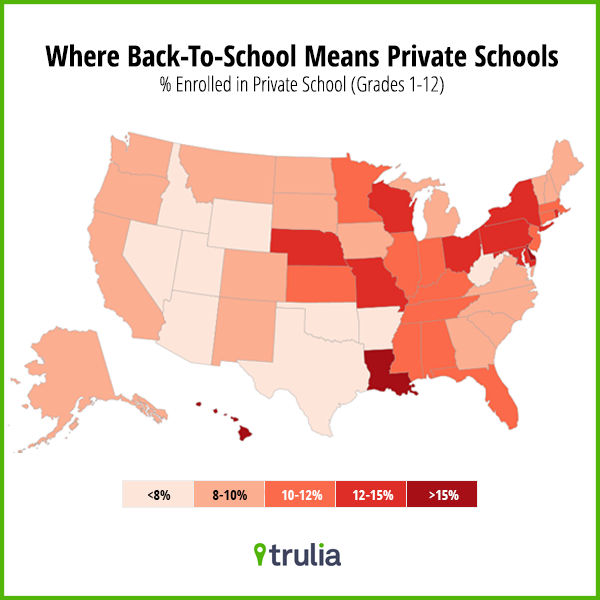
The factors that influence whether kids go to private school vary across the country. As a result, private school enrollment is a lot higher in Louisiana, Hawaii and the Mid-Atlantic states than in the Southwest and Mountain states.

These differences are even more striking at the metro level. Among the 100 largest U.S. metros, private school enrollment tends to be highest in places that are richer, more educated, and more Catholic, though less Hispanic, than the national average. Among the top 10 metros for private school enrollment, income is particularly high in Honolulu, San Francisco, Philadelphia, and Wilmington. New Orleans, Philadelphia, and Cleveland also have a high share of Catholics. Finally, in all of these metros except San Francisco, the Hispanic population share is low.
| Top 10 Metros with the Highest Private School Enrollment | ||
| # | U.S. Metro | Private school enrollment |
| 1 | New Orleans, LA | 25.1% |
| 2 | Honolulu, HI | 20.7% |
| 3 | San Francisco, CA | 19.9% |
| 4 | Baton Rouge, LA | 19.1% |
| 5 | Philadelphia, PA | 18.4% |
| 6 | Wilmington, DE-MD-NJ | 17.6% |
| 7 | Cleveland, OH | 17.5% |
| 8 | Milwaukee, WI | 17.0% |
| 9 | Cincinnati, OH-KY-IN | 16.9% |
| 10 | St. Louis, MO-IL | 16.7% |
| Note: among 100 largest U.S. metros. Grades 1-12 only. | ||
Among smaller metros, two stand out for high private school enrollment: Lafayette, LA, and Lancaster, PA. Religion explains this. Lafayette has a large non-Hispanic, Catholic population, and Lancaster has the largest Amish population relative to its size among the largest 250 metros.
On the flip side, the 10 metros where private school enrollment is lowest are in the Southwest or West. All except Salt Lake City have large Hispanic populations—a reminder that private schools are popular among non-Hispanic Catholics, but not among Hispanic Catholics. Additionally, Fresno, El Paso, and Bakersfield are all relatively low income.
| Top 10 Metros with the Lowest Private School Enrollment | ||
| # | U.S. Metro | Private school enrollment |
| 1 | Fresno, CA | 3.7% |
| 2 | El Paso, TX | 4.3% |
| 3 | Bakersfield, CA | 4.6% |
| 4 | Las Vegas, NV | 5.5% |
| 5 | Riverside–San Bernardino, CA | 6.0% |
| 6 | Phoenix, AZ | 6.2% |
| 7 | Houston, TX | 6.2% |
| 8 | Salt Lake City, UT | 6.9% |
| 9 | San Antonio, TX | 7.2% |
| 10 | Austin, TX | 7.2% |
| Note: among 100 largest U.S. metros. Grades 1-12 only. | ||
How Public School Quality Affects Private School Enrollment
Zooming to the neighborhood level, differences in private school enrollment become enormous. But be warned. Census sample sizes shrink for smaller geographic areas, so neighborhood-level averages have a larger margin of error. Still, neighborhood differences vary hugely and highlight the key factors behind private school enrollment.
Neighborhoods with extremely high private school enrollment include wealthy areas in big-city school districts. Examples include the Upper East Side of Manhattan, Upper Connecticut Avenue in Northwest Washington, DC, and several upscale neighborhoods in mid-size cities. In addition, the much lower-income, orthodox Jewish neighborhoods of Monsey, NY, and Lakewood, NJ, also have high private school enrollment. In several neighborhoods across the country with large Amish, Mormon, and other religious communities, private school enrollment is over 50%. New York’s Upper East Side, parts of Lancaster County, PA, and Colorado City, AZ, may have little else in common, but they are all communities where private school is the norm.
| Neighborhoods with High Private School Enrollment | ||||
| # | ZIP code | Neighborhood | U.S. Metro | Private school enrollment |
| 1 | 10952 | Monsey | New York, NY-NJ | 86% |
| 2 | 64113 | Armour Hills | Kansas City, MO-KS | 81% |
| 3 | 08701 | Lakewood | Edison–New Brunswick, NJ | 78% |
| 4 | 19807 | Greenville | Wilmington, DE-MD-NJ | 78% |
| 5 | 70124 | Lake View | New Orleans, LA | 77% |
| 6 | 20008 | Upper Connecticut Ave | Washington, DC-VA-MD-WV | 73% |
| 7 | 38028 | Eads | Memphis, TN-MS-AR | 73% |
| 8 | 10128 | Upper East Side (80s/90s) | New York, NY-NJ | 72% |
| 9 | 37215 | Green Hills / Forest Hills | Nashville, TN | 72% |
| 10 | 11516 | Cedarhurst | Long Island, NY | 70% |
| Note: among Census ZIP Code Tabulation Areas (ZCTA’s) reporting at least 1000 students enrolled in grades 1-12 across both public and private schools. Small sample sizes mean that differences may not be statistically significant. | ||||
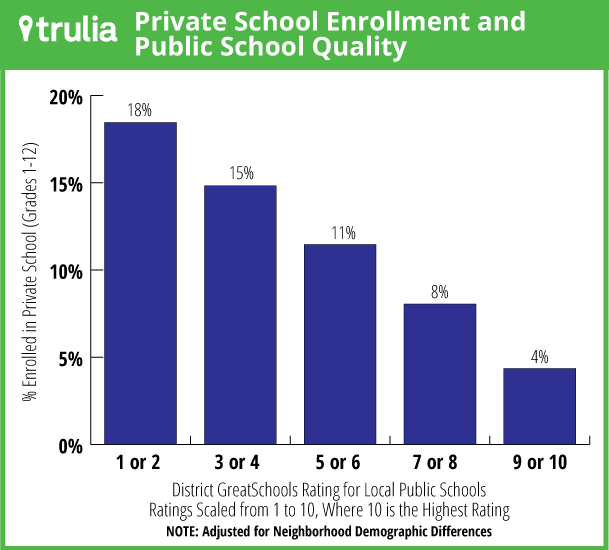
There’s a very important driver of private school enrollment that we haven’t mentioned yet: public school quality. Among neighborhoods with similar demographics in the same metro, private school enrollment is much higher in neighborhoods with lower public school GreatSchools ratings. (You can search for homes in neighborhoods with high GreatSchools ratings on Trulia’s website.) To see this, you have to adjust for demographic differences. Without that adjustment, private school enrollment looks roughly the same in neighborhoods with better and worse GreatSchools ratings. But that’s because neighborhoods with higher-rated public schools tend to have richer families and better-educated parents, exactly the kinds of people more likely to send their kids to private schools.
How much does public school quality matter for private school enrollment? A whole lot. In ZIP codes in top-rated school districts (those with GreatSchools ratings of 9 or 10 on a 1-to-10 scale), just 4% of kids go to private school, after adjusting for neighborhood demographics, versus 18% of kids in districts rated 1 or 2. Just so that’s completely clear: Private school enrollment in the lowest-rated school districts is more than four times as high as private school enrollment in the highest-rated school districts after adjusting for neighborhood demographic differences.

One final point: even after adjusting for neighborhood demographics and school quality (using both the GreatSchools rating and our “backpack-to-stroller” ratio, which suggests where parents move when their kids reach school age), private school enrollment is higher in neighborhoods with greater income inequality. It would take a lot more analysis to know what’s behind that. It’s possible though that private schools are a way for some parents to avoid public schools with greater income diversity. We’ll let someone else take up that delicate question.
Time To Do the Math: Do Private Schools or Great Public School Districts Cost More?
Even for parents committed to sending their kids to public schools, neighborhood private school enrollment matters. Remember that the types of neighborhoods that have great public schools tend to have richer families. These families often send kids to private schools even if the public schools are top rated. Many parents want a great public school that neighborhood kids actually go to. So let’s call out 10 ZIP codes with low private school enrollment, but where families have higher incomes, parents are highly educated, and the school district has an average GreatSchools rating of 8 or more (This list is for illustration only because small sample sizes mean high margins of error.)
| Upscale Neighborhoods Where Kids Go to Public Schools | |||||
| # | ZIP code | Neighborhood | U.S. Metro | Private school enrollment | Median asking price per SQFT |
| 1 | 10514 | Chappaqua | New York, NY-NJ | 2% | $326 |
| 2 | 11753 | Jericho | Long Island, NY | 2% | $340 |
| 3 | 08536 | Plainsboro | Edison–New Brunswick, NJ | 3% | $202 |
| 4 | 01719 | Boxborough | Middlesex County, MA | 4% | $185 |
| 5 | 02466 | Auburndale | Middlesex County, MA | 4% | $354 |
| 6 | 60564 | Naperville | Chicago, IL | 4% | $155 |
| 7 | 07028 | Glen Ridge | Newark, NJ-PA | 5% | $243 |
| 8 | 01778 | Wayland | Middlesex County, MA | 5% | $288 |
| 9 | 77094 | Eldridge- Green Trails | Houston, TX | 6% | $131 |
| 10 | 01730 | Bedford | Middlesex County, MA | 6% | $308 |
| Note: among Census ZIP Code Tabulation Areas (ZCTA’s) reporting at least 1000 students enrolled in grades 1-12 across both public and private schools; with median family income among families with children over $100,000; college attainment among 25-44 year-olds over 75%; and GreatSchools ratings of 8 or more. Small sample sizes mean that differences may not be statistically significant. | |||||
These 10 ZIP codes have something important in common: Housing costs are above the national average of $136 per square foot, except for ZIP code 77094 in Houston. In fact, homes in five of these 10 ZIP codes cost at least twice the national average. Neighborhoods with public schools that parents choose to send their kids to even though they could afford private schools just don’t come cheap.
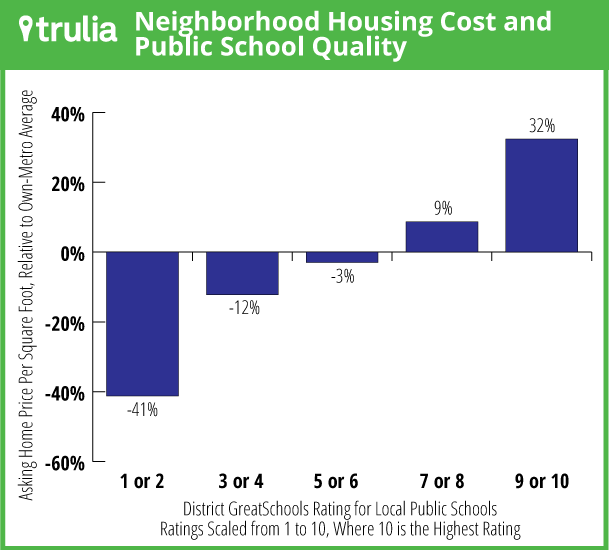
So how should you weigh the high housing costs in great public school districts against the cost of private school tuition? The hard truth is that both can cost an arm and a leg. Looking first at public schools: Housing costs are much higher in better-rated school districts. In neighborhoods with average GreatSchools ratings of 1 or 2, the average asking price per square foot is 41% below the metro average. But in neighborhoods with ratings of 9 or 10, prices are 32% above the average. Them’s big differences.

Now, for private schools. Tuition averages $10,940, which equals 12 monthly payments of $912. Let’s put this in a housing context: Our Rent vs Buy calculator shows that a $300,000 house has an effective monthly cost (taking everything into account, including down payment, closing costs, eventual sales proceeds, and opportunity cost—see our methodology for more detail) of $1,326 per month, under all the baseline assumptions. In that sense, private school costs two-thirds as much per month as a pricier-than-average house.
Put another way: The effective monthly cost of a $300,000 house ($1,326/month) plus average private school tuition ($912/month) is $2,238/month. That is roughly equal to the effective monthly cost of a $520,000 house, according to our calculator. That’s a lot of extra house—or a neighborhood with much higher-rated public schools—if you’re not paying for private school.
For anyone trying to make these tradeoffs, the math needs to get personal. The cost of private school depends on the actual school you’re considering—whether it’s a modestly priced Catholic school or Manhattan’s elite Dalton School, which has a $40,220 price tag. The cost of living in a higher-rated school district depends on how much house you want: a 32% premium for a GreatSchools rating of 9 or 10 implies more extra dollars for a mansion than a cottage. The cost tradeoff also depends on how many kids you’re putting through private school. Our quick-and-dirty math assumes tuition for one.
Details aside, the fundamental point is that either private schools or great public schools can drive the math of housing costs. And even if you’re not able to or interested in sending your child to private school, the level of private school enrollment among your neighbors might affect your kid’s public school experience.
Notes
Most of the data in this post come from the Census. Household- and individual-level data are based on the 2012 5-Year American Community Survey (ACS) Public Use Microdata Sample (PUMS). ZIP Code Tabulation Area (ZCTA), county, metro, and state data on private school enrollment and demographics come from the 2012 5-Year ACS and 2010 Decennial Census summary tables. “Income” refers to median family income of families with children. “Educational attainment” refers to the share of adults age 25-44 with a bachelor’s or graduate degree.
Religious congregation data at the county and metro level come from the Association of Religion Data Archives. See this post for more detail about the religious congregation data.
Data on private school religious affiliation and average tuition come from the National Center for Education Statistics. Religious affiliation of private schools is from table 2 of this report. Tuition is from this table.
Home-price data are median asking prices per square foot among for-sale homes. The national figure is a weighted average of the ZIP code medians, weighted by total student enrollment.
Trulia’s “backpack-to-stroller” ratio equals the 5-to-9 year-old population divided by the 0-to-4 year-old population in a geographic area. See this post and this post for more detail.
The consumer survey question about the most important consideration when choosing a home was conducted online within the United States between June 24-26, 2013 among 2,029 adults (aged 18 and over), by Harris Interactive on behalf of Trulia via its Quick Query omnibus product. Figures for age, sex, race/ethnicity, education, region and household income were weighted where necessary to bring them into line with their actual proportions in the population.

