The Trulia Price Monitor and the Trulia Rent Monitor are the earliest leading indicators of how asking prices and rents are trending nationally and locally. They adjust for the changing mix of listed homes and therefore show what’s really happening to asking prices and rents. Because asking prices lead sales prices by approximately two or more months, the Monitors reveal trends before other price indexes do. With that, here’s the scoop on where prices and rents are headed.
Asking-Price Gains Have Been Slowing Down Since April 2013
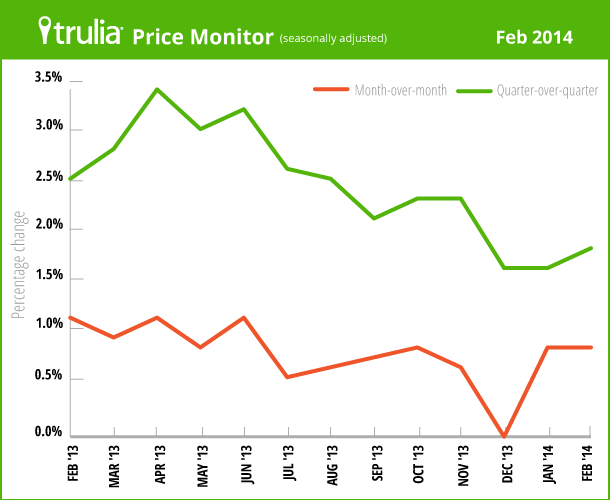
Nationally, asking home prices rose 10.4% year-over-year in February 2014, down slightly after peaking in November 2013. But the year-over-year change is an average of the past twelve months and therefore obscures the most recent trends in prices. Looking at quarter-over-quarter changes instead, it’s clear that price gains have been slowing for most of the last year: asking home prices rose just 1.9% in February – a rate similar to those recorded in January and December – compared with increases near 2.5% from July 2013 to November 2013 and over 3% from April 2013 to June 2013. The quarter-over-quarter change in asking prices topped out at 3.5% in April 2013 and now, at 1.9%, the increase is just over half of that peak.
But even with this slowdown in gains, prices are still rising much faster than the historical norm. The quarter-over-quarter increase in February of 1.9% implies an annualized rate of almost 8% – which is well above the long-term average.
|
February 2014 Trulia Price Monitor Summary |
|||
|
% change in asking prices |
# of 100 largest metros with asking-price increases |
% change in asking prices, excluding foreclosures |
|
| Month-over-month,
seasonally adjusted |
0.9% |
Not reported |
0.9% |
| Quarter-over-quarter,
seasonally adjusted |
1.9% |
87 |
1.8% |
| Year-over-year |
10.4% |
97 |
9.8% |
| * Data from previous months are revised each month, so data being reported now for previous months might differ from previously reported data. | |||
After Leading Price Recovery, Boom-and-Bust Markets Now Leading Price Slowdown
The 10 U.S. metros with the biggest year-over-year price increases in February 2014 all experienced a severe housing bust after the bubble popped (by “severe,” we mean a price drop from peak to trough of at least 30%, according to the Federal Housing Finance Agency index). Why? After prices fell in these markets, homes looked like bargains to investors and other buyers. At the same time, price drops also spurred foreclosures, which forced many families to become renters. Price drops and stronger rental demand together create the ideal conditions for investors to buy and rent out single-family homes, which helped boost home prices.
|
Biggest Year-over-Year Asking Price Increases, Feb 2014 |
|||
| # | U.S. Metro |
Y-o-Y % asking price change, Feb 2014 |
Price drop during bust, peak to trough (FHFA) |
| 1 | Las Vegas, NV |
30.3% |
-61% |
| 2 | Oakland, CA |
24.5% |
-39% |
| 3 | Riverside–San Bernardino, CA |
24.1% |
-50% |
| 4 | Sacramento, CA |
21.9% |
-48% |
| 5 | Los Angeles, CA |
18.9% |
-35% |
| 6 | Detroit, MI |
18.7% |
-40% |
| 7 | Warren–Troy–Farmington Hills, MI |
18.0% |
-37% |
| 8 | Fort Lauderdale, FL |
18.0% |
-48% |
| 9 | Ventura County, CA |
17.1% |
-38% |
| 10 | Orange County, CA |
16.9% |
-33% |
|
To download the list of asking home price changes for the largest metros: Excel or PDF. |
|||
Looking instead at quarter-over-quarter changes, to focus just on the most recent trend, we see home prices are starting to shake off the effects of the housing bust. Among the 10 metros with the biggest quarter-over-quarter price increases in February, four did not have a severe housing bust: Cleveland, Birmingham, San Francisco, and Akron. And as investor buying declines in 2014, the biggest price gains will increasingly be in markets that did not have a severe housing bust.
|
Biggest Quarter-over-Quarter Asking Price Increases, Feb 2014 |
|||
| # | U.S. Metro |
Q-o-Q % asking price change, Feb 2014 |
Price drop during bust, peak to trough (FHFA) |
| 1 | Cleveland, OH |
6.5% |
-18% |
| 2 | Birmingham, AL |
6.4% |
-12% |
| 3 | North Port–Bradenton–Sarasota, FL |
6.0% |
-50% |
| 4 | Las Vegas, NV |
5.7% |
-61% |
| 5 | Lakeland-Winter Haven, FL |
5.7% |
-46% |
| 6 | Oakland, CA |
5.6% |
-39% |
| 7 | San Francisco, CA |
5.2% |
-23% |
| 8 | Orlando, FL |
5.0% |
-48% |
| 9 | Akron, OH |
5.0% |
-16% |
| 10 | Riverside–San Bernardino, CA |
4.8% |
-50% |
| To download the list of asking home price changes for the largest metros: Excel or PDF. | |||
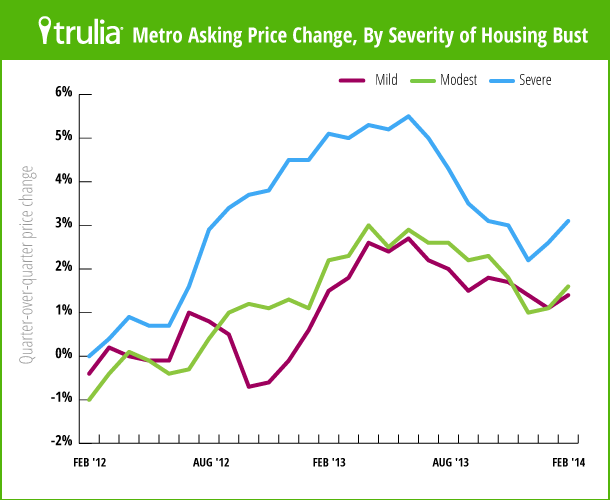
Grouping metros by their price declines during the bust shows that the price slowdown over the past 10 months has been sharpest in metros where the bust was most severe. While metros that had a mild (peak-to-trough price drops less than 15%) or modest (price drops 15-30%) housing bust have seen a gentle slowdown in price gains since last spring, the metros with a severe (price drops more than 30%) housing bust saw a sharp deceleration in price gains, downshifting from more than 5% between February and July 2013 to 3% or less in recent months. In short, the price slowdown has been driven by price changes in boom-and-bust metros, and prices gains in those markets have been slowing since last summer.
Rent Up 3.4% and Accelerating in Most Markets
In February, rents rose 3.4% year-over-year nationally. In 20 the 25 largest rental markets, February’s increase was larger than the year-over-year rent increase from three months earlier, in November. Rent increases are accelerating most in San Francisco, where they’re now up 14.7% year-over-year versus 9.4% three months ago, and in nearby Oakland, where the year-over-year rent increase has grown to 7.0% from 1.6% three months ago. Rents are still falling slightly in Philadelphia and Washington, DC.
|
Rent Trends in the 25 Largest Rental Markets |
||||
| # | U.S. Metro |
Y-o-Y % change in rents, Feb 2014 |
Y-o-Y % change in rents, Nov 2013 |
Difference in Y-o-Y % rent change, Feb 2014 vs Nov 2013 |
| 1 | San Francisco, CA |
14.7% |
9.4% |
5.3% |
| 2 | Seattle, WA |
9.9% |
8.3% |
1.7% |
| 3 | San Diego, CA |
9.8% |
9.4% |
0.4% |
| 4 | Portland, OR-WA |
9.7% |
10.2% |
-0.5% |
| 5 | Denver, CO |
9.3% |
6.3% |
2.9% |
| 6 | Atlanta, GA |
7.1% |
4.5% |
2.6% |
| 7 | Oakland, CA |
7.0% |
1.6% |
5.4% |
| 8 | Phoenix, AZ |
6.6% |
5.4% |
1.2% |
| 9 | Miami, FL |
6.5% |
6.0% |
0.5% |
| 10 | Orange County, CA |
4.5% |
3.1% |
1.4% |
| 11 | Chicago, IL |
4.3% |
4.0% |
0.3% |
| 12 | Houston, TX |
4.0% |
6.4% |
-2.4% |
| 13 | Dallas, TX |
3.8% |
5.6% |
-1.8% |
| 14 | New York, NY-NJ |
3.8% |
2.7% |
1.1% |
| 15 | Los Angeles, CA |
3.7% |
2.3% |
1.4% |
| 16 | Riverside–San Bernardino, CA |
3.6% |
3.0% |
0.6% |
| 17 | Minneapolis–St. Paul, MN-WI |
3.2% |
3.2% |
0.0% |
| 18 | Sacramento, CA |
3.1% |
2.0% |
1.1% |
| 19 | Tampa–St. Petersburg, FL |
2.8% |
2.0% |
0.8% |
| 20 | Baltimore, MD |
2.7% |
0.0% |
2.7% |
| 21 | Boston, MA |
1.6% |
0.5% |
1.1% |
| 22 | Las Vegas, NV |
1.0% |
2.0% |
-0.9% |
| 23 | St. Louis, MO-IL |
0.0% |
3.5% |
-3.5% |
| 24 | Philadelphia, PA |
-0.3% |
-0.6% |
0.3% |
| 25 | Washington, DC-VA-MD-WV |
-1.1% |
-1.8% |
0.8% |
| To download the list of rent changes for the largest metros: Excel or PDF. All numbers are rounded to one decimal place, so the final column might not equal the difference between the two columns to the left. | ||||
The next Trulia Price Monitor and Trulia Rent Monitor will be released on Thursday, April 10th.
How did we put this report together? To recap the methodology, the Trulia Price Monitor and the Trulia Rent Monitor track asking home prices and rents on a monthly basis, adjusting for the changing composition of listed homes, including foreclosures provided by RealtyTrac. The Trulia Price Monitor also accounts for the regular seasonal fluctuations in asking prices in order to reveal the underlying trend in prices. The Monitors can detect price movements at least three months before the major sales-price indexes do. Historical data are sometimes revised each month, and historical data in the current release are the best comparison with current data. Our FAQs provide all the technical details.


