This morning the U.S. Census released population estimates for 2012. Among large metros, Austin grew fastest in the past year:
|
Fastest Growing Large Metros |
||
| # | U.S. Metro | % Population Change, 2011-2012 |
| 1 | Austin, TX |
3.0 |
| 2 | Orlando, FL |
2.2 |
| 3 | Raleigh, NC |
2.2 |
| 4 | Houston, TX |
2.1 |
| 5 | Dallas–Fort Worth, TX |
2.0 |
| 6 | San Antonio, TX |
1.9 |
| 7 | Phoenix, AZ |
1.8 |
| 8 | Denver, CO |
1.8 |
| 9 | Charlotte, NC |
1.7 |
| 10 | Nashville, TN |
1.7 |
| Among metros with at least one million population. | ||
The slowest-growing large metros this past year were concentrated in the Midwest and upstate New York, with three – Cleveland, Buffalo, and Hartford – actually losing population. One “clobbered” metro, Detroit, is on the list of slowest-growing large metros: Several fast-growing metros were “clobbered” during the housing bust–which we define as having price drops of more than 30% peak-to-trough and a vacancy rate of at least 7% during the crisis, including Orlando and Phoenix. Another clobbered metro, Las Vegas, ranks 11th after Nashville in fastest population growth. Many of the fastest-growing metros, though, had a relatively mild housing crisis, like Austin, Raleigh, and Houston.
|
Slowest Growing Large Metros |
||
| # | U.S. Metro | % Population Change, 2011-2012 |
| 1 | Cleveland, OH |
-0.2 |
| 2 | Buffalo, NY |
-0.1 |
| 3 | Hartford, CT |
-0.1 |
| 4 | Rochester, NY |
0.0 |
| 5 | Pittsburgh, PA |
0.0 |
| 6 | Providence, RI |
0.1 |
| 7 | St. Louis, MO |
0.1 |
| 8 | Detroit, MI |
0.1 |
| 9 | Chicago, IL |
0.3 |
| 10 | Cincinnati, OH |
0.3 |
| Among metros with at least one million population. | ||
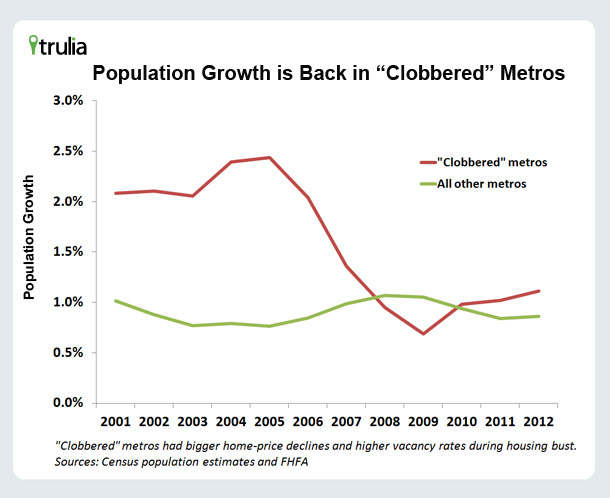
Overall, the clobbered metros–despite slow-growing Detroit–had faster population growth than other metros between 2011 and 2012. The clobbered metros grew 1.1%, compared with 0.9% in all other metros. In fact, 2012 is the third year that the clobbered metros have outpaced other metros in population growth. Looking back at a decade of population growth shows that “clobbered metros” grew more slowly than other metros in only two years, 2008 and 2009:
This chart shows that from 2001 to 2005, clobbered metros (which hadn’t been clobbered yet) grew much faster than other metros. Their growth rate started slipping in 2006 and 2007, then fell below that of other metros in 2008 and 2009, then grew slightly faster than other metros in 2010, and finally widened the gap in 2011 and 2012. In contrast, metros that weren’t clobbered by the housing crisis have had much steadier population growth through the housing bubble and bust.
The housing recovery has brought population growth back to the metros hardest-hit during the bust. But those clobbered metros today are growing nowhere near as fast as they did during the housing bubble.


