The financial crisis of 2008 created the biggest disruption to the U.S. housing market since the Great Depression. From the top of the housing bubble roughly a decade ago until just recently, there’s been a five percentage-point increase in the number of renters to owners to 43.3% from 38.5%. But who are these renters?
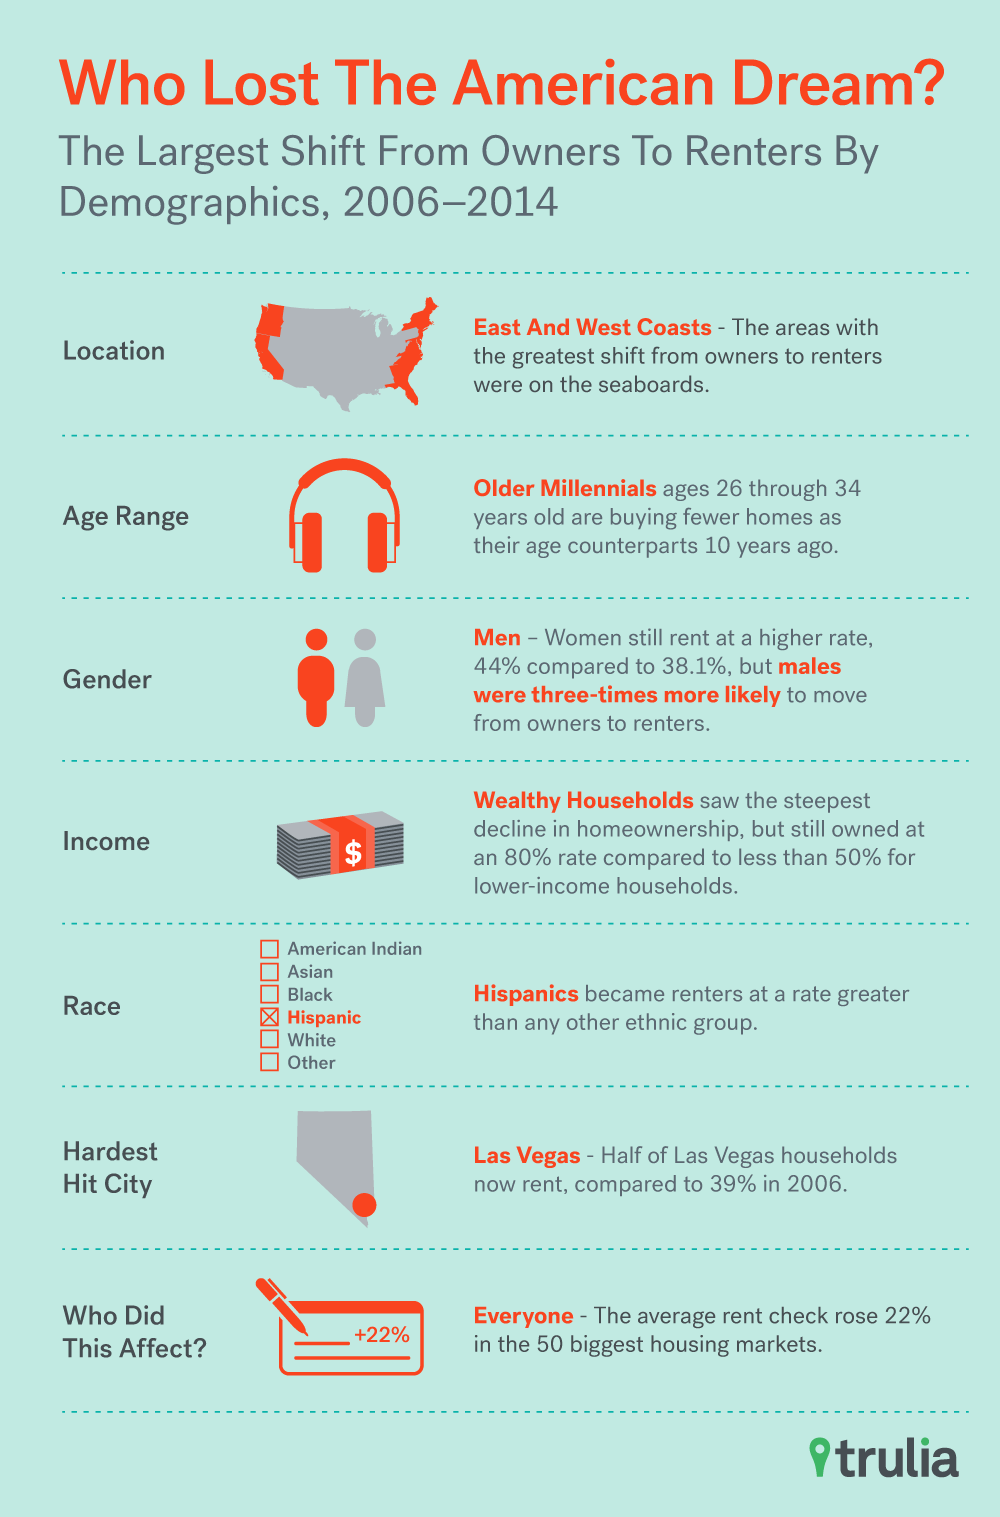
To get a clearer picture of who lost out on the American Dream of homeownership, we used the American Community Survey data from 2006 to 2014 to uncover who saw the biggest shift from being a homeowner to a renter by age, gender, race, and income in the 50 largest U.S. metros. We excluded eight cities due to data quality. Among the hardest hit were:
- Older Millennials. Young adults aged 26 to 34, historically the prime age group for first-time home buying, find themselves unable to make the leap from renters to homeowners.
- Even though women still rent at a higher rate, 44% compared to 38.1%, men were three-times more likely to move from owning to renting.
- Hispanic households. This racial group saw an increase at nearly twice the rate of Whites, African-Americans and Asians.
- Las Vegas, where the number of renting households jumped nine percentage points to 49.4% of all households in the nine years prior to 2015.
- Upper middle-class and wealthy The rate at which they shifted to renting from owning was greater than middle and lower income households. That’s in part because lower and middle-income households were already renting at significantly higher rates — homeownership among the wealthy remained above 80%, compared to less than 50% for poorer households.
- And finally, everyone. That’s because the average rent rose 22.3% in the 50 biggest housing markets (the cumulative rate of inflation for the period between 2006 and 2014 was 17.4%). Worse, the increase came at a time when the U.S. median household income (for the entire nation, not just the top 50 markets) fell 4.2%.
Ultimately, housing markets with larger spikes in foreclosures during the crisis were more likely to exhibit larger jumps in renting through that time period, especially in housing markets on the West and East Coasts. In fact, Las Vegas saw the number of renter households jump nine percentage points to 49.4% of all households in the nine years prior to 2015.
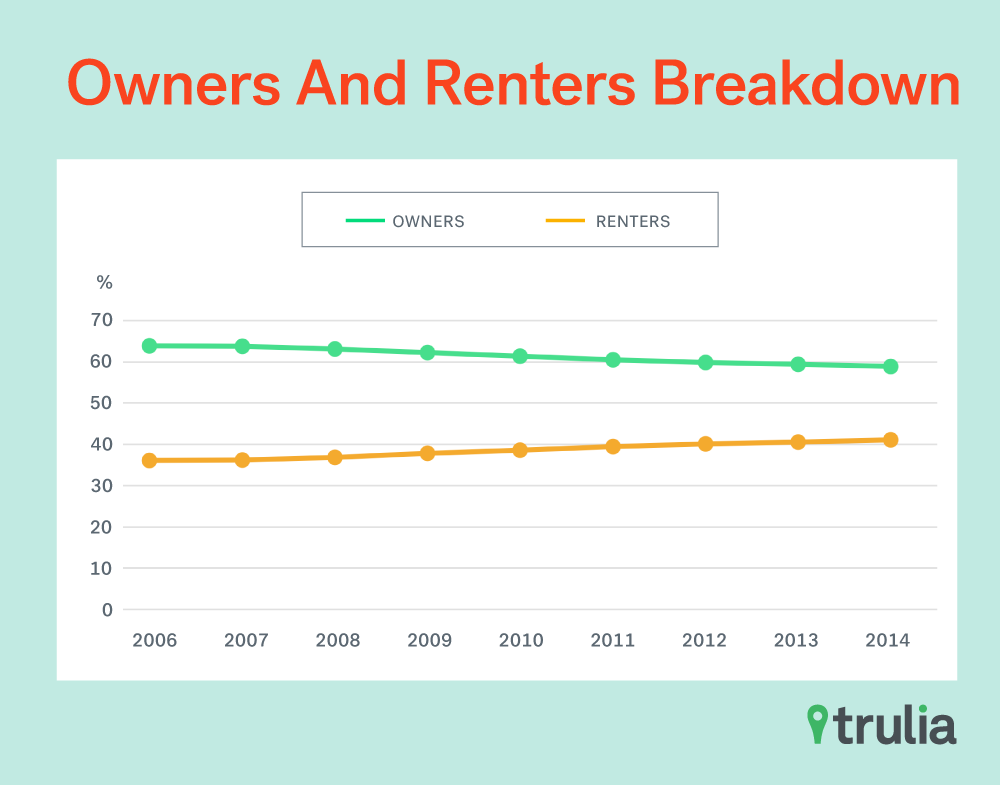
A Steady Decline in Homeownership and Increase in Renting
While America is still far from becoming a nation of renters, the percentage of renters in the 50 largest U.S. metros who rent rose from 36.1%, pre-crisis in 2006, to 41.1%, post-crisis 2014. This is a 5-percentage point jump. Meanwhile, homeownership declined 5 percentage points. More than half of the areas with the greatest shift from owners to renters were on the seaboards.
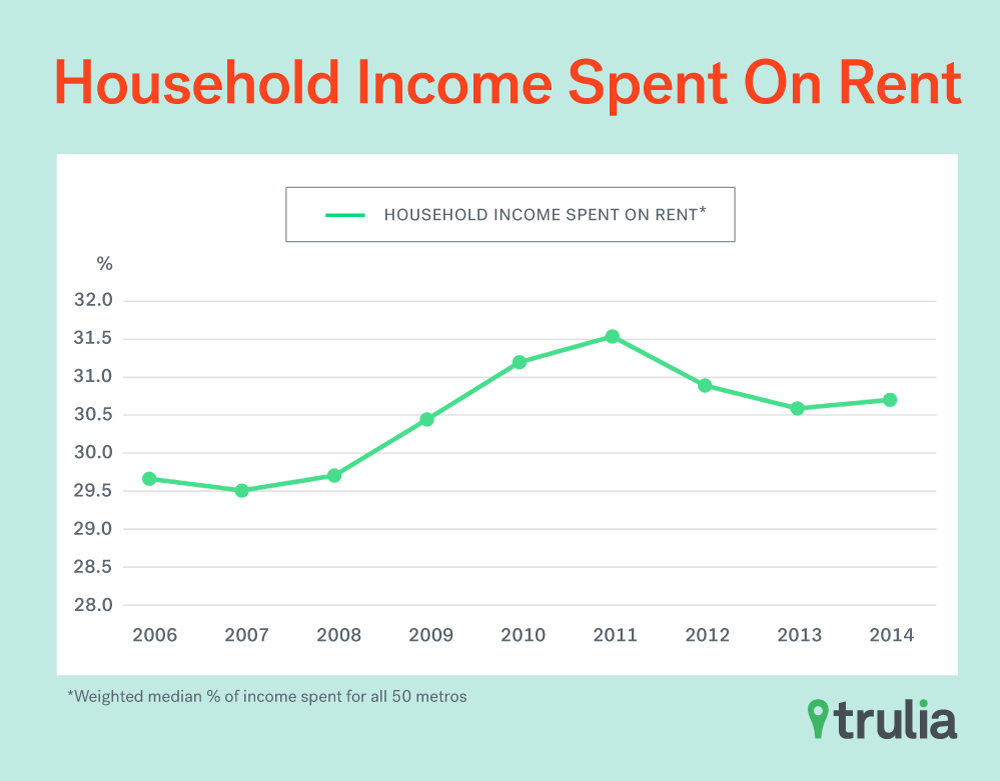
Not only are the percentage of renters increasing, so are the rents – which have risen faster than incomes. Average rents in the top 50 markets have risen 22.3%, while incomes nationally fell 5.8% in the nine years since 2006. To put this into context, a typical household spent just 29.7% of their income on rent in 2006. Since the economic crisis, this number peaked in 2011 at 31.5%, then fell slightly to 30.7% in 2014.
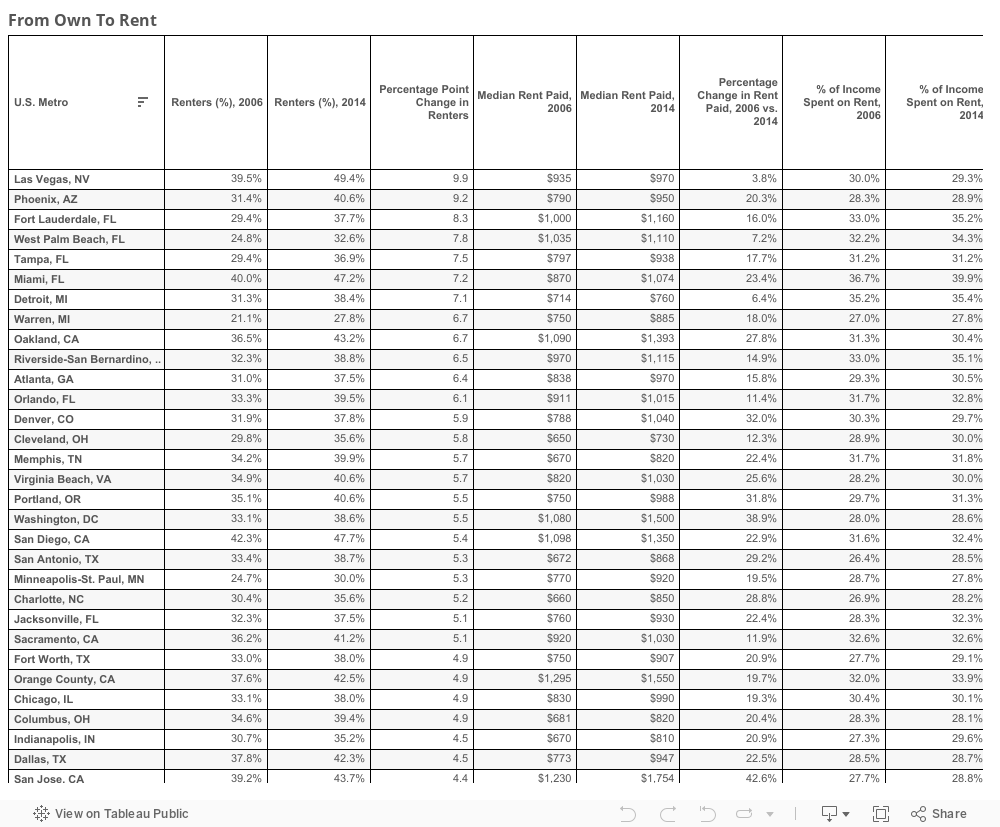
At the local level, we found that in 40 out of the 50 metros examined, households spent a larger fraction of their income towards paying rent than they did in 2006. At the most extreme, renters in Jacksonville, Fla., spent 32.3% of their income on rent – up 4 percentage points from 2006.
More Renters Where Foreclosures Struck Hardest
Each of the 50 largest metros that we examined in this study saw an increase in renters from 2006 to 2014. Many of these markets were hit hardest by foreclosures as homeowners became renters by circumstance. Las Vegas, which was the epicenter of the foreclosure crisis, had the biggest jump from 39.5% in 2006 to 49.4% in 2014 – rising 9.9 percentage points. It’s followed by Phoenix, Fort Lauderdale, Fla., West Palm Beach, Fla., and Tampa, Fla.
On the other hand, housing markets that were largely unaffected by the boom and bust of the recession saw the smallest increase in renters. This includes Buffalo, N.Y., Long Island, N.Y., Hartford, Conn., and Boston.
Young Adults Unable to Achieve American Dream
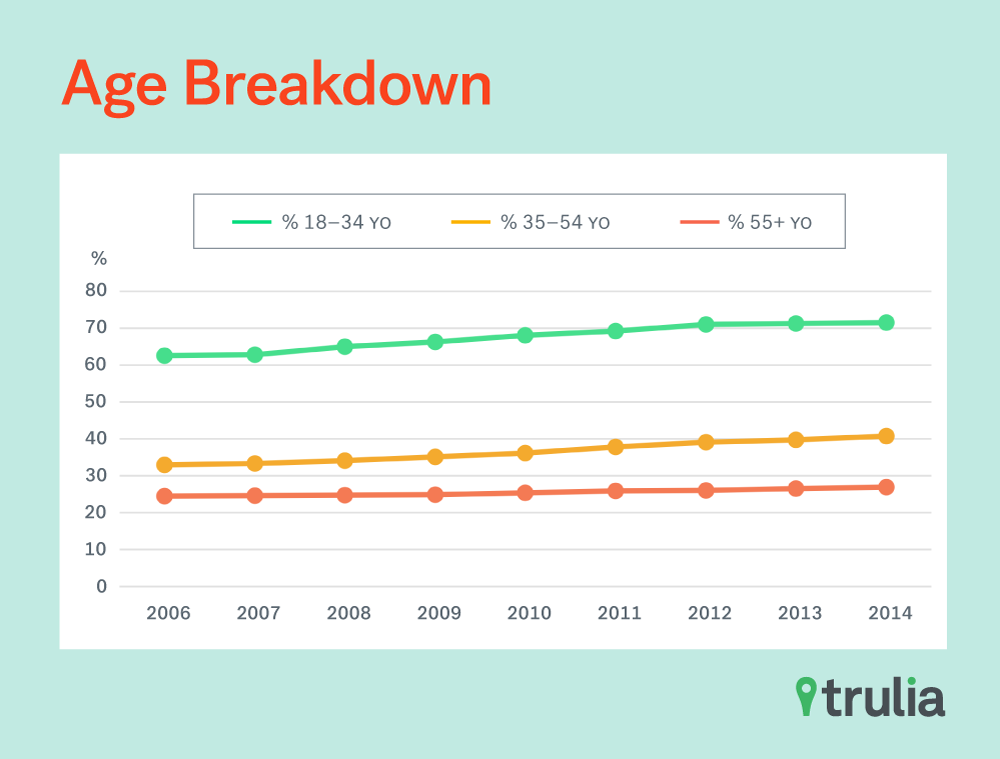
When it came to age, the financial crisis spared no one. Across all age groups (18-34, 35-54, and 55 and older), there was an increase in renting. Eighteen-to-34-year-olds had the biggest jump, by 9.1 percentage points. In fact, 71.6% of young adults in 2014 were renters rather than homeowners.
| Owner-To-Renter: By Age | ||||||
| Age Group | Renters (%), 2006 | Renters (%), 2014 | Percentage Point Change in Renters, 2006 vs. 2014 | % of Income Spent on Rent, 2006 | % of Income Spent on Rent, 2014 | Percentage Point Change in % Spent on Rent, 2006 vs. 2014 |
| 18 to 34 | 62.5% | 71.6% | +9.1 | 32.2% | 33.2% | +1.1 |
| 35 to 54 | 33.0% | 40.7% | +7.8 | 28.3% | 29.4% | +1.2 |
| 55 or older | 24.4% | 27.0% | +2.6 | 29.6% | 30.3% | +0.7 |
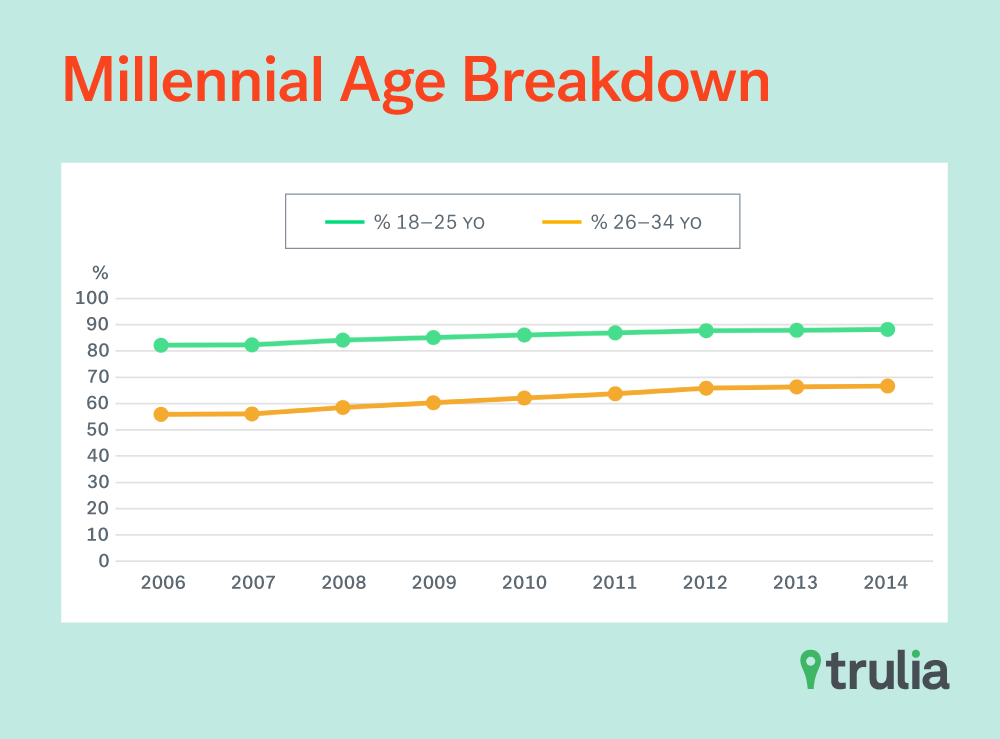
Contrary to popular belief, the large jump in renters among 18-34 year olds is not just a reflection of the kids leaving the nest and forming their own households as renters. When we separated the 18-34 year-old group into two smaller segments (18-25 year olds vs. 26-34 year olds), the results, we found older millennials of today were disproportionally affected:
The younger 18-25 year-old group only saw a 5.9 percentage point jump in renting from 2006 to 2014, while the older 26-34 year-old group saw a surprising 10.9 percentage point jump. Traditionally, young adults have become first-time homebuyers as they grow older and have advancing in their careers and incomes. This suggests that the fundamental shifts in the economy (job loss, low-income growth, diminishing affordability of homes) may have caused the increase in renting for those in the 18-34 year-old group.
Surprisingly, the 35-to-54-year-old population also saw a very sizeable increase in renting, which rose 7.8 percentage points. Before the crisis, 35-to-54-year-olds were actively involved in buying homes. We suspect that many in this age-segment lost their jobs during the crisis. As a result, they were subsequently forced out of their homes via foreclosure, and were forced to enter the rental market.
More Men Became Renters Post-Crisis
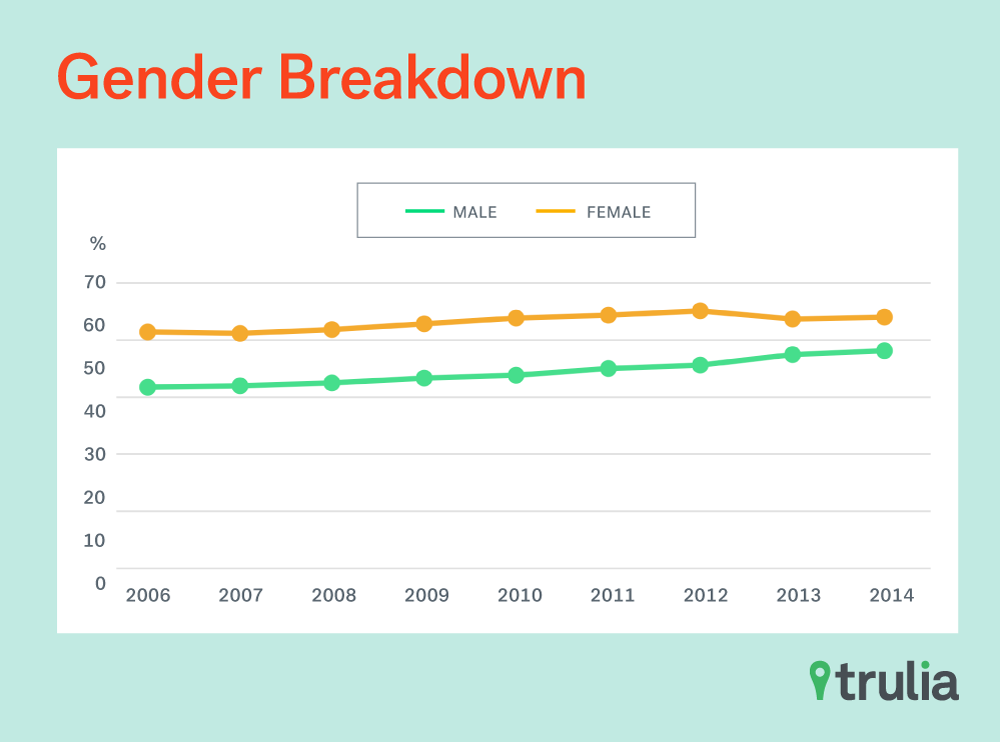
Looking at the heads of households by gender, we saw a larger shift from homeownership to renting by households lead by men. With a 6.4-point gain, men saw a larger increase in renting than women post-crisis, up just 2.6 percentage points.
However, keep in mind that because we’re looking at the head of households, this may include dual-income households where both a man and woman reside. Households led by women tend to be renters. Before and after the crisis, a greater proportion of women, 41.4% in 2006 and 44% in 2014, rented than men.
| Owner To Renter: Men vs. Women | ||||||
| Gender | Renters (%), 2006 | Renters (%), 2014 | Percentage Point Change in Renters, 2006 vs. 2014 | % of Income Spent on Rent, 2006 | % of Income Spent on Rent, 2014 | Percentage Point Change in % Spent on Rent, 2006 vs. 2014 |
| Male | 31.8% | 38.1% | +6.4 | 26.7% | 27.7% | +1.1 |
| Female | 41.4% | 44.0% | +2.6 | 33.0% | 33.6% | +0.6 |
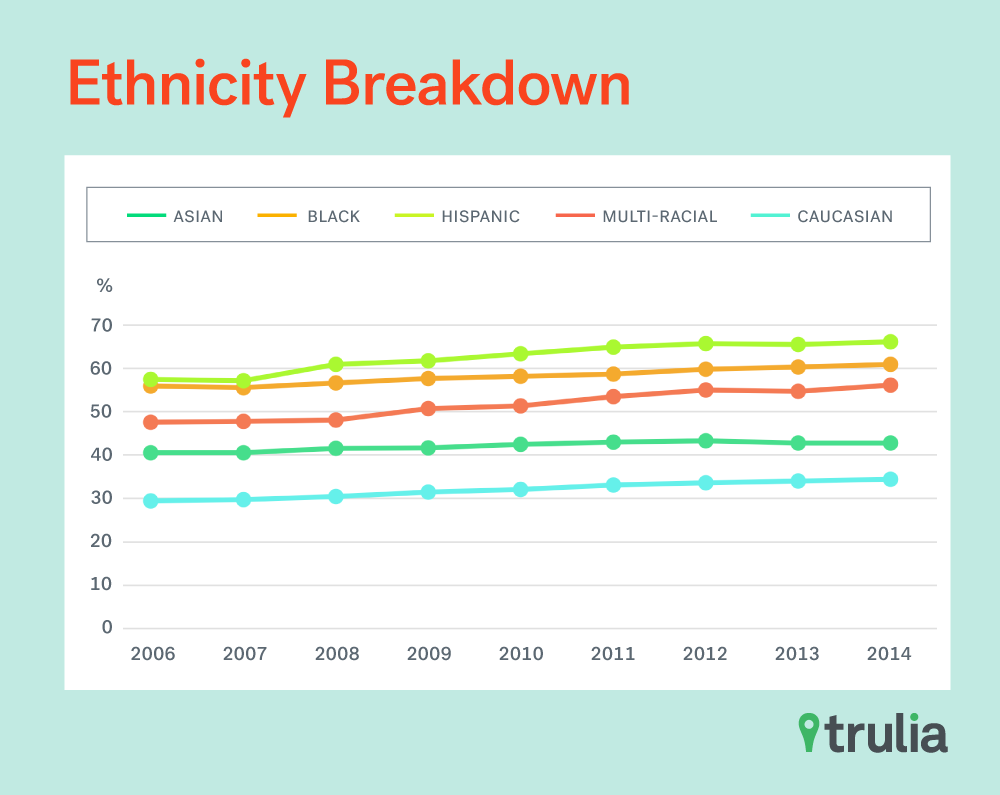
Minority Homeownership Hit Hardest By Crisis
Hispanics were the more likely to rent, at a rate of 66.1%, post-crisis. Moreover, this group experienced a higher increase in renting during the crisis, up 8.7 percentage points, more than any other demographic.
Whites and Asian-Americans stood out from the rest of the mix. In 2014, all races with the exception of these two racial-groups had rental rates above 50%. In other words, you were more likely to be a renter than not if you were a minority with the exception of Asian and Pacific Islanders.
| Owner To Renter By Race | ||||||
| Race | Renters (%), 2006 | Renters (%), 2014 | Percentage Point Change in Renters, 2006 vs. 2014 | % of Income Spent on Rent, 2006 | % of Income Spent on Rent, 2014 | Percentage Point Change in % Spent on Rent, 2006 vs. 2014 |
| Asian or Pacific Islander | 40.6% | 42.8% | +2.2 | 28.0% | 28.4% | +0.4 |
| Black | 56.0% | 61.0% | +5.0 | 33.0% | 34.6% | +1.6 |
| Hispanic | 57.4% | 66.1% | +8.7 | 32.1% | 35.1% | +3.0 |
| Multi-Racial | 47.6% | 56.1% | +8.5 | 30.7% | 32.0% | +1.3 |
| White | 29.5% | 34.4% | +5.0 | 28.3% | 29.1% | +0.8 |
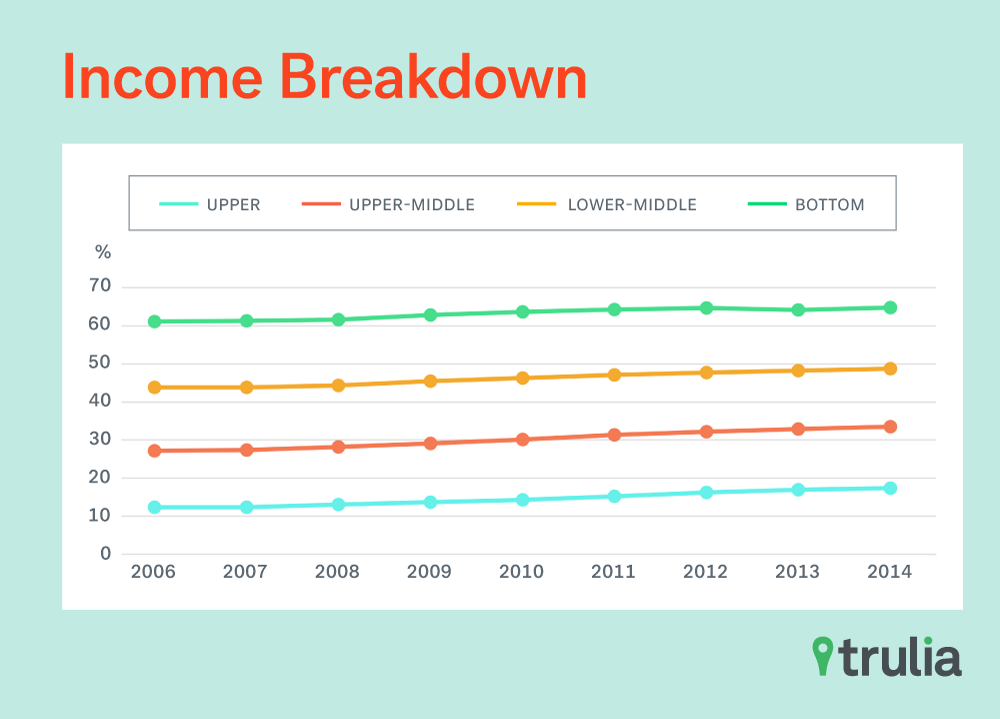
Owner To Renter: By Income
The great recession of 2008 certainly had a great impact on the rich. While poorer households are generally more likely to rent rather than wealthier households, we surprisingly found higher increases in rental rates among the top and upper-middle income earners.
The poorest households had the biggest increase in percentage of income spent on paying rent rising a whopping 6.8 percentage points, followed by the lower-middle class households at 2.6 percentage points. This goes on to show that the poorest of households have not seen their income growth accelerate as quickly as that of rent increases on starter rental units.
| Owner To Renter: By Income | ||||||
| Income Quartile | Renters (%), 2006 | Renters (%), 2014 | Percentage Point Change in Renters, 2006 vs. 2014 | % of Income Spent on Rent, 2006 | % of Income Spent on Rent, 2014 | Percentage Point Change in % Spent on Rent, 2006 vs. 2014 |
| Top | 12.3% | 17.3% | +5.0 | 12.5% | 13.5% | +1.0 |
| Upper-middle | 27.2% | 33.5% | +6.3 | 18.5% | 20.0% | +1.5 |
| Lower-middle | 43.8% | 48.7% | +4.9 | 27.4% | 30.0% | +2.6 |
| Bottom | 61.1% | 64.8% | +3.7 | 55.7% | 62.5% | +6.8 |
Looking at all categories studied above (age, gender, race, and income), here’s where we saw the biggest shifts in rental rates from pre-crisis to post-crisis. That is, demographically, older millennials, minorities, especially Hispanics, men and the wealthy in overheated housing markets were most likely to be displaced from homeowners to renters.
| Americans Who Experienced the Biggest Shifts From Homeownership to Renting | |||||||
| Rank | Age Group | Income Quartile | Race | Gender | Renters (%), 2006 | Renters (%), 2014 | Percentage Point Change, 2006 vs. 2014 |
| 1 | 26 to 34 | top | Hispanic | Male | 32.4% | 62.6% | +30.2 |
| 2 | 26 to 34 | top | Black | Male | 32.2% | 59.4% | +27.2 |
| 3 | 26 to 34 | top | Black | Female | 32.5% | 53.6% | +21.1 |
| 4 | 26 to 34 | top | Asian or Pac Islander | Female | 28.3% | 47.1% | +18.8 |
| 5 | 26 to 34 | upper-middle | Multi-Racial | Male | 47.4% | 66.1% | +18.7 |
| 6 | 18 to 25 | top | White | Female | 51.3% | 69.9% | +18.7 |
| 7 | 26 to 34 | lower-middle | Multi-Racial | Male | 63.2% | 81.8% | +18.5 |
| 8 | 26 to 34 | top | Asian or Pac Islander | Male | 35.0% | 53.4% | +18.4 |
| 9 | 18 to 25 | top | White | Male | 57.4% | 75.1% | +17.7 |
| 10 | 26 to 34 | upper-middle | Multi-Racial | Female | 50.8% | 68.2% | +17.4 |
| To view a the homeownership to renter shifts for all demographic groups, see here. | |||||||
Methodology
American Community Survey data gathered via IPUMS was used for this study. Particularly, 1-Year ACS data from 2006 to 2014 were used.The percentage numbers listed throughout the document that are not broken down Metro Area-by-Metro Area are derived using data for the top 50 Metro Areas excluding Philadelphia, Montgomery County, Pa., Camden, N.J., Kansas City, Mo., Louisville, Ky., Nashville, Tenn., New Orleans and Oklahoma City. These metropolitan areas were excluded due to sample size problems. Only Head-of-Households were used in calculating % numbers.Monthly gross rent as collected by ACS was used for rent numbers in calculating weighted median percentage of household income paid towards rents. Metro Areas used in this study, by which we segment the data, follow Metropolitan Areas, or Divisions where available.Foreclosure/Transaction data came from a proprietary source owned by Trulia. Texas states were dropped when fitting the OLS regression line using Foreclosure data and point jump in rental rates. This is because Texas is a non-disclosure state, and reliable transaction data for that state is not available.Due to fluctuation because of immigration/emigration, the U.S. population does change over time; the proportional increase in renters might partially be caused by net-migration of people into the U.S. who, in aggregate, rent more than buy/own.

