If you’re looking for a newly constructed home, you may be experiencing some sticker shock. New homes are desirable for many reasons—the latest amenities, less maintenance—but it can still be difficult to tell whether it’s worth the price premium.
As new construction steadily recovers from post-recession lows, new home sales are also ticking upwards—up 14.1% year over year. America is back on the lookout for new homes, so Trulia took a look at new home listings over the last five years to see just what you’re getting for the price you’re paying, compared with an older home.
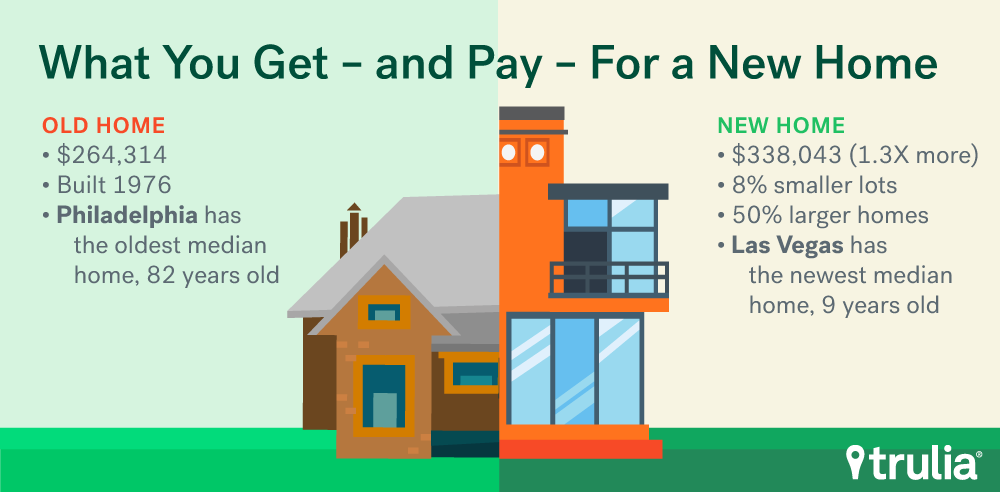
Nationally, a new home costs nearly 1.3 times, or 28% more than the rest of the housing stock. However, when examining individual markets, a pattern emerges: the older the metro, the more expensive new homes are. Our findings show that:
- The age of a metro’s housing stock is tightly correlated with the price differential – the older the housing stock of a metro, the more expensive new homeswill be in comparison.
- Size and location can explain most of the difference in price between new and older homes in a metro. Nationally, of the 28% price premium, roughly half is tied to a home’s features.
- Detroit leads the nation with the largest difference in price between newly built homes and older homes, where you’ll pay 3.2 times more for a new home. However, new homes are also 86% larger in lot size with 94% more square feet.
- Metros in the West and South have among the lowest price bumps on new homes. However, these low prices come with smaller yards. In Charleston, S.C., new homes are listed at just 6% more than older homes, but lot size is smaller by 30%.

Rust Belt Upturn
The nation’s most expensive metros are largely absent from the list of most expensive new homes. Instead, metros with the largest price differential are concentrated around the Rust Belt. Detroit tops the list, where you’ll pay 222%—or 3.2 times more—for a new home.
Note: Median lot sizes between new and older homes in Bridgeport and Philadelphia were not statistically significantly different.
However, for that steep price in Detroit, you’re also getting the largest increase in lot size and square feet—the median new home is 86% larger in lot size, with 94% more square feet. Compare that with Birmingham, Ala., where for a smaller price bump you’ll get a 10% decrease in lot size.
Rounding out the list are areas like Milwaukee, Pittsburgh, and Toledo, Ohio. Although the median new home is 2-2.5 times higher in price in each of these markets, the new units look quite different across markets. While new homes in Milwaukee are 148% more expensive than other units, they’re also, on median, 80% larger in lot size—almost double the percentage in Pittsburgh.
A notable geographic outlier is San Francisco, though it has one key similarity with the other Rust Belt Cities—more on this below. Homebuyers can be slightly heartened, though, that for 2.5 times the price of an older home, you can also get almost double the square footage.
| Where You’ll Pay the Most for a New Home | |||
| % Difference in…. | |||
| U.S. Metro | Price | Lot Size | Square Feet |
| Detroit-Dearborn-Livonia, MI | +222% | +86% | +94% |
| Bridgeport-Stamford-Norwalk, CT | +188% | NA* | +75% |
| Philadelphia, PA | +188% | NA* | +74% |
| San Francisco-Redwood City-South San Francisco, CA | +149% | +34% | +99% |
| Milwaukee-Waukesha-West Allis, WI | +148% | +80% | +79% |
| Lake County-Kenosha County, IL-WI | +139% | +35% | +76% |
| Pittsburgh, PA | +130% | +44% | +58% |
| Toledo, OH | +127% | +30% | +49% |
| Dayton, OH | +126% | +27% | +53% |
| Birmingham-Hoover, AL | +124% | -14% | +66% |
Head West or South for New Home Bargains
If you want that new home smell but want to avoid paying much more than you would for an older home, consider heading to Charleston, S.C., where the median new home is just 6% higher in price. Or, head west to Tacoma, Wash., Portland, Ore., or Oakland, Calif., where that difference is between 10-14%. However, these bargain bin prices come at the expense of lot size. In all 10 metros with the lowest difference in price, the median new home has a smaller lot size compared with the rest of the housing stock.
Still, some metros sacrifice less in lot size than others, and if what you truly care about is the amount of living space, then increases in square footage may tip the scales for a particular metro. For example, while Oakland’s price differential is more than double the percentage of Charleston’s (14% vs. 6%), you’ll see a relatively small 3% decrease in lot size in new units, with a generous 51% increase in square footage.
Just one of the top 100 metros we analyzed has new homes that are both smaller in lot size and square footage, despite the higher price tag. In El Paso, Texas, homebuyers can find new units with a 15% price bump compared with the rest of the housing stock, with a corresponding 15% smaller lot size and 5% less square footage. Not all is lost for El Paso homebuyers, though—these calculations do not take into account other quality measures, such as building materials, or considerations like location within the metro, both of which can demand a high premium.
| Where You’ll Pay the Least for a New Home | |||
| % Difference in… | |||
| U.S. Metro | Price | Lot Size | Square Feet |
| Charleston-North Charleston, SC | +6% | -30% | +26% |
| Tacoma-Lakewood, WA | +10% | -35% | +33% |
| Portland-Vancouver-Hillsboro, OR-WA | +14% | -28% | +37% |
| Oakland-Hayward-Berkeley, CA | +14% | -3% | +51% |
| El Paso, TX | +15% | -15% | -5% |
| Austin-Round Rock, TX | +17% | -9% | +13% |
| Washington-Arlington-Alexandria, DC-VA-MD-WV | +18% | NA* | +78% |
| Bakersfield, CA | +23% | -10% | +14% |
| Silver Spring-Frederick-Rockville, MD | +23% | -44% | +50% |
| North Port-Sarasota-Bradenton, FL | +24% | -25% | +15% |
Note: Median lot sizes between new and older homes in Washington D.C. were not statistically significantly different.
Age Matters
Why do some metros have larger price gaps in new versus older homes than others? What do Detroit and San Francisco—two metros with among the highest gaps in the nation—have in common? The answer: lots of old houses. The median age of a metro’s housing stock is positively correlated with its price differential between new and older homes. Older homes are generally lower in quality, requiring more upkeep with less modern amenities. If a city is mostly filled with old homes, then a new home will look more attractive in comparison. San Francisco and Detroit have among the oldest housing stock in the country, with a median house age of 67 and 63, respectively. They rank just behind Philadelphia, with a median house age of 82. Not coincidentally, these three metros are at the top of the list for the highest price differential between new and old homes.
…So Do Location and Size
When controlling for the attributes of a home (including number of bedrooms and bathrooms, lot size, square footage, and zip code), the premium on newly built houses looks a lot smaller in the nation’s top markets. Nationally, almost half of the 28% price differential – 13.6 percentage points—can be explained by variations in house attributes. In metros with the largest differences in price between new and older homes, an even higher portion of that price differential can be explained by attribute variations. For example, in Detroit, which we found had the highest price bump for new homes but a similarly high bump in lot size and square footage, nearly all of the 222% price differential (roughly 207.4 percentage points) can be explained by the variation in size and location attributes of the housing stock.
So, nationally, you’ll only have to pay about 14% more for that new home smell—but that’s only paying for the smell. The reality is, new homes look a lot different than older homes—more different in some metros than others—and buyers end up paying for increases in quality as well.
Methodology
We used listings data from 2012 to present, adjusting for inflation, and defining new homes as those with a listing date within two years of the year built. We then calculated the median price, lot size, and square footage for new and older homes separately, to then calculate the percentage difference of those statistics. The difference in median bedroom and bathroom counts was not statistically significant in the majority of metros. Baton Rouge, La., New Orleans, La., and Urban Honolulu, HI are dropped from our analysis due to data issues. For national statistics, we weight medians by the number of occupied housing units in each metro.
We used an Ordinary Least Squares (OLS) regression to predict the price premium on new homes, controlling for bedrooms, bathrooms, lot size, square footage, and zip code. We estimate this premium nationally, and for the 10 metros that have the highest and lowest difference in new home price. The national premium is statistically significant at the 1% level, with an R-square of 0.726. The premium in Detroit is statistically significant at the 1% level, with an R-square of 0.701. The coefficient on bedroom counts is negative and significant in our national regression, and several metro-level results as well. This is due to the trade-off in value between an additional bedroom and more square footage – a house with more, but smaller bedrooms may be worth less than a house with less, but more spacious, bedrooms. To calculate the percentage of the median price differential that can be explained by house attribute variations, we use the ratio of the mean price differential to the attribute-controlled regression coefficient on new homes.


