This morning the Census released its 2013 population estimates by age group for counties, which reveals which local areas are gaining or losing millennials, boomers, and other age groups. Earlier this year, the Census released 2013 population estimates for the overall population – not broken out by age group: at that time we pointed out that the most urban counties had slower population growth than the more suburban counties, even though the most urban counties were growing faster than they did during the housing bubble. (This post and this article explored the broad urban versus suburban trends.)
Today’s new data tell us whether key demographic groups – like millennials (20-34 year olds), boomers (50-69 year olds), and young kids (0-4 year-olds) – might be bucking the broader trend of more suburban counties growing faster than the most urban counties. To measure this, we use the same approach of dividing all U.S. counties into four quartiles based on their household density so that each quartile includes around one-fourth of the total population (see note on county definitions and age groups). Going from the highest to lowest density, the four categories correspond roughly to (1) big, dense cities; (2) big-city suburbs and lower-density cities; (3) lower-density suburbs and small cities; and (4) smaller towns and rural areas.
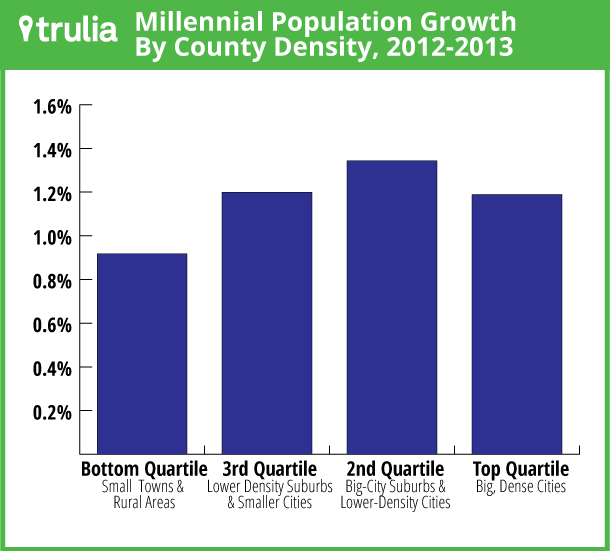
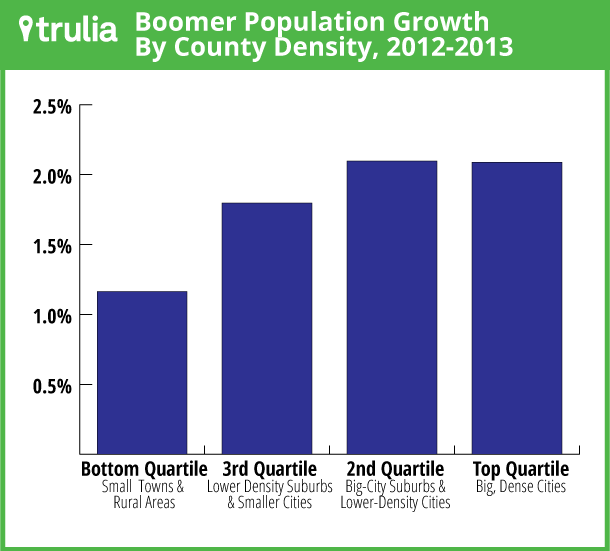
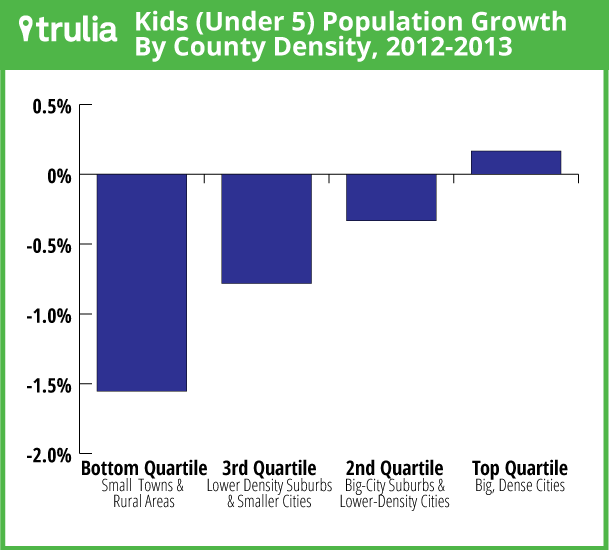
The punchline: millennial population growth in 2012-2013 in big, dense cities was outpaced by big-city suburbs and lower-density cities and even by lower-density suburbs and smaller cities. Boomer growth in big, dense cities also fell just short of growth in the big-city suburbs and lower-density cities. But the population of kids under the age of 5 grew fastest in big, dense cities. Let’s take a look at each of the age groups.
Millennials Not Flocking to Big Cities
From 2012 to 2013, population growth for millennials (20-34 year-olds) was highest outside big cities. The fastest growth was in the second quartile of counties ranked by density (big-city suburbs and lower-density cities). Furthermore, the third quartile (lower-density suburbs and smaller cities) edged out the top quartile (big, dense cities) for millennial population growth:
The differences aren’t huge, but there’s clearly no mad rush to the cities – despite the shift from homeownership to renting among these young adults.
At the metro level, Colorado Springs, San Antonio, and Peabody (the metro division just north of Boston) experienced the fastest growth in the millennial population. Nine of the 10 metros with the fastest millennial population growth were in the South and West.
| Top 10 Metros for Millennial Population Growth | ||
| # | U.S. Metro | Change in 20-34 year-old population, 2012-2013 |
| 1 | Colorado Springs, CO | 3.2% |
| 2 | San Antonio, TX | 3.0% |
| 3 | Peabody, MA | 2.9% |
| 4 | Honolulu, HI | 2.8% |
| 5 | Denver, CO | 2.5% |
| 6 | Seattle, WA | 2.5% |
| 7 | Cape Coral–Fort Myers, FL | 2.5% |
| 8 | Houston, TX | 2.4% |
| 9 | Oakland, CA | 2.3% |
| 10 | Orlando, FL | 2.3% |
| Among 100 largest metros. Overall national population growth for 20-34 year-olds was 1.2%. | ||
In addition to the top 10, there are several metros with above-average millennial population growth despite slow growth in other age groups. In Hartford, Worcester, Cleveland, Long Island, Albany, and Buffalo, Millennial population growth was above the national average for millennials of 1.2%, even though population growth across all age groups in those metros was sluggish.
Boomers Getting More Urban
Boomer (50-69 year-olds) population growth in the past year was also highest in the second quartile of counties (big-city suburbs and lower-density cities), but only slightly ahead of the growth in the top quartile (big, dense cities). Boomer growth was slower in the third quartile (lower density suburbs and small cities) and the bottom quartile of counties (small towns and rural areas). Overall, boomer population growth skewed more urban than millennial growth did:
All of the metros with the fastest growing boomer population were in the South and West, with Texas and the Carolinas dominating the list:
| Top 10 Metros for Boomer Population Growth | ||
| # | U.S. Metro | Change in 50-69 year-old population, 2012-2013 |
| 1 | Austin, TX | 4.4% |
| 2 | Raleigh, NC | 4.3% |
| 3 | Dallas, TX | 3.5% |
| 4 | Charlotte, NC-SC | 3.4% |
| 5 | Charleston, SC | 3.3% |
| 6 | Houston, TX | 3.2% |
| 7 | Fort Worth, TX | 3.2% |
| 8 | Atlanta, GA | 3.1% |
| 9 | San Jose, CA | 3.1% |
| 10 | Miami, FL | 3.1% |
| Among 100 largest metros. Overall national population growth for 50-69 year-olds was 1.8%. | ||
Here’s what else these boomer-attracting metros have in common: they tend to have relatively young populations. In fact, Austin has the highest share of millennials of any large metro; millennials account for disproportionately high shares of the populations of Charleston, Dallas, and Houston as well. That pattern holds more generally — the correlation between a metro’s share of millennials and growth rate of boomers is 0.4, positive and statistically significant. That means that boomers increasingly want to be where millennials live already.
The Big-City Baby Boom
Unlike for millennials, and more so than for boomers, population growth for the youngest Americans – those aged 0-4 – is strongly skewed toward the most urban counties. Although the number of kids under 5 declined in the U.S. overall between 2012 and 2013, it grew fastest in the most urban counties and declined most sharply in the least dense counties:
The top 10 metros for the population growth of kids under age of 5 include the three big east-coast metros of Washington, New York and Boston:
| Top 10 Metros for Young-Kid Population Growth | ||
| # | U.S. Metro | Change in 0-4 year-old population, 2012-2013 |
| 1 | Fort Lauderdale, FL | 1.3% |
| 2 | Washington, DC-VA-MD-WV | 1.2% |
| 3 | New York, NY-NJ | 1.1% |
| 4 | Orlando, FL | 1.1% |
| 5 | Seattle, WA | 0.8% |
| 6 | Tacoma, WA | 0.8% |
| 7 | San Diego, CA | 0.6% |
| 8 | Boston, MA | 0.6% |
| 9 | San Antonio, TX | 0.5% |
| 10 | Honolulu, HI | 0.5% |
| Among 100 largest metros. Overall national population growth for 0-4 year-olds was -0.6%. | ||
Furthermore, within metros, the population growth for kids under the age of 5 was highest in the most urban counties of those metros. In the New York metro, for instance, the 0-4 year-old population increased by 2.4% in both Manhattan and Hudson County, NJ, and 2.0% in Brooklyn – all very urban counties — but fell by 1.2% in both Westchester County, NY, and Bergen County, NJ, which are both more suburban. Population growth for 0-4 year-olds was also higher in the District of Columbia than in the Washington D.C. area suburbs, and higher in Suffolk County – which includes Boston – than its surrounding counties.
These new Census data show, therefore, that millennials are not driving urban growth. Boomers are urbanizing to some extent. But the strongest population shift toward big cities in the past year has been among the stroller set.
Remember, though, that these trends reflect a particular point in the housing and economic cycle. While the trends from the past year (2012-2013) are consistent with the trends over the past three years (2010-2013), these years have been anything but “normal” as the housing market recovers from the swing toward the suburbs during last decade’s boom and the fall in homeownership and household formation during the recession. The trends that are happening today may not last; they surely reflect current housing and economic conditions, but don’t necessarily reflect a long-term, permanent change in how or where people want to live.
Note: The Census reports population estimates by county for five-year age groups. We defined millennials as 20-34 year-olds and boomers as 50-69 year-olds.
We use tract-weighted county density to reflect the household density of the neighborhood that a typical county resident experiences (see page 11 of this report for an explanation of weighted density). Counties were bucketed so that each quartile covers roughly one quarter of the national population:
- The top quartile includes counties with weighted density above 2000 households per square mile, such as New York City’s five boroughs , San Francisco, Suffolk (Boston), MA, Los Angeles, Cook (Chicago), IL, Westchester, NY, and Montgomery, MD.
- The second quartile includes counties with weighted density of 1000-2000 households per square mile, such as big-city suburban counties like Rockland, NY, and Contra Costa, CA, as well as counties containing lower-density cities like Maricopa (Phoenix), AZ, and Erie, PA.
- The third quartile includes counties with weighted density of 500-1000 households per square mile, such as Gwinnett (outside of Atlanta), GA, and Yakima, WA.
- The bottom quartile includes counties with weighted density below 500 households per square mile, including small-town and rural counties. This quartile includes 82% of counties, covering 27% of the U.S. population.


