
Note: an earlier version of this report gave the incorrect percentage of searches for starter homes. The number has been corrected.
Nationally, the average market mismatch score across the starter, trade-up, and premium price tiers rose 1.8 percentage points to 7.4 percentage points during the fourth quarter 2016 – with most shoppers searching for starter and trade-up homes but most listings being premium homes.
The widening gap between listings and searches underscores the difficulty home buyers face in locating an affordable home they like. More than half of Americans who had been in the market to buy a home during the past two years (58.5%) said the process was either somewhat or very competitive. This compares with 37.8% of those who were exclusively in the market for a rental during the same time period, according to a recently commissioned survey conducted online by Harris Poll on behalf of Trulia.
Market mismatch[1] is our measure of search interest versus available listings. In other words, it’s the difference between the price point where the bulk of searches occur and the average price point of listed properties. For instance, if 60% of buyers are searching for starter homes but only 40% of listings are starter homes, our market mismatch score for starter homes would be 20.
For our second installment of Mismatched Markets, we dove deeper into who and where people are feeling squeezed the most given how tight inventory is throughout the country especially for starter and trade-up homes. So this time we are classifying listings and searches into our starter, trade-up, and premium price categories and looking at them side-by-side to see which markets have the largest mismatches. Here is what we found:
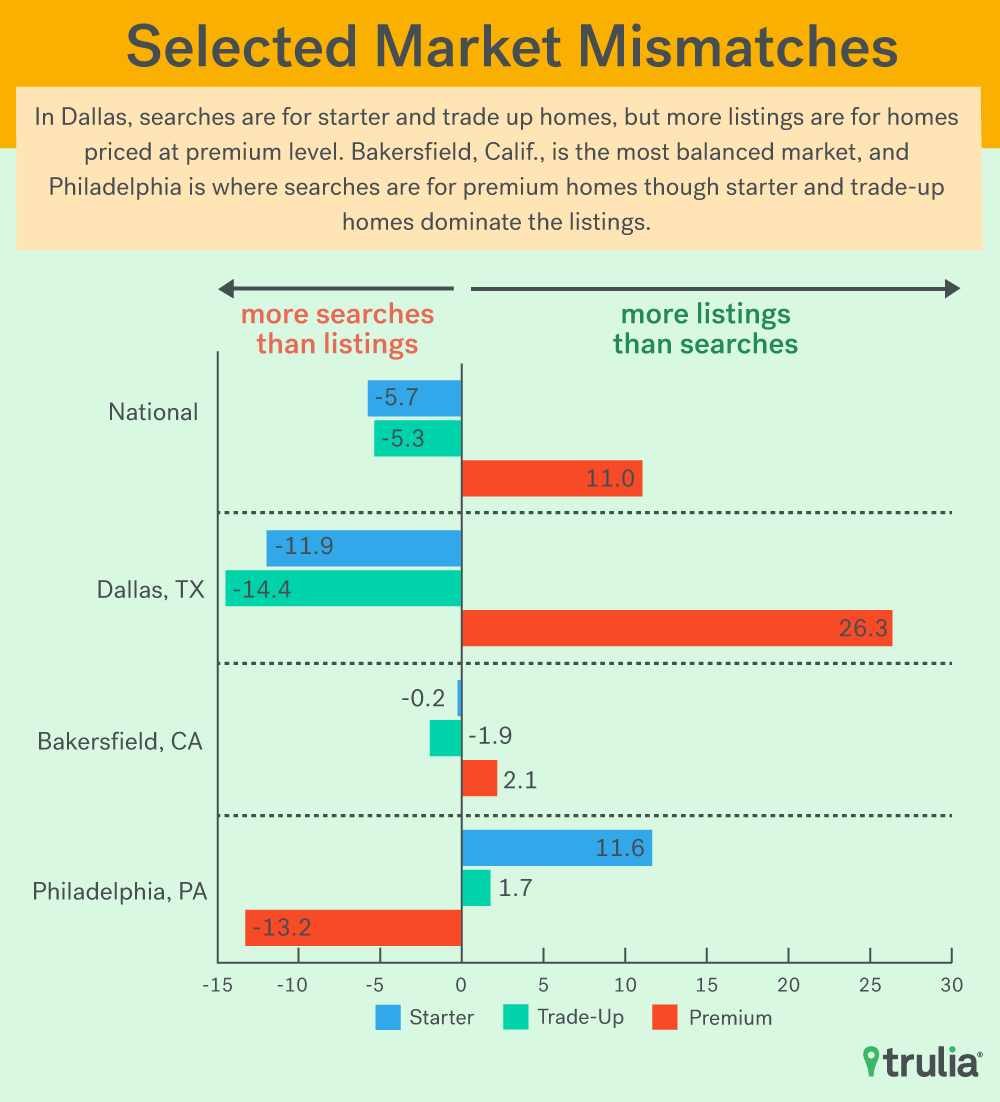
- Lack of starter and trade-up homes is indicating unbalanced markets. We found a 5.7 and 5.3 percentage-point shortfall of listings relative to search interest in the starter and trade-up price categories and an 11 percentage-point surplus of listings relative to search interest in the premium price category, averaging out to 7.4 percentage points. This is what we call our “market mismatch score.”
- Searchers and sellers are drifting apart when it comes to price. This compares with a market mismatch score of 6 and 5.6 during the 4th quarters of 2014 and 2015, respectively.
- Starter and trade-up homes are most sought after. 26.9% of all searches were for starter homes while only 21.2% of listings were at that price level.
- The gap between searches and listings is similar in the trade-up category with 30% of all searches chasing only 24.3% of listings.
- Premium buyers have it easiest. This leaves potential buyers in the premium category with the best chances of experiencing a less competitive home buying process with only 43.5% of searches viewing 54.5% of all listings.
- Starter home hunters in Raleigh, N.C., and Colorado Springs, Colo., are feeling the most pinched with 14.0 and 13.1 percentage point gaps between search volume and listing availability.
- Philadelphia on the other hand has a surplus of starter listings relative to search volume with an 11.6 percentage point gap between them and a 13.2 percentage point shortfall in premium listings compared with searches to that price-tier.
During the most recent quarter, of the largest 100 metros, 75 had a larger percentage of search interest in the starter homes category than percentage of listings that were actually starter homes. 92 metros had a listing shortfall relative to search interest in the trade-up category. Meanwhile, only 11 of the largest 100 metros saw a larger percentage of search interest fall in the premium category compared with the percentage of listings in that same tier. This disparity, with increasing numbers of metros experiencing a shortage of starter and trade-up listings and fewer metros with enough interest to match the proportion of premium homes, is the largest it has been in at least two years. It leaves Americans who are in the market for a home increasingly chasing too fewer options in lower price ranges, and sellers of premium homes more likely to be left waiting longer for a buyer.
[1] Note that our calculation methods have changed since the last Market Mismatch report, Oct. 6. For changes see Methodology section below.
<!–[if IE 9]>
<!–[if IE 9]><![endif]–>
Of the Largest 100 Metros… |
|||
| Housing Segment | Number with higher % of search interest than % of listings available 2014Q4 | Number with higher % of search interest than % of listings available 2015Q4 | Number with higher % of search interest than % of listings available 2016Q4 |
| Starter | 69 | 68 | 75 |
| Trade-Up | 89 | 88 | 92 |
| Premium | 14 | 15 | 11 |
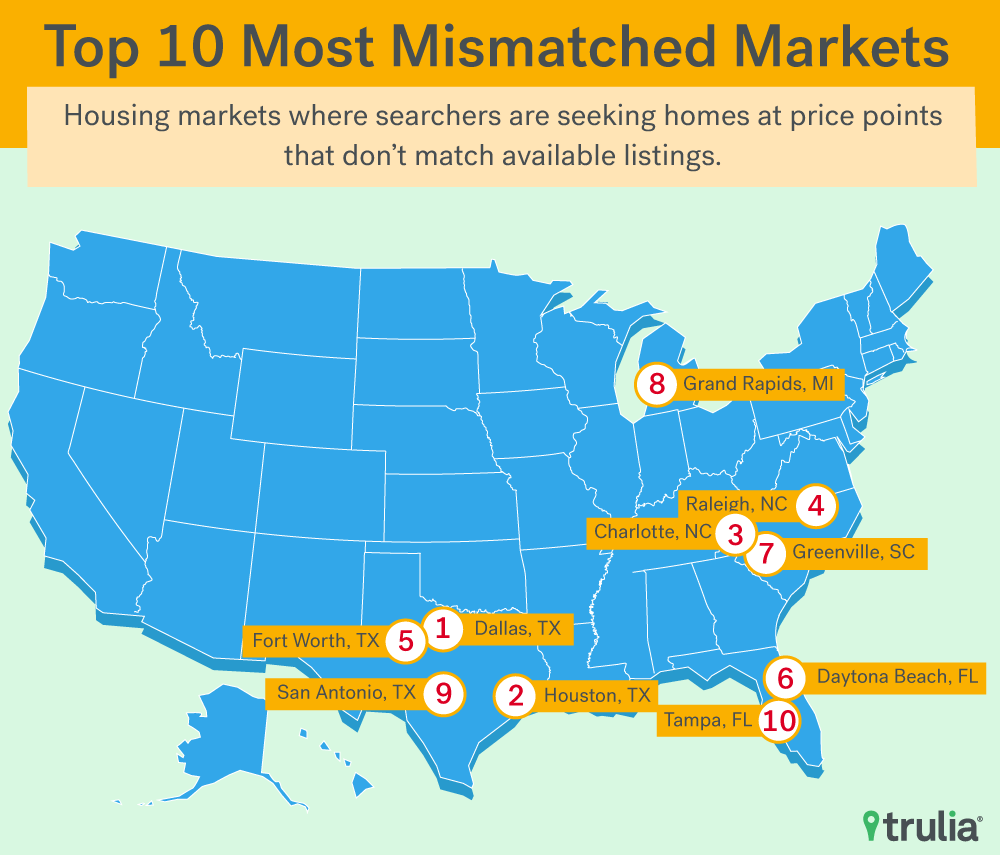
Places with the largest average search-to-listing gaps across the three price tiers all have more search interest in starter and trade-up homes and a surplus of listings in the premium category. There are four Texas metros in the top-10 most mismatched markets along with three metros from the Carolinas and two from Florida. Dallas has the highest average mismatch at 17.5 percentage points. Searches in the starter category here make up 18.1% of traffic but are chasing only 6.2% of listings. Similarly, 32% of searches are for trade-up homes, while only 17.6% of listings are the same. This leaves the remaining 49.9% of searches going to premium homes which make up a full 76.2% of listings.
During the past two years Dallas, like every other metro on this list with the exception of Houston, has seen inventories decline at a faster rate than the national average, contributing to higher market mismatch. In Houston, while inventories have actually grown during the past two years, there was also a sharp decline in job growth as a result of low oil and gas prices, likely pushing some shoppers to take a more conservative approach to their home shopping.
<!–[if IE 9]>
<!–[if IE 9]><![endif]–>
| Top 10 Mismatched Markets | |||||||
| Metro Area | % of All Searches for Starter Homes | % of All Listings that are Starter Homes | % of All Searches for Trade-Up Homes | % of All Listings that are Trade-Up Homes | % of All Searches for Premium Homes | % of All Listings that are Premium Homes | Average Market Mismatch Score (Regardless of +/-) |
| Dallas, TX | 18.1% | 6.2% | 32.0% | 17.6% | 49.9% | 76.2% | 17.5 |
| Houston, TX | 17.0% | 5.7% | 33.8% | 19.1% | 49.2% | 75.2% | 17.3 |
| Charlotte, NC | 20.3% | 11.3% | 34.1% | 20.4% | 45.6% | 68.3% | 15.1 |
| Raleigh, NC | 24.0% | 10.0% | 37.4% | 29.1% | 38.6% | 60.9% | 14.9 |
| Fort Worth, TX | 19.5% | 9.6% | 28.9% | 17.3% | 51.7% | 73.1% | 14.3 |
| Deltona-Daytona Beach-Ormond Beach, FL | 23.9% | 14.0% | 34.2% | 23.1% | 41.9% | 62.9% | 14.0 |
| Greenville, SC | 20.5% | 13.3% | 31.7% | 18.9% | 47.8% | 67.8% | 13.4 |
| Grand Rapids, MI | 28.4% | 20.4% | 29.4% | 17.7% | 42.2% | 61.9% | 13.1 |
| San Antonio, TX | 12.2% | 5.8% | 32.5% | 20.5% | 55.3% | 73.7% | 12.3 |
| Tampa-St. Petersburg, FL | 28.9% | 16.7% | 30.9% | 24.8% | 40.2% | 58.5% | 12.2 |
Looking at the premium price tier, the places with the biggest shortfalls in these listings relative to search traffic all tend to be in low cost metros with the exception of Los Angeles. Additionally, slower population growth or population declines, and the low quality of available housing stock is a common theme among most of these places. Philadelphia and Detroit are the only two metros that have a surplus of listings relative to searches in the starter and trade-up categories, and deficits in the premium category. The average mismatch score across the three price tiers for each metro in this group is smaller than the national average though and some of them are actually among the 10 markets with the least market mismatch. This is partially because the premium surplus and starter and trade-up shortfalls in most markets are so high, that the few places that actually have the opposite mismatch are much closer to balanced overall.
| Top 10 Metros with Largest Premium Listing Shortfall Q4 2016 | |||||||
| Metro Area | % of All Searches for Starter Homes | % of All Listings that are Starter Homes | % of All Searches for Trade-Up Homes | % of All Listings that are Trade-Up Homes | % of All Searches for Premium Homes | % of All Listings that are Premium Homes | Premium Market Mismatch Score |
| Philadelphia, PA | 15.4% | 26.9% | 25.9% | 27.6% | 58.7% | 45.5% | -13.2 |
| Detroit, MI | 15.2% | 23.2% | 27.0% | 27.7% | 57.8% | 49.0% | -8.8 |
| Memphis, TN | 10.9% | 20.8% | 26.8% | 21.8% | 62.3% | 57.4% | -4.9 |
| Los Angeles, CA | 22.6% | 24.9% | 22.2% | 23.9% | 55.2% | 51.2% | -4.0 |
| New Orleans, LA | 16.3% | 20.8% | 23.0% | 22.3% | 60.7% | 56.9% | -3.8 |
| Little Rock, AR | 16.1% | 21.2% | 29.9% | 28.3% | 54.0% | 50.5% | -3.5 |
| Camden, NJ | 36.7% | 41.4% | 27.4% | 26.0% | 35.9% | 32.7% | -3.3 |
| Toledo, OH | 19.6% | 23.3% | 29.1% | 27.1% | 51.2% | 49.6% | -1.6 |
| Pittsburgh, PA | 22.9% | 29.5% | 27.3% | 22.1% | 49.8% | 48.4% | -1.4 |
| Gary, IN | 17.8% | 22.9% | 28.2% | 23.7% | 53.9% | 53.4% | -0.6 |
| 10 Metros with the Smallest Average Gap Q4 2016 | |||||||
| Metro Area | % of All Searches for Starter Homes | % of All Listings that are Starter Homes | % of All Searches for Trade-Up Homes | % of All Listings that are Trade-Up Homes | % of All Searches for Premium Homes | % of All Listings that are Premium Homes | Average Market Mismatch Score (Regardless of +/-) |
| Bakersfield, CA | 21.3% | 21.1% | 26.0% | 24.2% | 52.7% | 54.8% | 1.4 |
| Honolulu, HI | 37.4% | 33.8% | 24.9% | 24.9% | 37.7% | 41.3% | 2.4 |
| Toledo, OH | 19.6% | 23.3% | 29.1% | 27.1% | 51.2% | 49.6% | 2.5 |
| Newark, NJ | 35.9% | 38.1% | 28.7% | 25.0% | 35.4% | 36.8% | 2.5 |
| Chicago, IL | 24.0% | 23.0% | 27.4% | 24.4% | 48.7% | 52.6% | 2.6 |
| Los Angeles, CA | 22.6% | 24.9% | 22.2% | 23.9% | 55.2% | 51.2% | 2.6 |
| New Orleans, LA | 16.3% | 20.8% | 23.0% | 22.3% | 60.7% | 56.9% | 3.0 |
| Camden, NJ | 36.7% | 41.4% | 27.4% | 26.0% | 35.9% | 32.7% | 3.1 |
| Little Rock, AR | 16.1% | 21.2% | 29.9% | 28.3% | 54.0% | 50.5% | 3.4 |
| Syracuse, NY | 32.3% | 31.9% | 24.0% | 19.3% | 43.8% | 48.8% | 3.4 |
Given the national picture of low starter home supply compared with search interest, the places with the largest starter home shortfalls are more varied and include a much wider swath of the country. These include cites like Raleigh, N.C., Colorado Springs, Colo., Denver, North Port, Fla., Tampa, Dallas, and Portland, Ore.
| Top 10 Metros with the Largest Starter Listing Shortfalls Q4 2016 | |||||||
| Metro Area | % of All Searches for Starter Homes | % of All Listings that are Starter Homes | % of All Searches for Trade-Up Homes | % of All Listings that are Trade-Up Homes | % of All Searches for Premium Homes | % of All Listings that are Premium Homes | Starter Market Mismatch Score |
| Raleigh, NC | 24.0% | 10.0% | 37.4% | 29.1% | 38.6% | 60.9% | -14.0 |
| Colorado Springs, CO | 31.9% | 18.9% | 28.2% | 25.0% | 39.8% | 56.1% | -13.1 |
| Denver, CO | 29.9% | 17.0% | 29.7% | 25.1% | 40.4% | 57.8% | -12.9 |
| North Port-Sarasota-Bradenton, FL | 26.5% | 13.8% | 34.5% | 29.1% | 38.9% | 57.0% | -12.7 |
| Tampa-St. Petersburg, FL | 28.9% | 16.7% | 30.9% | 24.8% | 40.2% | 58.5% | -12.2 |
| Dallas, TX | 18.1% | 6.2% | 32.0% | 17.6% | 49.9% | 76.2% | -11.9 |
| Portland, OR | 30.0% | 18.4% | 28.4% | 26.3% | 41.6% | 55.3% | -11.6 |
| Cape Coral-Fort Myers, FL | 26.0% | 14.4% | 38.8% | 33.8% | 35.2% | 51.7% | -11.5 |
| Houston, TX | 17.0% | 5.7% | 33.8% | 19.1% | 49.2% | 75.2% | -11.3 |
| Minneapolis-St. Paul, MN | 32.3% | 21.3% | 27.6% | 20.6% | 40.0% | 58.1% | -11.0 |
So while inventories are declining throughout much of the country, there are big differences in how these inventory declines are likely being experienced by people who are actually in the market to buy a home in local markets. Low and declining starter and trade-up inventories in places like Detroit or Philadelphia seem to be causing less of squeeze at the low end because most searchers are looking for premium homes anyway. In Houston, on the other hand, there is significantly more search interest in starter and trade-up homes that is being met only with a lot of premium options.
Methodology
Note: The calculation for the market mismatch was adjusted from the first installment of this report. This means the numbers between this installment and the previous one are not directly comparable. However, all the data presented for 2016, 2015 and 2014 in this report was pulled using the updated method.
Additionally, while the same price cut-offs are used to define starter, trade-up, and premium homes nationally and in the 100 largest U.S. metros as in the quarterly Trulia Price and Inventory Watch , the weights assigned to listings differs, resulting in some differences in the inventory make-up. This different weighting was necessary to ensure that we are only counting site traffic to properties when they are actively on the market.
The Market Mismatch Score was based on all the for-sale listings (excluding pending and active contingent) on Trulia, which were pulled on quarterly basis beginning in Q4 2014. The distribution of prices for each metro and nationally was calculated by taking each active listing and adding up the number of days it was on the market during the quarter. All unique price points were consolidated and counted by summing these day & price combinations. In other words, if 10 properties were on the market for a combined 600 days at a price of $200,000, then the $200,000 price point would receive a weight of 600.
Site traffic from Trulia was matched to each unique property (and therefore price) on the market during the same time periods and added up for each quarter and price tier.
Listings and searches were assigned starter, trade-up, and premium price categories based on the price. “Market Mismatch” scores were then calculated by taking the difference between the percentage of listings in each of the three price tiers and the percentage of site traffic that went to each price tier. The average deviation from 0 for each category, regardless of the sign of the difference (+/-).
This survey referenced was conducted online within the United States by Harris Poll on behalf of Trulia from February 1-3, 2017 among 2,175 U.S. adults ages 18 and older. This online survey is not based on a probability sample and therefore no estimate of theoretical sampling error can be calculated. For complete survey methodology, including weighting variables, please contact dweidner@trulia.com.

