
America’s homes are getting bigger, but more space comes at a price: the backyard.
New single family homes are using land relative to home size at near-record levels, even after considering the number of stories homes have.
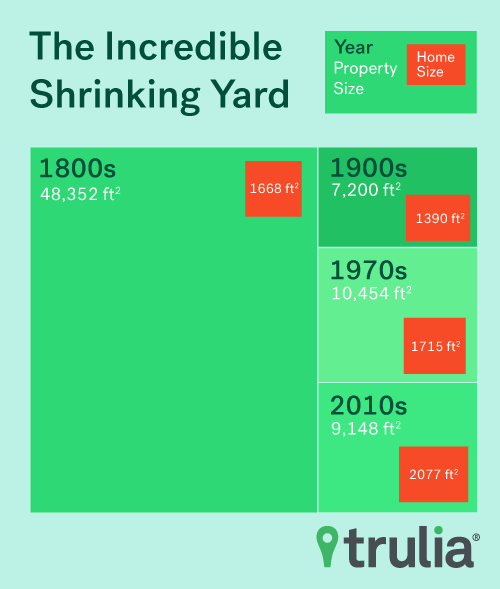
It’s a trend that has been taking shape for much of the past three decades as lot sizes continue to shrink and home square footage continues to grow. Homes built since 2015 occupy 25% of the land on which they sit, while homes built in 1975 occupy just 13.9%.
Many people like the idea of living in a single-family home and having a yard to call your own along with some space between themselves and their neighbors. In fact, surveys suggest that even city dwelling millennials aspire to a more traditional American dream of living in a large home in the suburbs and mowing their lawn on weekends. Nearly half, 46% of millennials, would prefer to move into a larger home compared with just 13% who would like to downsize.
Not only does where you live play a big role in how easy it will be find a place to live large inside and out, more importantly, when homes were built will have a big impact on how great of backyard barbeque you can actually hold.
Here are some key takeaways from our analysis:
- Nationally, single family homes occupy 17.4% of the lots on which they sit, regardless of the year they were built.
- Homes built since 2015 occupy 25% of the land on which they sit, while homes built in 1975 occupy just 13.9%. This is being driven by a combination of lots shrinking by 36.2% and home footprints growing by 15.2% size.
- Meanwhile, some of the oldest homes in the country, built in the early 1800s, occupy less than 5.0% of the large lots they are built on. The last time lot usage was nearly as high as it is now was during the early 1900s.
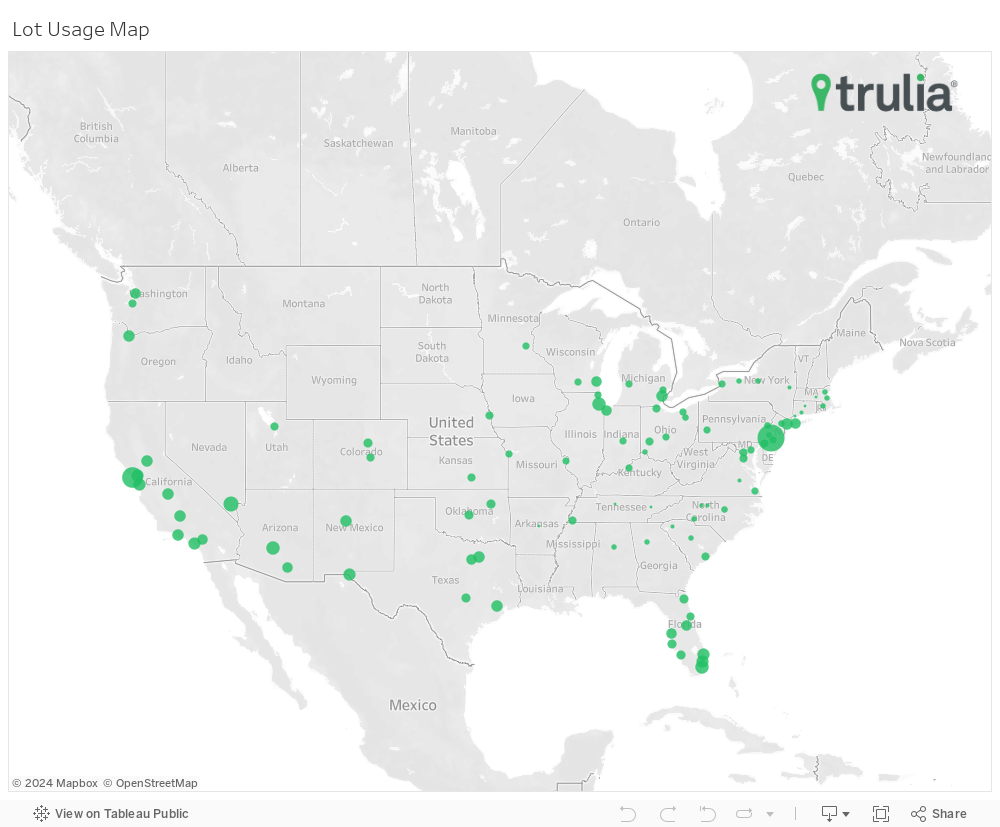
- Don’t mind the neighbors? Single family homes in places like Philadelphia, and San Francisco, which are both geographically small but dense, have the highest lot utilization at 57.7%, and 44.2%, respectively.
- Want plenty of yard space? Head to New England. Three Connecticut metro areas, Worcester, Mass., Hartford, Conn., and Bridgeport, Conn. make up the places with the smallest amount of house occupying lot space, at less than 7.5%.
- While most metro areas have seen lot usage grow since the mid-70s, with Oakland, Calif., and Miami seeing the largest upward swings, six metros have bucked the trend with San Francisco, Memphis, and Long Island, N.Y. moving toward less lot usage.
Lots Keep Shrinking and Homes Keep Growing
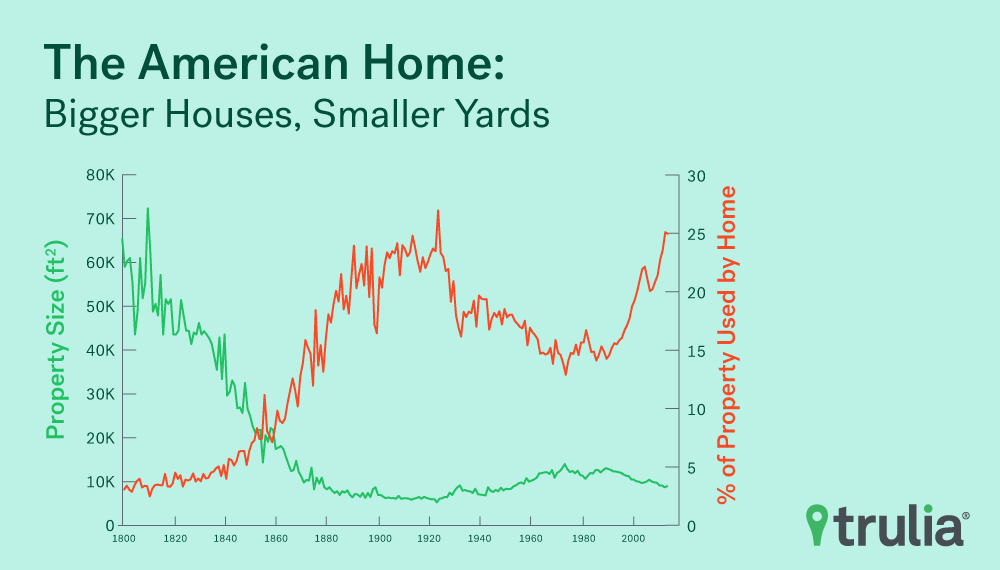
As America moved to an industrial economy from an agrarian one, the size of single family homes’ footprints generally fell to 1,420 square feet in the early 1900s from 1,740 square feet for homes built in the early 1800s. At the same time, the typical lot size on which they were being built decreased in size to 6,860 square feet, or 0.16 acres in the early 1900s from a median of roughly 56,000 square feet, or around 1.25 acres. This dramatic fall in lot sizes, paired up with a more modest decrease in the size of houses’ footprints resulted in a steady increase in lot usage from less than 4.0% to more than 21.5%.
After that though, the trend reversed for a while, with home and lot sizes increasing in tandem from the 30s through much of the 1970s – the age of suburbs – with the median lot size growing to 12,430 square feet (0.3
acres) and the median home footprint growing to 1,824 square feet. Home and lot growth during much of this period were partially spurred by the post war economic boom, the relatively new ubiquity of automobile use which allowed people to live further from dense urban areas, and was all punctuated by the building out of the Interstate Highway System, which made far-flung places less far flung.
The rise of suburbs brought lot usage down to 14.5% for that decade. Since then, however, while the size of home footprints has continued to grow, lot sizes first stopped growing, then began shrinking again in early 1990s. For homes built since the start of 2015, the estimated footprint has grown to an all-time high of 2,020 square feet while the lot they are built on has shrunk to 8,940 square feet, or 0.2 acres, and brought lot usage up to a record high of 25%.
A Day in the Park vs. A Day in the Yard
Among places with the tightest lots, most have seen an unusually high proportion of their building occur during periods when tighter lot construction was the norm. In addition to San Francisco and Philadelphia, places like Chicago and Detroit all have among the highest proportion of their housing stock built between 1890 and 1929, which was the first time lot usage peaked. Other places near the top of the list, like Las Vegas and Phoenix, have had among the highest portion of their housing stock built after 1996.
There are still many places where newly constructed homes still have plenty of free space, despite the national trend. All four Connecticut metros in the analysis are among the top 10 places for plenty of lot space overall. Even just looking at homes built after 2014, Worcester, Mass., Hartford, Conn., Bridgeport, Conn., and New Haven, Conn., are all places where a home’s footprint take up less than 10% of the lots on which they sit. Still looking at only homes built since the start of 2015, New England metro areas in general seem to be leading the nation in minimizing lot usage, though this is not the case when considering all homes in these places, regardless of when they were built. Providence, R.I., Cambridge, Mass., Albany, N.Y. and Boston are also bucking the national trend with newly constructed homes occupying less than 10% of their respective lots, though these places all have slightly higher lot usage for their housing stock overall.
They Don’t Build ’em Like They Used To – In Most Places
Since the mid-70s, when the proportion of lots used by new construction hit a recent low nationally at 13.6%, it climbed 11.3 percentage points to 25% of the lot of homes built in 2015 or later. Most metro areas have seen lot usage grow similarly. Oakland, Miami, and Indianapolis have seen the largest upward swing in lot usage, with homes built after 2015 occupying 25.6, 24.9, and 20.3 percentage points more, respectively, of the lots they are built on than they did in the mid-70s. Seven of the 95 metro areas we looked at have bucked that trend though, with San Francisco, Memphis, Tenn., and Long Island, N.Y. actually seeing a 12.9, 11.6, and 6.0 percentage point decrease, respectively, in the percent of lot usage by homes constructed after 2015 when compared with homes built in the mid-70s.
| Top 5 Largest Increases in Lot Usage | |||
| U.S. Metro | Lot Usage 1974-1976 | Lot Usage 2015 or Later | Percentage Point Shift Mid-70s to Today |
| Oakland, CA | 24.2% | 49.8% | 25.6 |
| Miami, FL | 28.4% | 53.3% | 24.9 |
| Indianapolis, IN | 9.8% | 30.2% | 20.3 |
| Silver Spring-Frederick-Rockville, MD | 14.2% | 33.7% | 19.5 |
| Baltimore, MD | 10.5% | 28.5% | 18.0 |
| Top 5 Largest Decreases in Lot Usage | |||
| U.S. Metro | Lot Usage 1974-1976 | Lot Usage 2015 or Later | Percentage Point Shift Mid-70s to Today |
| San Francisco, CA | 35.9% | 22.9% | -12.9 |
| Memphis, TN | 17.9% | 6.3% | -11.6 |
| Long Island, NY | 18.0% | 11.9% | -6.0 |
| Milwaukee, WI | 15.6% | 12.0% | -3.5 |
| Buffalo, NY | 12.8% | 11.9% | -0.9 |
So, if your ideal home comes with visions of backyard barbeques, a place for the dog to run, and maybe even a pool and hot tub to host people on those warm summer nights, know that where you live will greatly impact how easy that will be to come by. On top of that, be wary of brand new construction which will likely not offer all the outdoor bells and whistles you may be dreaming of. Instead, keep an eye out for homes built during the post war years up until the 80s, or, better yet, in the early to mid-1800s.
Methodology
To estimate the proportion of single family lots being occupied by the actual structure, public records data was used to estimate the size of a home’s ‘footprint’ by taking the square footage, dividing by the number of stories in the home and then adding the square footage of a garage when that data was available. If no garage information was available for a property, and there was no evidence to suggest the unit had an underground or basement garage, a standard 400 square feet was added to the footprint calculation, which would cover any kind of parking or storage space, be it fully or partially enclosed. In cases where an underground or basement garage could be verified, the square footage of the garage was added to the square footage of the home before dividing by the number of stories to reflect the fact that the garage square footage should not simply be added the home’s footprint.

