
U.S. home inventory tumbled 8.9% over the year in the second quarter of 2017, and has now fallen for nine consecutive quarters. Inventory today is a full 20% less than it was five years ago. As a consequence, homes are being snapped up by homebuyers at the fastest clip since we started keeping track in 2012.
For example, 57% of homes in 2012 were still on the market after two months while today that number stands at 47%.
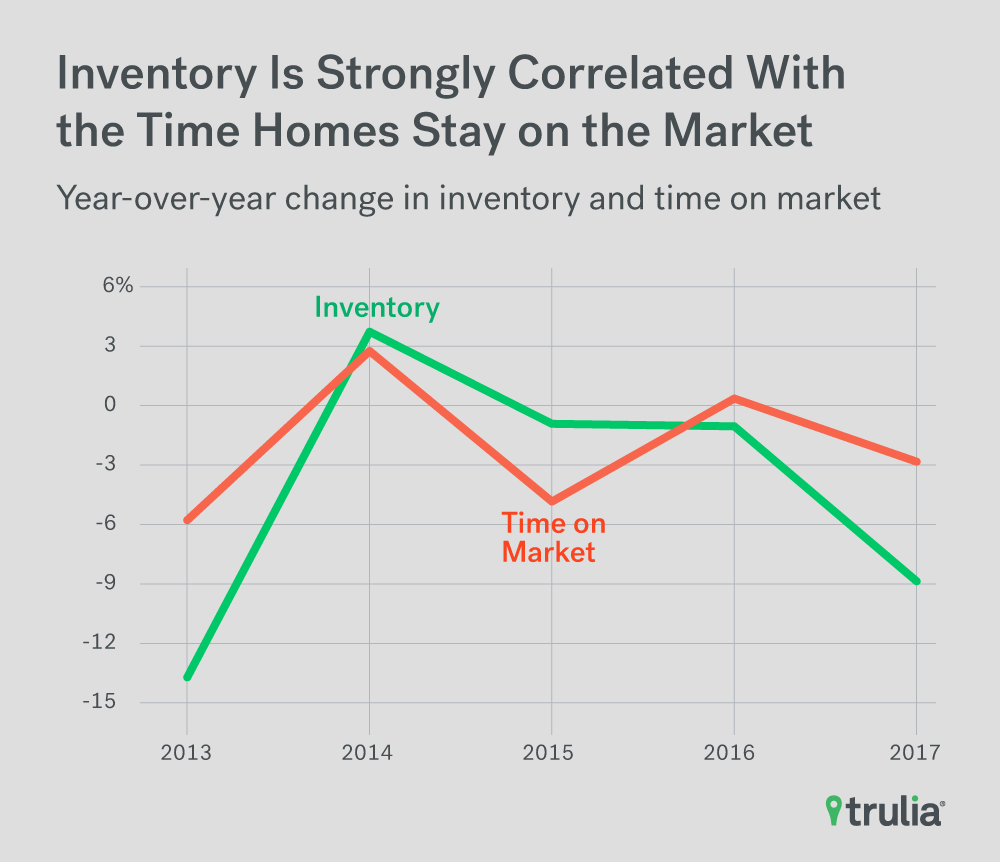
In this edition of Trulia’s Inventory and Price Watch, we examine how shrinking inventory affects how quickly homes come off the market. We find that, on average, metros with the largest decreases in inventory over the past five years have also seen significantly fewer homes on the market after two months.
The Trulia Inventory and Price Watch is an analysis of the supply and affordability of starter homes, trade-up homes, and premium homes currently on the market. Segmentation is important because home seekers need information not just about total inventory, but also about inventory in the price range they are interested in buying. For example, changes in total inventory or median affordability don’t provide first-time buyers useful information about what’s happening with the types of homes they’re likely to buy, which are predominantly starter homes.
Looking at the housing stock nationally and in the 100 largest U.S. metros from Q2 2012 to Q2 2017, we found:
- Nationally, the number of starter and trade-up homes on the market has decreased substantially, falling 15.6% and 13.1% respectively, during the past year, while inventory of premium homes has fallen 3.9%.
- The persistent and disproportional drop in starter and trade-up home inventory is pushing affordability further out of reach of homebuyers. Starter and trade-up homebuyers need to spend 3.1% and 1.7% more of their income than this time last year, whereas premium homebuyers only need to shell out 0.9% more of their income;
- Across metros, falling inventory is strongly correlated with how long homes stay on the market. On average, the more a market’s housing inventory has fallen over the past five years the fewer share of homes are still on the market after two months. Homes are moving fastest this spring in San Jose, Calif., and Oakland, Calif, where fewer than 21% of homes are still on the market after two months.
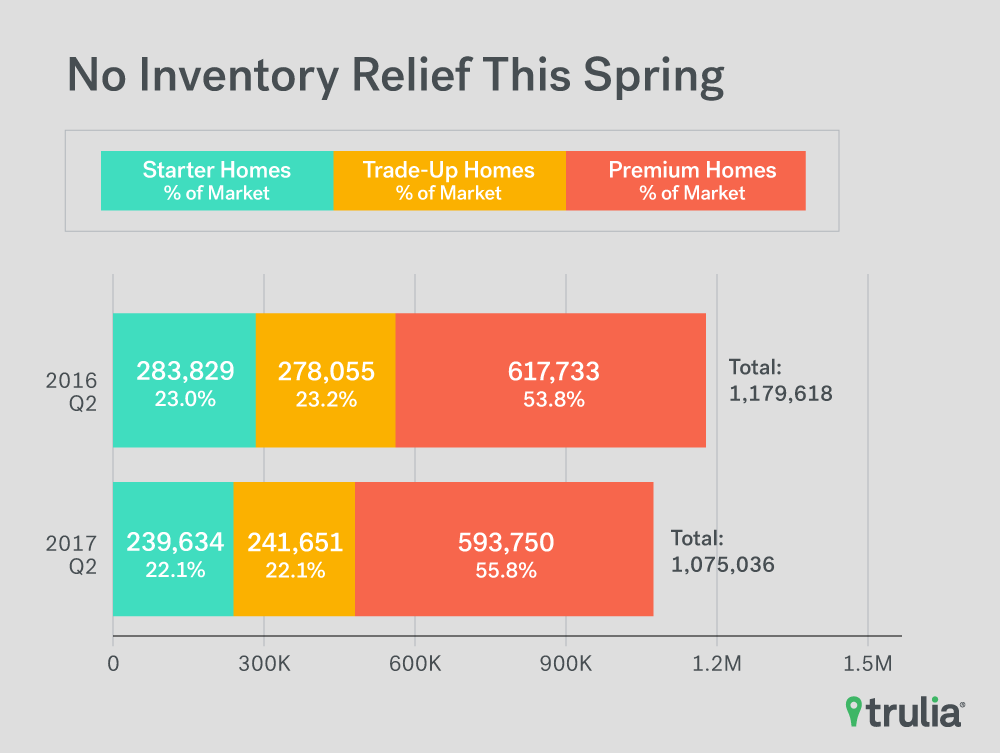
No Inventory Relief This Spring
The spring home buying season has not brought much relief for inventory constrained homebuyers. Although we’ve seen a healthy but seasonal uptick in inventory over last quarter, inventory has fallen 8.9% over the past year and for the ninth straight quarter. In addition:
- The number of starter homes on the market dropped by 15.6%, while the share of starter homes dropped from 23% to 22.1%. Starter homebuyers today will need to shell out 3.1% more of their income towards a home purchase than last year;
- The number of trade-up homes on the market decreased by 13.1%, while the share of trade-up homes dropped from 23.2% to 22.1%. Trade-up homebuyers today will need to pay 1.7% more of their income for a home than last year;
- The number of premium homes on the market decreased by 3.9%, while the share of premium homes increased from 53.8% to 55.8%. Premium homebuyers today will need to spend 0.9% more of their income for a home than a year ago.
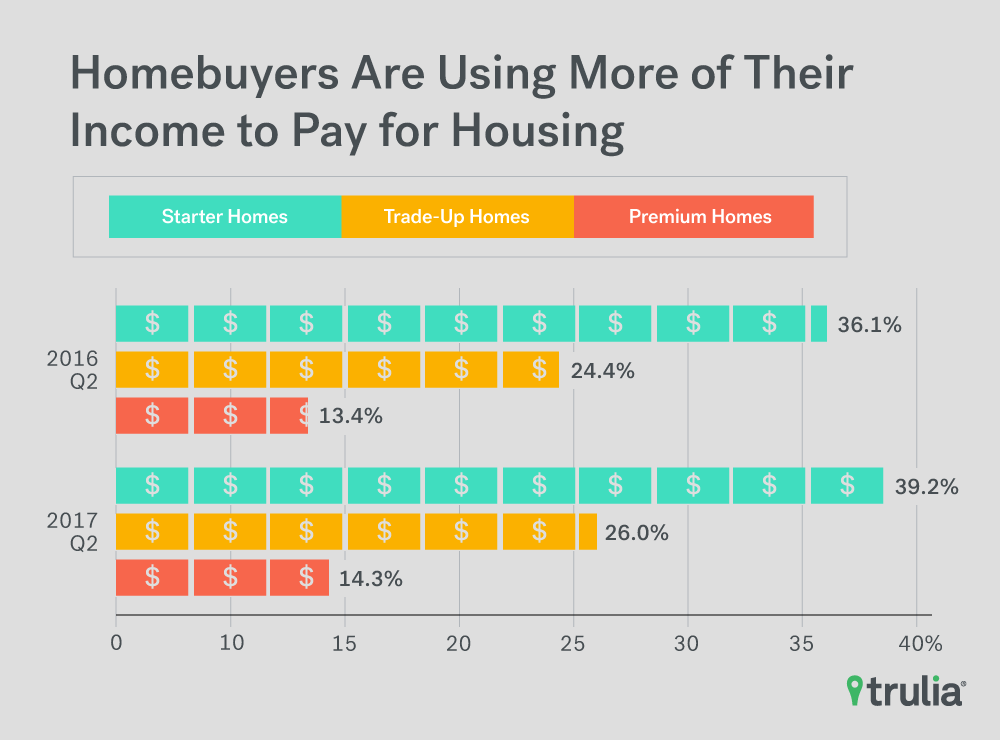
Falling inventory has also pushed affordability of homes across all segments to new post-recession lows. Starter homebuyers have been hurt the most, with the median buyer needing to dedicate 39.1% of their monthly income to buy a starter home – a 3.1 percentage-point increase from last year and up from 31.7% in Q2 2012. Though trade-up and premium homes are still relatively affordable, the share of income these buyers would have to spend on such homes also reached post-recession highs. For example, trade-up and premium home buyers would need to spend 26% and 14.3% of their income to buy a home, respectively, but both are up from 21.5% and 11.7% just five years ago. Clearly, the inventory crunch hasn’t helped housing affordability across the U.S.
Falling Inventory Is Pushing Homebuyers To Take Down Homes at Record Pace
Affordability isn’t the only thing falling as a result of the inventory crunch: the share of homes still on the market after two months is at its lowest since we started keeping track in 2012. When homes are in short supply, home buyers respond not only by bidding up the price of homes, but also by closing on homes faster to gain a competitive edge over their competition. Over the past five years, that’s exactly what we’ve seen: 57% of homes were still on the market after two months back in 2012, while today that number has fallen to 47%.
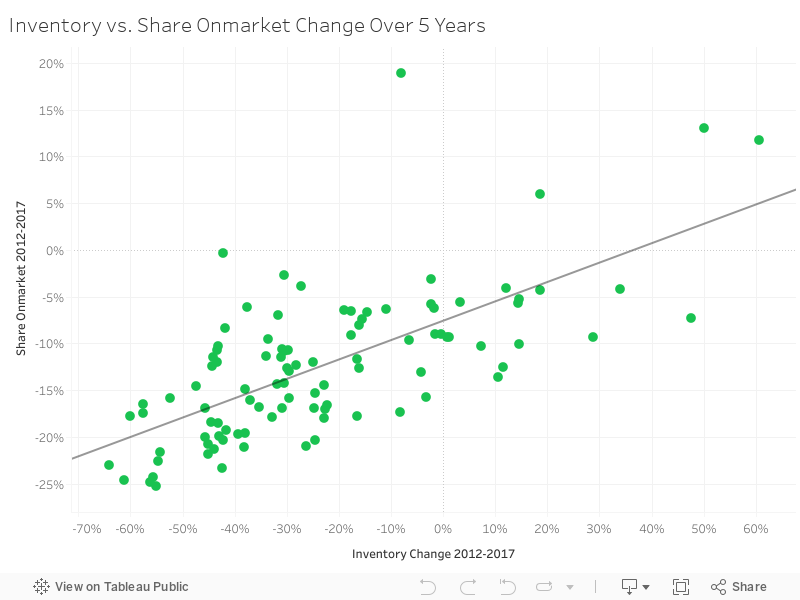
In fact, across metros we find a strong and statistically significant correlation between 5-year changes in inventory and 5-year changes in the share of homes still on the market after two months. Markets that have witnessed larger decreases in inventory have experienced larger declines in the share of homes still sitting on the market after two months. The linear correlation was quite strong (0.68) and statistically significant, suggesting that the nation’s inventory woes over the past five years isn’t just hurting affordability – it’s also making the home buying experience more hurried.
Where have homebuyers been most hurried this spring? The West. All but one of the top 10 fastest moving markets – Columbus, Ohio,– are there, with the highest concentration in the San Francisco Bay Area. For example, fewer than 25% of homes are still on the market after two months in San Jose (20% and number one on our list), Oakland (20.2% and number two on our list), and San Francisco (23.7% and number four). Seattle and Salt Lake City round out the top five, with just 21.9% and 26% of homes still on the market after two months.
| America’s Fastest and Slowest Moving Markets | |||
| Fastest Moving Markets, Spring 2017 | Slowest Moving Markets, Spring 2017 | ||
| U.S. Metro | % of homes on market after two months | U.S. Metro | % of homes on market after two months |
| San Jose, CA | 20.0% | Miami, FL | 62.3% |
| Oakland, CA | 20.3% | Fairfield County, CT | 60.8% |
| Seattle, WA | 21.9% | Winston-Salem, NC | 57.5% |
| San Francisco, CA | 23.7% | Knoxville, TN | 57.4% |
| Salt Lake City, UT | 26.0% | Greensboro-High Point, NC | 57.2% |
| Tacoma, WA | 27.7% | Cape Coral-Fort Myers, FL | 56.3% |
| San Diego, CA | 28.2% | Lake County-Kenosha County, IL-WI | 55.7% |
| Colorado Springs, CO | 31.6% | Syracuse, NY | 55.6% |
| Columbus, OH | 32.8% | Pittsburgh, PA | 55.2% |
| Denver, CO | 33.6% | North Port-Sarasota-Bradenton, FL | 54.2% |
| NOTE: Among the 100 largest U.S. metro areas. % of homes on market after two months calculated by looking at the share of homes that were on the market on April 1, 2017 that were still on the market on June 1, 2017. | |||
The slowest moving markets are predominantly in the South and Northeast. Each of the top 10 slowest moving markets are east of the Mississippi, with the highest concentration in Florida and South Carolina. For example, more than 54% of homes are still on the market after two months in three large Florida metros – Sarasota (54.2% and number ten on our list), Cape Coral-Fort Myers (56.3% and number six on our list), and Miami (62.3% and number one on our list), while two of the largest markets in North Carolina – Winston-Salem (57.5%) and Greensboro-High Point (57.2%) – make the top five. The other two markets to make the top five slowest moving markets are Fairfield County, Conn., (60.8%) and Knoxville, Tenn., (57.4%).
The Skinny on Skinny Inventory
As the number of homes on the market has fallen over the past five years, so has both affordability and the share of homes that stay on the market after two months. Is there anything that homebuyers can do this spring? Yes. While homebuyers can do little to combat declining inventory and affordability, there are tips that homebuyers can take to snag a home in a fast moving market.
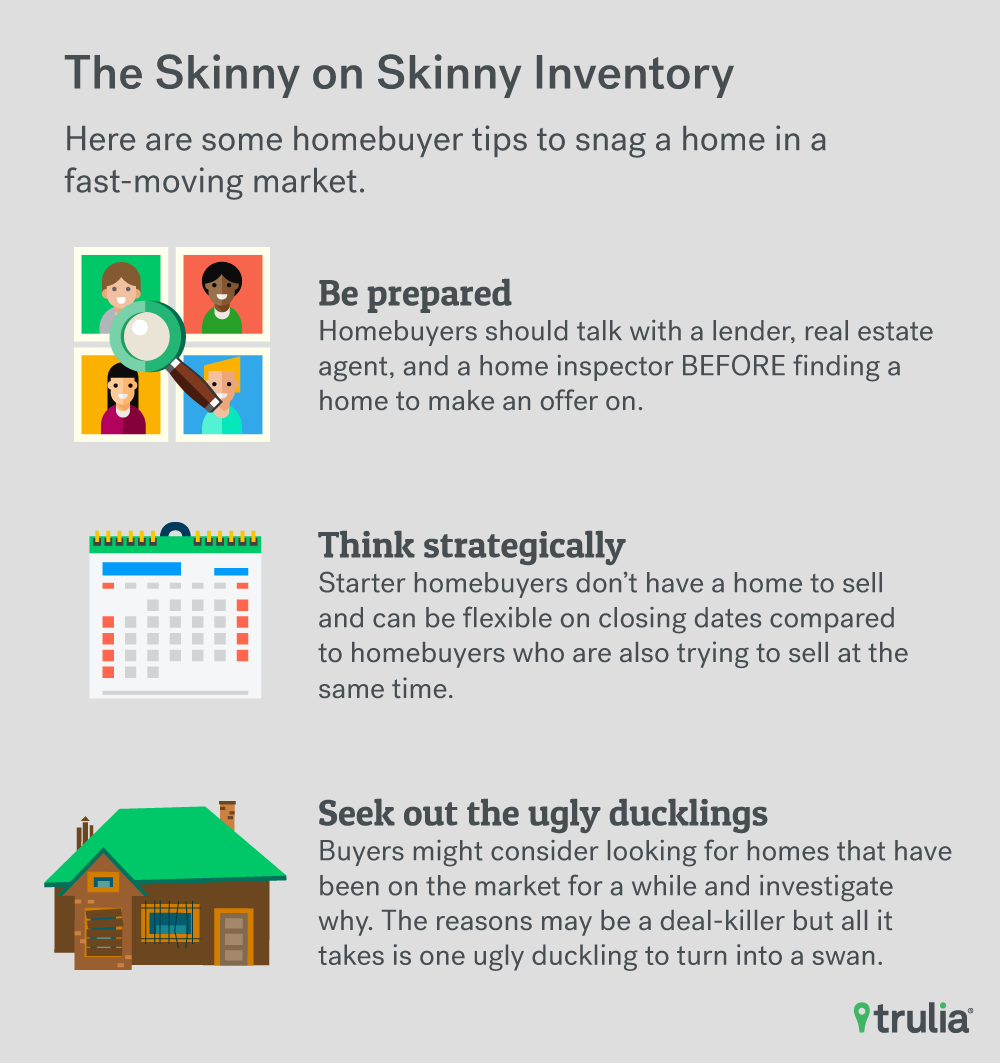
First, be prepared. Homebuyers should have all of their home buying ducks in a row before starting their search. This includes talking with a lender, real estate agent, and a home inspector BEFORE finding a home you’d like to make an offer on. Homebuyers should not only discuss their needs with these experts, but they should be able to employ their expertise at a moment’s notice.
Second, starter home buyers should think strategically about employing their competitive advantage in the marketplace: they don’t have a home to sell. Most sellers are also buyers, and as a result, will also be trying to snag a fast moving home. As a result, sellers often need flexibility on closing dates. Since starter buyers don’t have a home to sell, they are thus better positioned to work with sellers on flexible closing dates when compared to homebuyers who are also trying to sell a home at the same time.
Last, homebuyers frustrated by not being able to move fast may have better luck seeking out the ugly ducklings of the housing market. Instead of trying to strike quickly as soon as a home comes onto the market, buyers might want to consider looking for homes that have sat on the market for a while and figuring out why. Though the reasons are more likely to be a deal-killer than not (needs a new foundation, roof, electrical, etc.), all it takes is just one that isn’t to find success.
Methodology
Each quarter, Trulia’s Inventory Monitor provides three metrics: (1) the number and share of inventory that are starter homes, trade-up homes, and premium homes, (2) the change in share and number of these homes, and (3) the affordability of those homes for each type of buyer. For the first edition of this report, we back-calculated inventory for each quarter back to the first quarter of 2012 through the first quarter of 2016.
We define the price cutoffs of each segment based on home value estimates of the entire housing stock, not listing price. For example, we estimate the value of each single-family home and condo and divide these estimates into three groups: the lower third we classify as starter homes, the middle third as trade-up homes, and the upper third as premium homes. We then classify a listing as a starter home on the market if its listing price falls below the price cutoff between starter and trade-up homes. This is a subtle but important difference between our inventory report and others. This is because the mix of homes on the market can change over time, and can cause large swings in the price points used to define each segment. For example, if premium homes comprise a relatively large share of homes for sale, it can make the lower third of listings look they’ve become more expensive when in fact prices in the lower third of the housing stock are unchanged.
Our national metrics are a weighted sum of listings and weighted average of affordability of the 100 largest metropolitan areas and our inventory measure is an average of snapshots taken on the first of each month of the quarter. Last, we measure affordability as the share of income needed to purchase the median priced home in each segment relative metro household income terciles. To lessen the downward skew of income of households in the lowest tercile, we estimate starter homebuyer’s income using only household incomes of homeowners within this segment.
To find out how long homes are staying on the market, we calculated the share of homes for sale on Trulia over a two-month period. We first looked at homes listed on April 1, 2017, then counted how many were still for sale on June 1, 2017. Faster-moving markets had a lower percentage of homes still on the market after two months, while slower-moving markets had a higher percentage.
Our two-month measure is similar to a common housing statistic: days on market (DOM). In general, housing markets with more inventory and fewer buyers will have a higher share of for-sale homes remaining on the market after one month and a higher median DOM. But we prefer our one-month measure over the widely watched DOM as a way to determine how quickly homes are moving in a market. Why? We think DOM is potentially misleading. If lots of new inventory suddenly lands on the market, then median DOM could fall thanks to all those newly listed homes. Thus, a low median DOM might indicate that buyers are snapping up homes quickly, so homes aren’t staying on the market long (a seller’s market). But it could also signal that a lot of new inventory has just come onto the market (a buyer’s market). As a result, it’s difficult to decipher what’s really going on based on DOM alone.

