
The homeownership rate for immigrants (foreign-born U.S. residents) is slowly gaining ground against that of domestic-born residents. Separately, states where immigrants have resided in the United States for longer periods of time boast higher rates of immigrant homeownership.
Immigration, both legal and illegal, is a central issue in this year’s political season. In this report, we look at purchase rates of foreign- and native-born buyers, as well as regional differences in immigrant homeownership rates.
Many consider homeownership to be an indicator of household prosperity and economic growth. National Association of Home Builders Economist Paul Emrath found in a 2009 study that new home buying spurs employment and related economic activity that benefits communities. And Robert M. Couch of the Joint Center for Housing Studies of Harvard University notes that “households that are able to convert their greatest monthly living expense – rent—into a tax-protected asset through amortizing long-term debt have a powerful tool for accumulating wealth.”
Today, those born outside the U.S. trail those born in the U.S. in homeownership rate. However, the gap has been shrinking since 2000. The foreign born are doing well in some states, not so great in others.
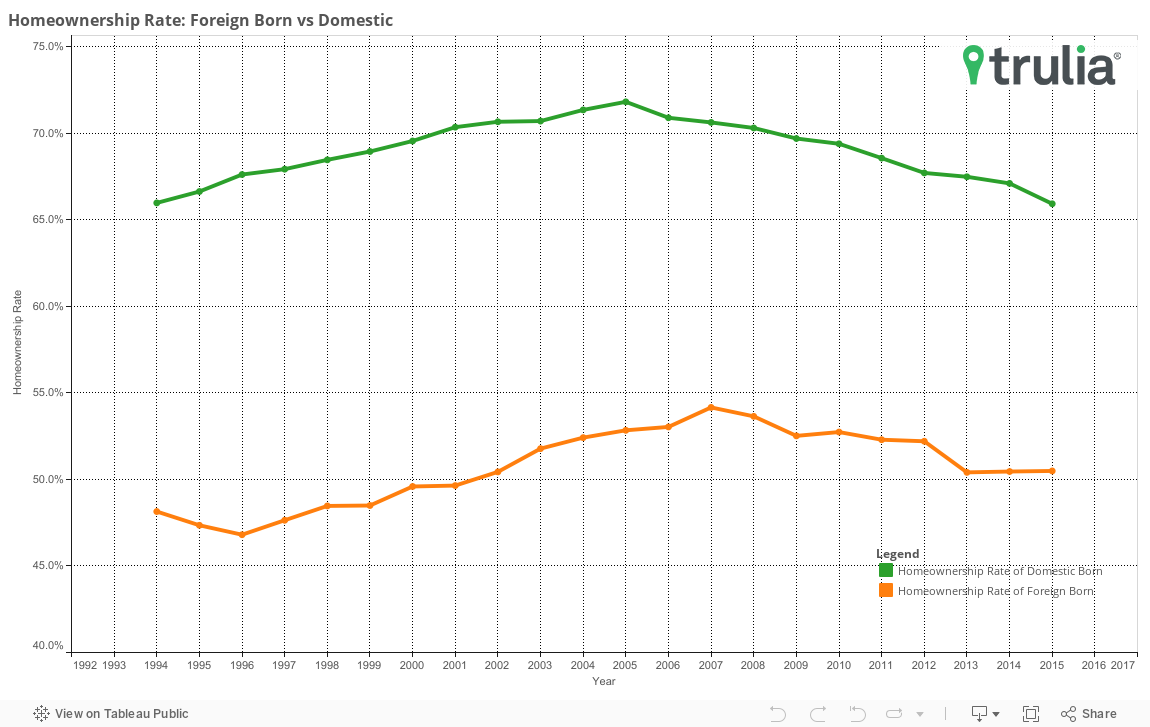
- The gap in homeownership rates between native-born U.S. residents and foreign-born immigrants has been cut to 15.4 percentage points from 20.7 percentage points in 2001.
- After two decades (1994-2015), the homeownership rate of domestic born residents is roughly unchanged while that of foreign born residents increased 2.3 percentage points.
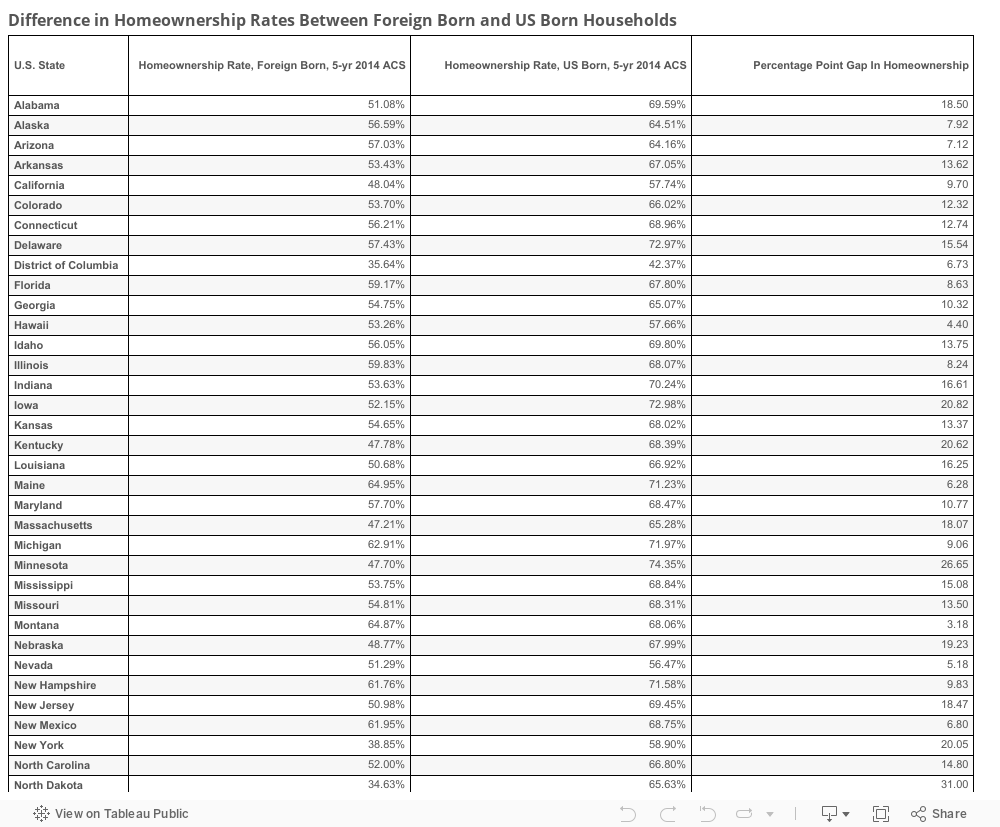
- New York and California have the biggest foreign-born populations but have dramatically different immigrant-homeownership rates compared to native-born residents – In New York, the gap between the two cohorts is 20.1 percentage points while in California, that gap is only 9.7 percentage points.
In 1994, the homeownership rate of those born in the U.S. was 66% while that of the foreign born was 48.1%, representing a 17.8 percentage point difference. That disparity became wider until the early 2000s to about 20.7 percentage points in 2001. That gap hit its lowest point in 2015 at 15.4 percentage points.
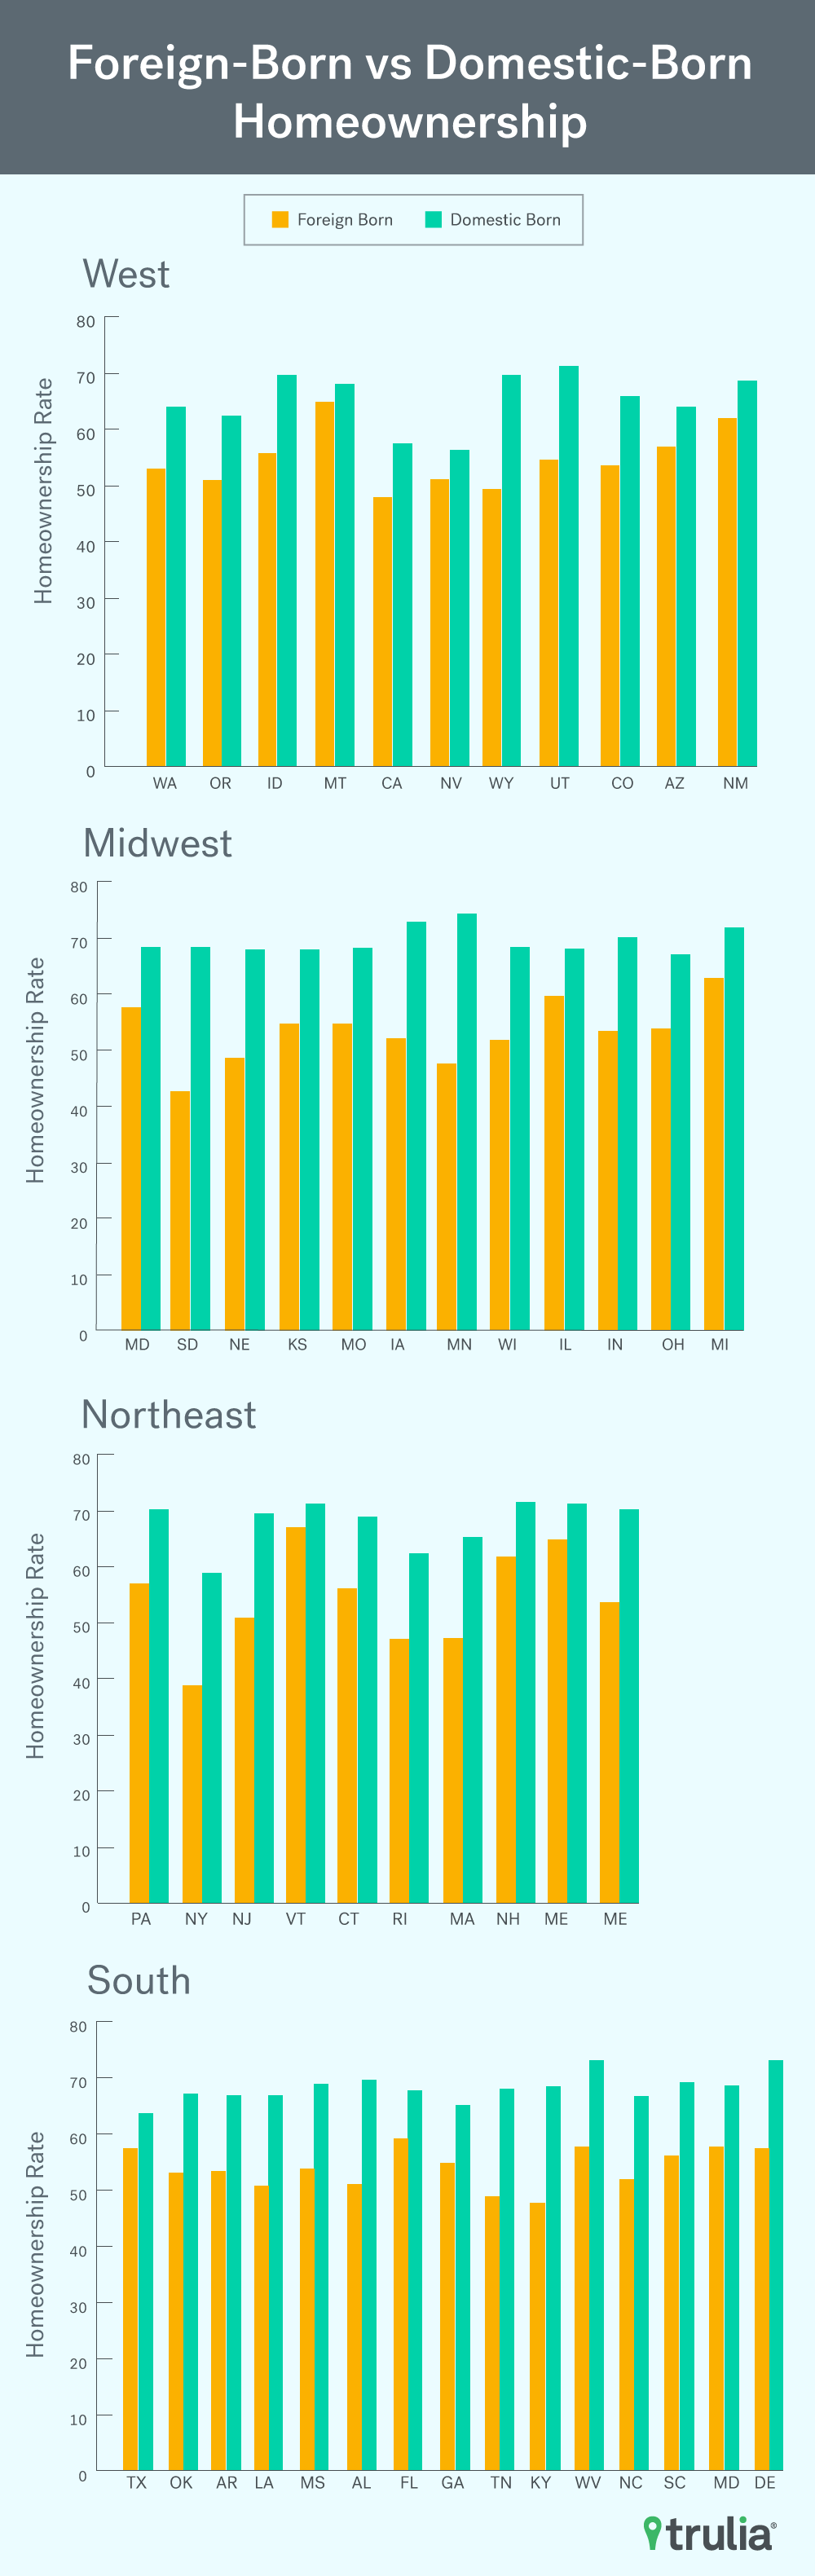
We then dug a little deeper to examine which states and metro areas attract the most foreign born and how the foreign born fare against those born domestically when it comes to homeownership rates.
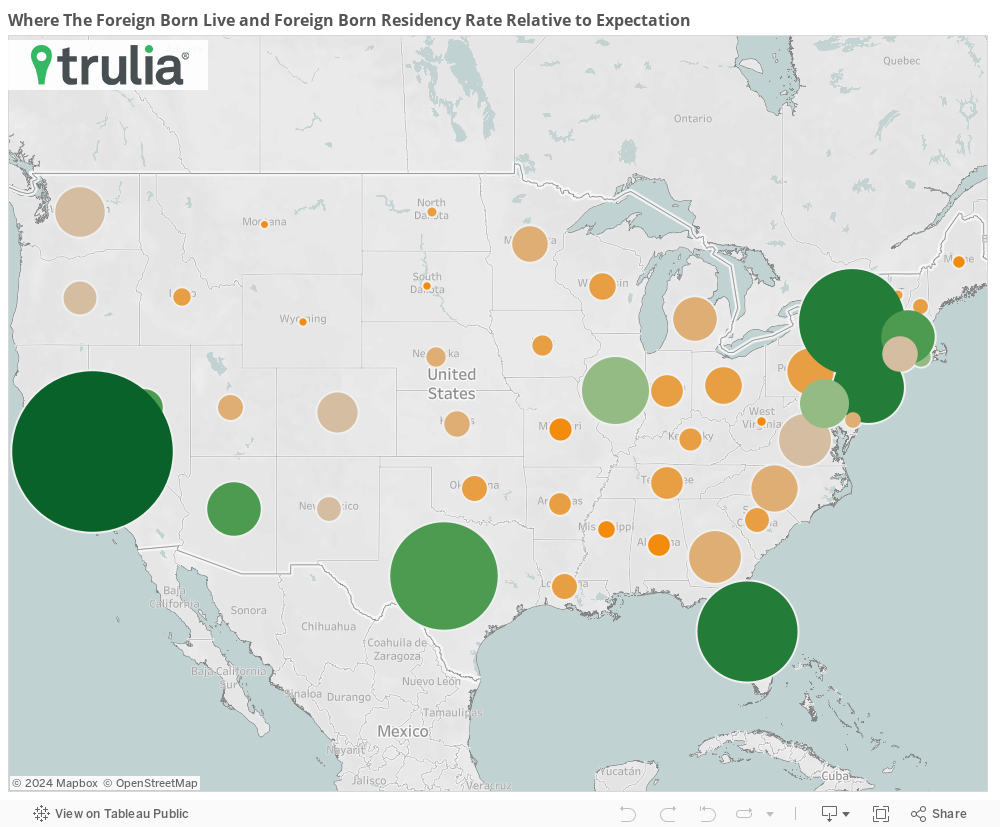
Consider (in terms of eye color): in a world where all things are equal, if 60% of all people had brown eyes, our expectation would be that 60% of brown-eyed people also live in any state. If 66% of brown-eyed people actually lived in that state, then we could say that brown-eyed people live in that state at a rate that is 10% greater than expectation– what we call the “residency rate relative to expectation,” (60% population/expectation vs. 66% actual equals 10% difference vs. expectation).
Substituting birthplace for eye color, we calculated for each state the foreign-born residency rate relative to expectation. Not surprisingly, California (91.2%) and New York (63.4%) were the top two states with the greatest foreign-born residency rate relative to expectation. States with the lowest foreign-born residency rates relative to expectation were West Virginia (-88.5%), Montana (-86.2%), South Dakota (-82.7%), Missouri (-76.4%), and Mississippi (-73.2%).[1]
[1] Green means a greater proportion of foreign-born reside in that state relative to expectation, while red means the opposite. The size of the circle represents what percent of foreign-born population in the U.S. resides in that particular state. If you hover over each circle, you can see additional information about the states.
Compared with national native-born homeownership rates, the two states with the highest share of foreign born, New York and California, showed very different results from each other. U.S. born households enjoyed a homeownership rate that is 20.1 percentage points higher than foreign born households in New York, while in California the U.S. born only held a 9.7 percentage point advantage over foreign born households, as you can see under the fourth column titled “Percentage Point Difference”.
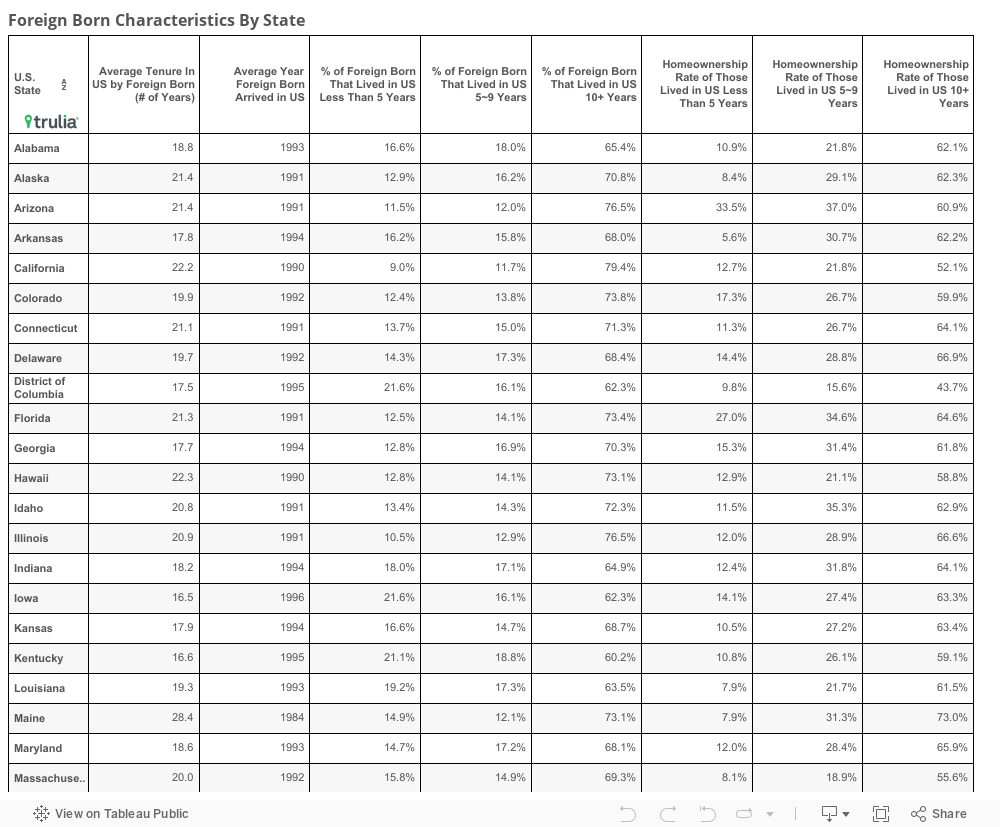
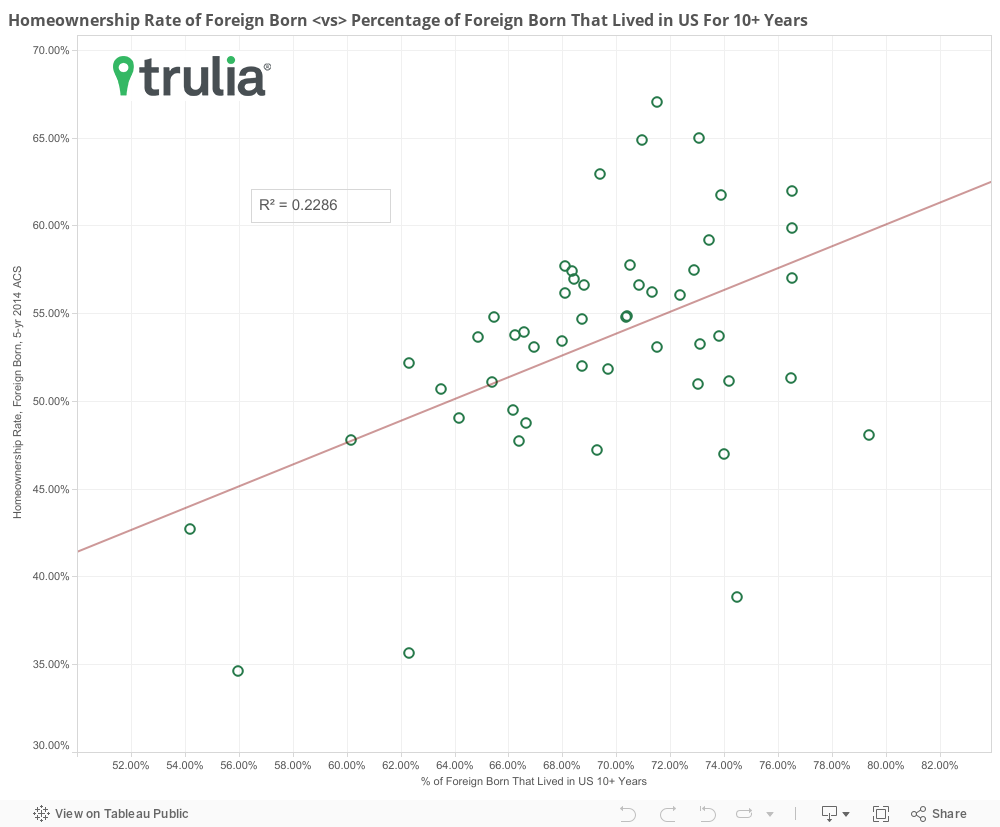
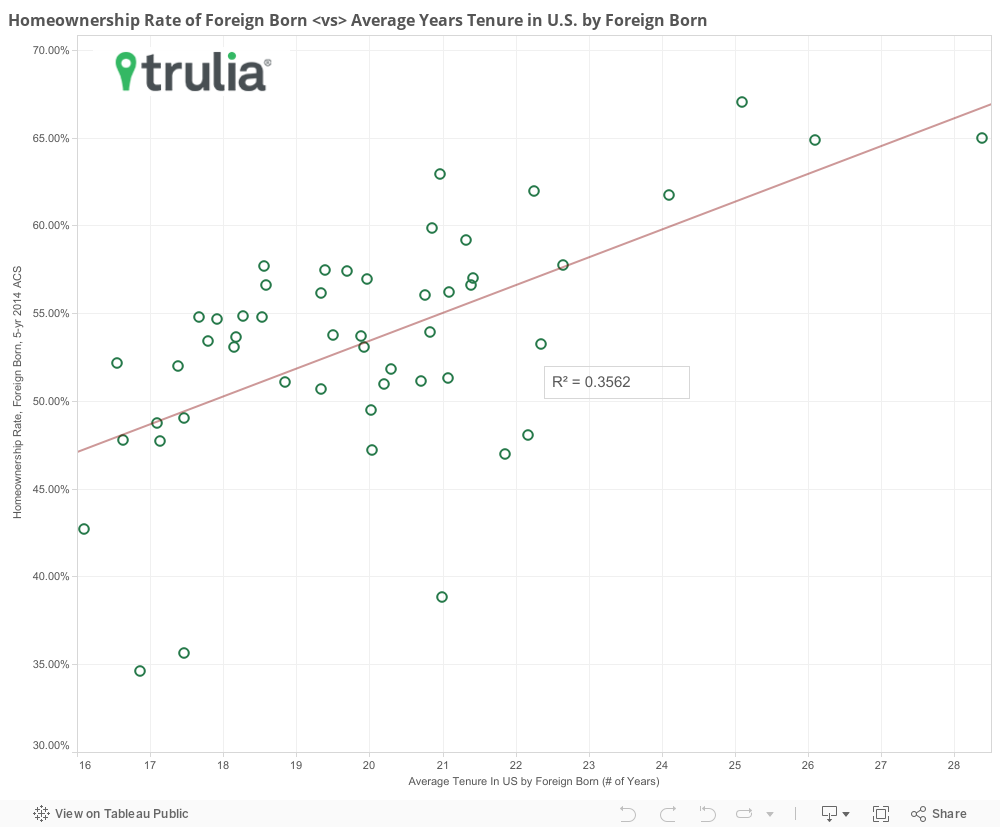
Finally, how long immigrants lived in the country has a big influence on whether they own a home. Immigrants who lived in the U.S. less than five years had a much lower homeownership rate than immigrants who lived in the U.S. for 10+ years in every state. This is likely due to the fact that immigrants who lived in the U.S. less than five years do not have adequate credit history in the U.S. to obtain a mortgage, which forces them to rent rather than own. Thus, those states with a greater proportion of foreign-born having lived in the U.S. for longer durations saw higher rates of homeownership. Concurrently, the higher the homeownership rate of foreign-born households, the more likely it is that the difference in homeownership rate between foreign-born households and U.S.-born households is smaller. This insight is best illustrated by the three scatter plots that follow the table below.
Methodology
Both U.S. Census Current Population Survey and American Community Survey data made available by IPUMS was used for this study. For calculations involving the American Community Survey data, 5-year 2014 data was used.
The U.S. Census Bureau defines a foreign-born resident as anyone who is not a U.S. citizen at birth. This includes those who have become U.S. citizens through naturalization. Everyone else constitutes the native-born population, composed of anyone who is a U.S. citizen at birth, including people born in the United States, in Puerto Rico, in a U.S. Island Area (American Samoa, Guam, the Commonwealth of the Northern Mariana Islands, and the U.S. Virgin Islands), or abroad to a U.S. citizen parent or parents.

