
Recent immigrants from countries named in President Donald Trump’s March 6 executive order struggle to find work, generate income and buy homes at the same rate as other immigrants and domestic-born residents.
However, those who have resided here longer not only have closed the gap, but by many measures have also surpassed other residents when it comes to acquiring the necessary financial stability required for homeownership.
President Trump identified Iran, Libya, Somalia, Sudan, Syria and Yemen in a revised executive order that temporarily banned travel to the United States from these six countries. A seventh, Iraq, was removed after being included in the original order signed in January. That order was blocked by the courts. Likewise, a federal judge blocked the new order on March 15 just hours before it was to go into effect. The Trump administration has vowed to appeal the ruling.
In a follow up to Trulia’s 2016 report on immigration homeownership rates, we focus on the fortunes of those born in the six affected countries who have already immigrated to the United States. We compare their homeownership, higher education and employment rates not only the domestic-born population, but to immigrants from all countries as well. We found that immigrants from the six nations who arrived 10 or more years ago closely resemble immigrants from all countries who have been here just as long, and have by many measures exceeded them. Indeed, immigrants from the EO-identified nations who have lived in the U.S. for at least 10 years actually have slightly higher rates of homeownership than all foreign-born residents as a group.
Those rates begin to fall precipitously against their immigrant peers for those who arrived in the states in the last five years ending 2016.
Our analysis, drawn mostly from U.S. Census Bureau survey data found:
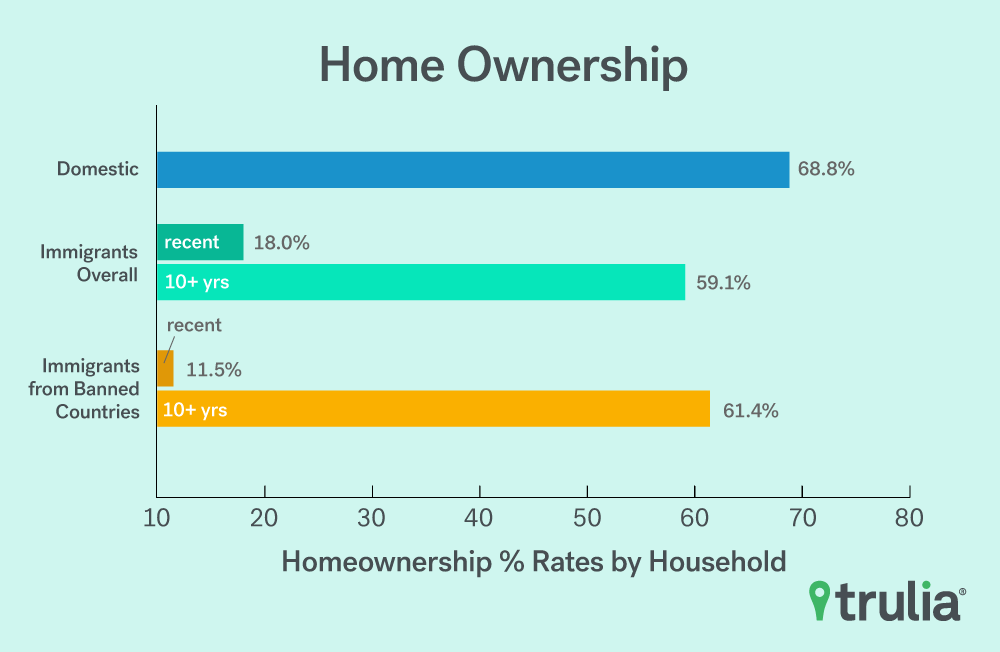
- Households headed by people born in countries named in the executive order have owned at the same rate, 51%, as all foreign-born households sampled. That compares to 68.8% of households headed by domestic-born people based on census data going back to 1994.
- Only 11.5% of people born in the ‘travel ban’ countries who were recent immigrants (had lived in the U.S. for less than 5 years) said that they owned their home. This compares with 18% for all foreign-born household heads.
- By the time people from the ‘travel ban’ countries have been here for 10 or more years though, they had completely closed the homeownership gap and passed the overall foreign-born population at 61.4% compared with 59.1%.
| Homeownership: Recent Immigrants From EO-Identified Counties vs. Others | |||||||
| Time Period Surveyed | Domestic Born % Own | Foreign Born % Own | Foreign Born Recent Immig. % Own | Foreign Born 10+yr Immig. % Own | ‘Travel Ban’ Country Born % Own |
‘Travel Ban’ Country Born Recent Immig. % Own | ‘Travel Ban’ Country Born 10+yr Immig. % Own |
| 1999 or earlier | 67.6% | 47.8% | 14.7% | 57.5% | 56.3% | 18.1% | 66.1% |
| 2000 to 2009 | 70.6% | 52.1% | 18.9% | 60.9% | 52.9% | 14.0% | 60.5% |
| 2010 or after | 67.4% | 51.3% | 18.8% | 57.9% | 47.4% | 8.1% | 60.2% |
| All Time Combined | 68.8% | 51.0% | 18.0% | 59.1% | 51.0% | 11.5% | 61.4% |
Where Immigrants From Targeted Nations Call – and Find – Home
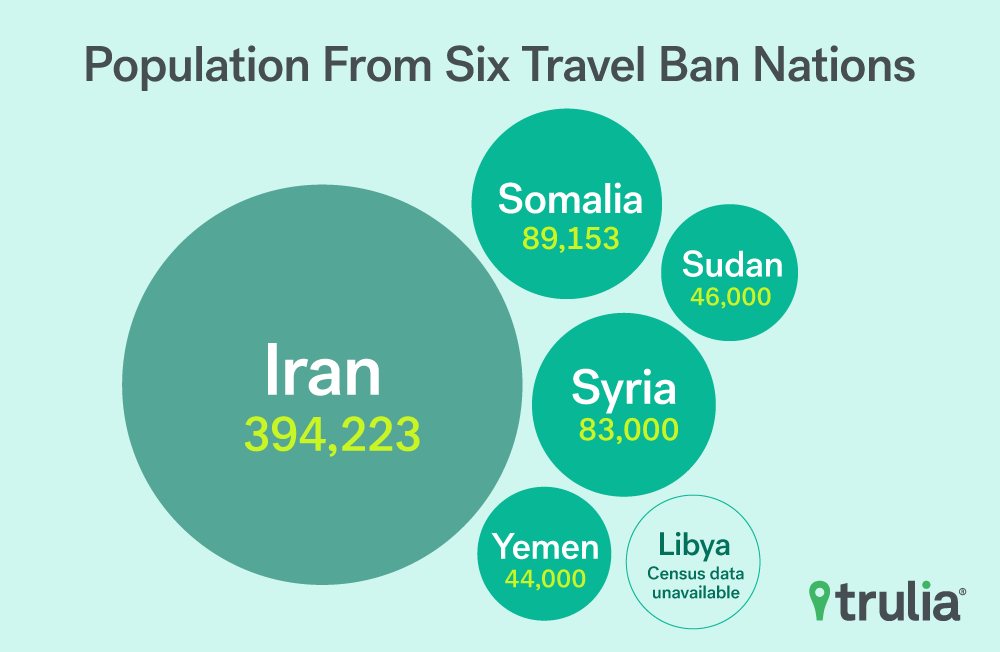
Immigrants from nations named in the executive order represent a tiny fraction of the overall foreign-born population in the U.S. and an even smaller fraction of the U.S. population overall –less than 700,000 of a nation of 321 million. The ‘travel-ban’ nation with the biggest U.S. population is Iran, with 394,223 residents; the smallest is most likely Libya, which the census groups with other North African nations in its surveys.
Iran leads in population, but the rate of immigration has steadied, increasing just 10.4% between 2010 and 2015. Contrast that increase with the immigration rate from Syria, up 38.3%, or about 23,000, during the same period – a trend not surprising given the refugee crisis created by that nation’s civil war.
| Immigrant Population From Six ‘Travel Ban’ Nations | ||||||
| Country | 1990 | 2000 | 2010 | 2015 | % increase since 2010 | % of all foreign-born U.S. residents |
| Iran | 211,000 | 283,000 | 357,000 | 394,223 | 10.4% | 0.92% |
| Libya* | 4,000 | – | – | – | – | – |
| Somalia* | 2,000 | 36,000 | – | 89,153 | – | 0.21% |
| Sudan | 4,000 | 18,000 | 63,000 | 46,000 | -27.0% | 0.11% |
| Syria | 37,000 | 55,000 | 60,000 | 83,000 | 38.3% | 0.19% |
| Yemen | 2,000 | 18,000 | 40,000 | 44,000 | 10.0% | 0.10% |
| * Census data unavailable. | ||||||
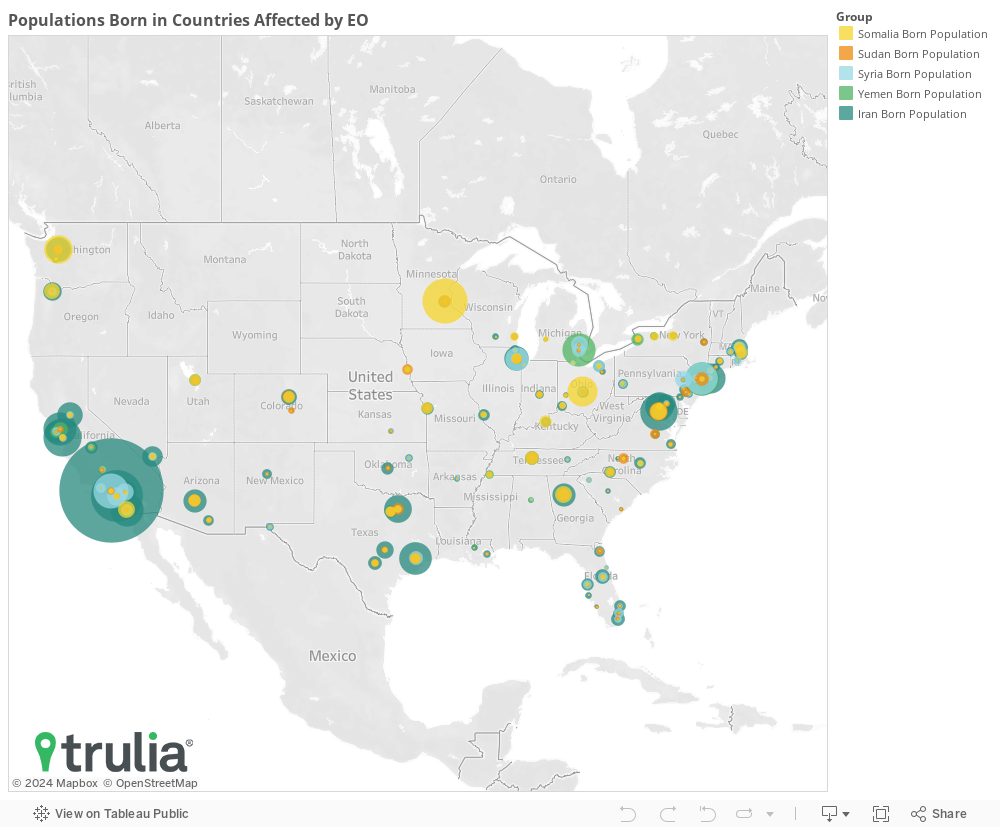
Immigrants from the ‘travel ban’ nations are scattered across the U.S. As a whole, the biggest population is in Los Angeles, followed by New York, Orange County, Minneapolis and then Washington D.C.
Making the Grade: Working-Age Immigrants From Six Nations Are More Educated
Immigrants from the six nations have a big advantage when it comes to one of the strongest determinants of homeownership: higher education.
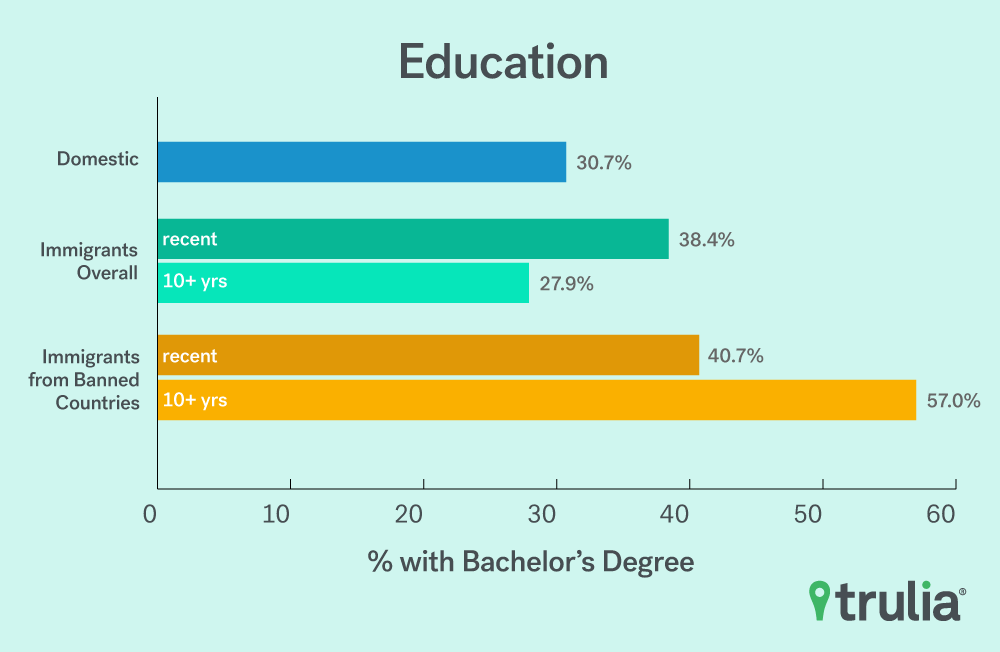
- Looking only at working-age people (25-55), 52.1% of people from the six countries have a bachelor’s degree compared with 29.7% of all foreign-born people and 30.7% of domestic-born people.
- When looking at graduate degree attainment, the difference is even larger with people from the six countries having a graduate degree at more than twice the rate of either all foreign- or domestic-born counterparts at 22.6% compared with 11.2% and 9.7%, respectively.
- 1% of people from banned countries have less than a high school education compared with 7.1% of domestic-born people. However only 5.3% of people from banned countries lack a high school diploma by the time they have been here for more than 10 years compared with 16.2% of recent arrivals.
| Higher Ed: Immigrants From ‘Travel Ban’ Countries vs Other Immigrants | |||||
| Time Period Surveyed | Foreign Born Recent Immig. % with Bachelor Degree | Foreign Born 10+yr Immig % with Bachelor Degree | ‘Travel Ban’ Country Born % with Bachelor Degree | ‘Travel Ban’ Country Born Recent Immig. % with Bachelor Degree | ‘Travel Ban’ Country Born 10+yr Immig. % with Bachelor Degree |
| 1999 or earlier | 33.2% | 25.4% | 60.2% | 51.7% | 64.1% |
| 2000 to 2009 | 35.3% | 27.6% | 55.5% | 28.7% | 60.9% |
| 2010 or after | 46.4% | 29.4% | 44.8% | 44.8% | 48.2% |
| All Time Combined | 38.4% | 27.9% | 52.1% | 40.7% | 57.0% |
Recent Immigrants Struggle Financially
For households headed by recent arrivals from the six countries, the statistics are discouraging: the median income is $25,953 compared with $32,646 for all recent arrival households. Forty percent live below the poverty line, compared to just 9.5% of domestic born and 23% of immigrants from countries not named in the executive order.
As with homeownership though, people from the six countries who have been here for 10 or more years completely close this gap and surpass their foreign AND domestic-born counterparts. ‘Travel-ban’ country headed households that have been here for 10 or more years have a median income of $57,160 compared with $42,560 for all 10+ year heads of foreign born households and $44,490 for domestic-born households.
Including immigrants born in the six nations across all periods, the median household income was $50,000 compared with $40,031 for all foreign-born headed households and $44,490 for domestic-born headed households.
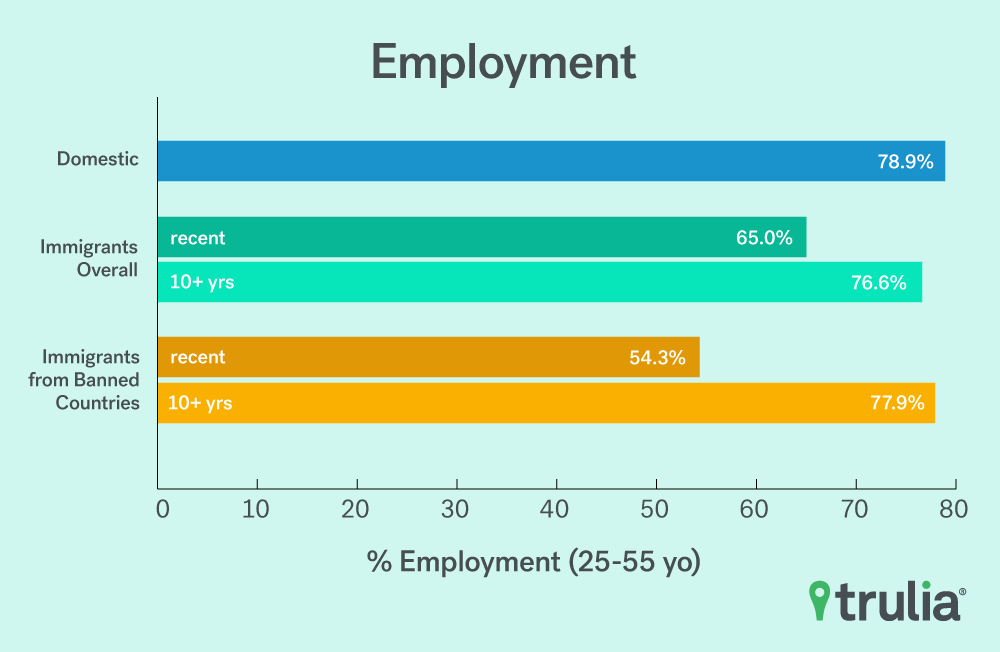
Recent Immigrants Lag Others In Employment
Working-age people (25- to 55-years old) living in the United States who are originally from one of the six countries affected by the order also diverge in the types of types of jobs they take once here.
The most common jobs they hold are generally middle- to lower-income. They include first-line supervisors of sales workers, managers and retail sales. However, they hold these jobs at rates similar to their domestic-born counterparts.
Where they diverge? The immigrants from the nations named in the order are dentists at 8.3 times the rate of domestic-born people. They are also 7.2-times likely to be civil engineers, 5.9-times more likely to be physicians and surgeons and 5.3-times more likely to be pharmacists: generally higher-paying jobs requiring higher education.
Immigrants from these nations also are more often found in lower-wage jobs: driving taxis or working for car services (17.9 times the rate of domestic-born people). These extremes in professions are likely a consequence of the fact that new immigrants arrive with less education and have a long way to go before achieving the same level of success enjoyed by those who came before.
| Employment Among Domestic-born and Foreign-born | |||||||
| Time Period Surveyed | Domestic Born % Employed | Foreign Born % Employed | Foreign Born Recent Immigrant % Employed | Foreign Born 10+yr Immigrant % Employed | ‘Travel Ban’ Country Born % Employed | ‘Travel Ban’ Country Born Recent Immigrant % Employed | ‘Travel Ban’ Country Born 10+yr Immigrant % Employed |
| 1999 or earlier | 80.6% | 73.6% | 61.7% | 77.0% | 74.2% | 60.5% | 79.0% |
| 2000 to 2009 | 79.6% | 75.3% | 67.5% | 77.7% | 75.1% | 53.8% | 79.3% |
| 2010 or after | 76.3% | 73.2% | 63.3% | 75.2% | 68.9% | 53.1% | 75.5% |
| All Time Combined | 78.9% | 74.2% | 65.0% | 76.6% | 72.4% | 54.3% | 77.9% |
Methodology
In conclusion, we found that compared to the immigrant population as a whole, whether immigrants from the six nations are thriving or struggling depends largely on how long they have lived in the United States. After 10 years, many are financially stable enough to become homeowners in their adopted country.
Microdata from the CPS surveys going back to 1994 (when they began asking for country of origin from each respondent) was used to quantify ownership rates, education levels, household income, and occupations for all respondents. For occupation and education levels, only people between the ages of 25 and 55 were used (prime working age years). For household-level data such as ownership rate and household income, all household head responses were used.
Sarah Flood, Miriam King, Steven Ruggles, and J. Robert Warren. Integrated Public Use Microdata Series, Current Population Survey: Version 4.0 [dataset]. Minneapolis, MN: University of Minnesota, 2015.
http://doi.org/10.18128/D030.V4.0.

