Foreign house hunters help drive demand for U.S. homes. Even though rising U.S. prices are discouraging foreigners who were looking for bargains, people from all over the world still have their eye on American real estate. Following up from our earlier analysis of where foreign house hunters are searching, we wanted to see the size of homes that they’re looking at.
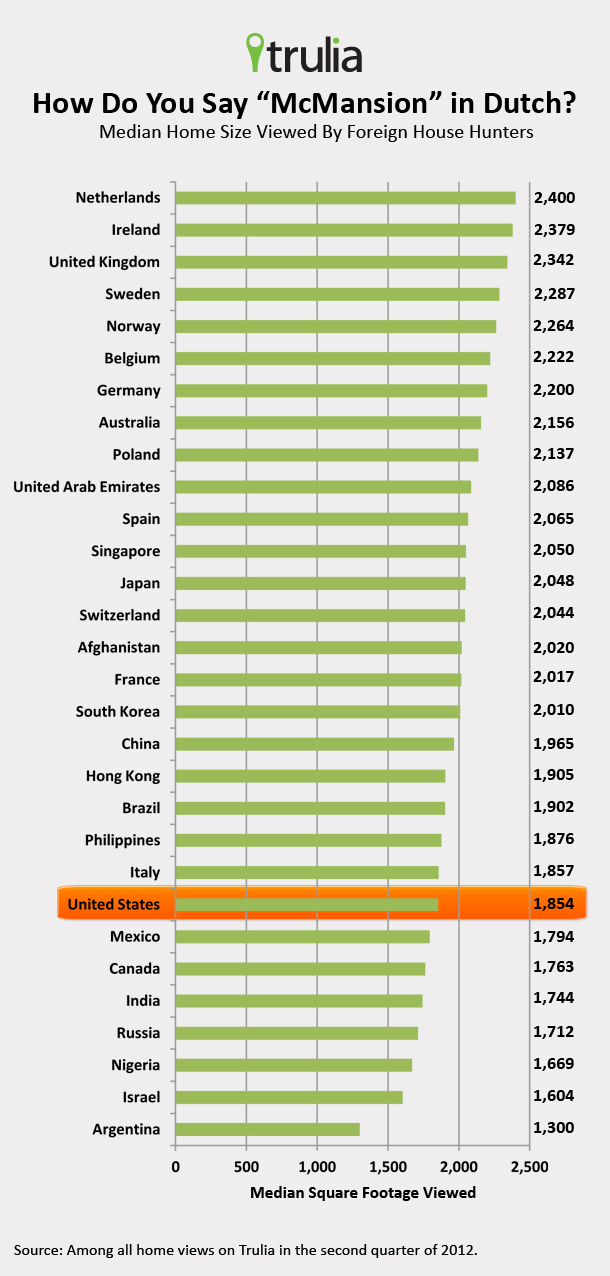
The rest of the world might make fun of Americans for our big portions, big homes and big butts, but it turns out that most foreigners look at bigger homes than what most Americans look at – among all searches of U.S. homes on Trulia. The median home size that Americans view is 1,854 square feet. Most Europeans, however, look at larger homes than that. Of all countries, house hunters from the Netherlands view the largest homes – median size of 2,400 square feet – followed by Ireland, the United Kingdom, Sweden and Norway.
The Dutch, Swedes and Norwegians are also among the world’s tallest people. Do they look at bigger houses because they need more room? Or because countries with taller populations tend to be richer, and people in richer countries can afford bigger homes?
At the other extreme, house hunters from Argentina view homes with a median of just 1,300 square feet – not much more than half the size of homes the Dutch look at. Israelis are also drawn to smaller homes, averaging 1,604 square feet. Most of the property views by Argentines (54%) are condos, apartments or other non-single-family-home units – by far the highest of any country. Argentines look in Miami more than anyplace else, and Israelis look most in New York – and both Miami and New York have strong condo markets. That’s why they’re looking at smaller units.
What about house hunters from Canada, China, the United Kingdom, and elsewhere? Check out the full list in the chart:


