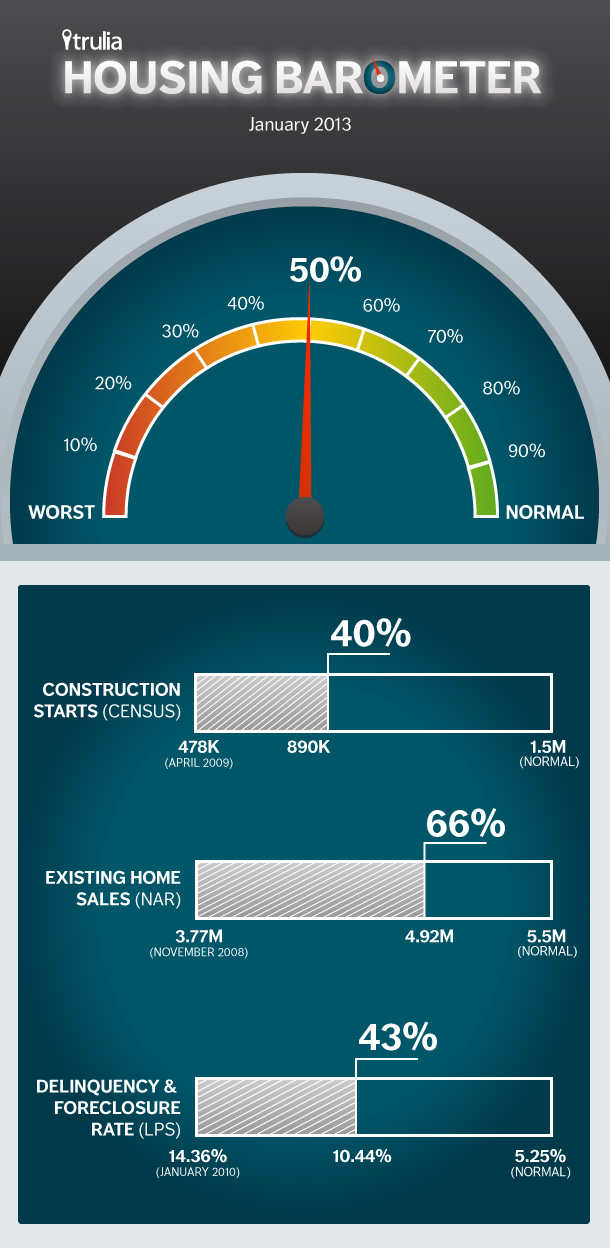
Each month, Trulia’s Housing Barometer charts how quickly the housing market is moving back to “normal.” We summarize three key housing market indicators: construction starts (Census), existing home sales (NAR), and the delinquency-plus-foreclosure rate (LPS First Look). For each indicator, we compare this month’s data to (1) how bad the numbers got at their worst and (2) their pre-bubble “normal” levels.
In January 2013, construction starts slid, while home sales and the delinquency + foreclosure rate both improved slightly relative to December:
- Construction starts fell monthly, but were still up sharply year-over-year. Starts were at an 890,000 annualized rate, down 8.5% month-over-month but up 24% year-over-year. The month-over-month decline was relative to a December spike in multifamily housing starts, which tend to be volatile. January starts were at their second-highest level since July 2008, and single-family housing starts were at their highest level since that same month. Furthermore, residential construction employment was up 2.6% year-over-year in January – outpacing employment overall, which rose 1.5%. Construction starts are now 40% of the way back to normal.
- Existing home sales edged up. Sales rose slightly to 4.92 million in January from 4.90 million in December. Year-over-year, sales were up 9%. But the mix of sales is shifting from “distressed” sales — foreclosures and short sales — to “conventional” home sales. Excluding distressed sales, conventional home sales were up 29% year-over-year in January. Overall, existing home sales are 66% back to normal.
- The delinquency + foreclosure rate improved. After holding nearly steady for three months, the share of mortgages in delinquency or foreclosure fell in January to 10.44%, from 10.61% in December. The January rate is the lowest level since December 2008. The combined delinquency + foreclosure rate is 43% back to normal.
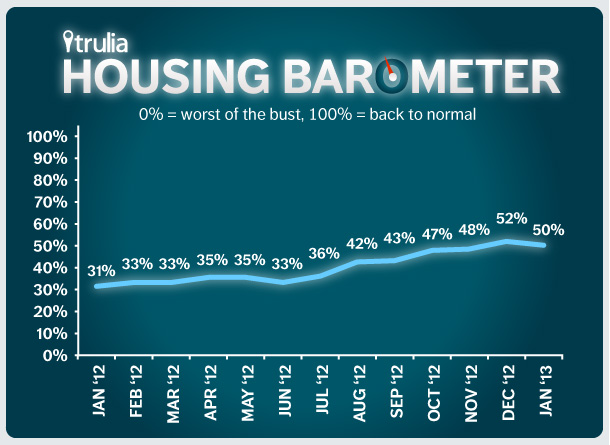
Averaging these three back-to-normal percentages together, the housing market is now 50% of the way back to normal, down from 52% in December. That’s the first setback since June. Cause for alarm? No: the Housing Barometer reached 52% in December thanks to what looks like a temporary spike in multifamily housing starts. Even with this backward step in January, 50% back to normal represents steady progress. But January’s figures are a reminder that housing indicators often have monthly swings, and the longer-term trend is a better guide to the shape of the housing recovery.


