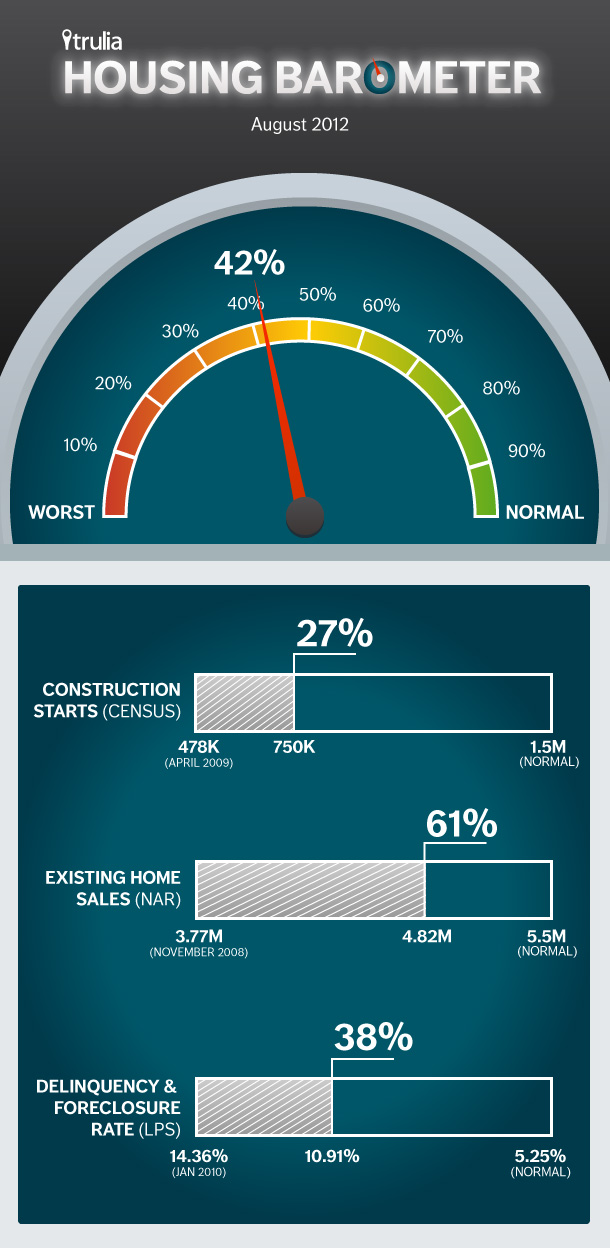
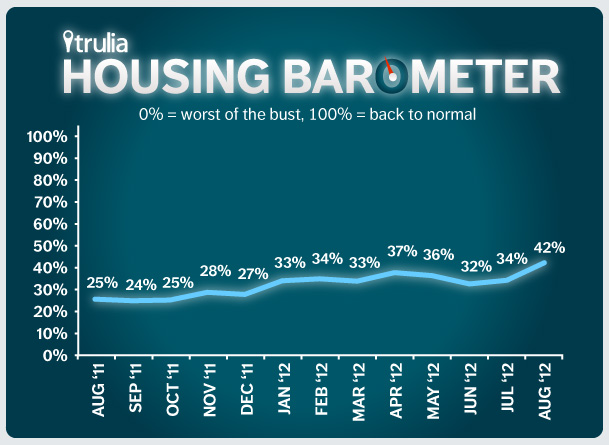
Each month Trulia’s Housing Barometer charts how quickly the housing market is moving back to “normal.” We summarize three key housing market indicators: construction starts (Census), existing-home sales (NAR) and the delinquency-plus-foreclosure rate (LPS First Look). For each indicator, we compare this month’s data to (1) how bad the numbers got at their worst and (2) their pre-bubble “normal” levels.
In August 2012, construction starts held their new high plateau, while home sales rose and the delinquency + foreclosure rate fell:
- Construction starts held roughly steady. Starts in August were at a 750,000 annualized rate, up 2.3% month over month and up 29.1% year over year. Construction activity in August was at its second-highest level since October 2008. Nationally, construction starts are 27% of the way back to normal.
- Existing home sales jumped to their highest level in more than two years. Home sales rose 7.8% month over month to 4.82 million in August – a 9.3% increase from one year ago. Nationally, sales were at their highest level since May 2010, so home sales are now 61% back to normal to from their worst point during the bust. In the West region, however, sharp inventory declines prevented home sales from rising at all year over year.
- The delinquency + foreclosure rate hit a post-recession low. In August, 10.91% of mortgages were delinquent or in foreclosure, down from 11.11% in July. The combined delinquency + foreclosure rate is at its lowest level since March 2009 and is 38% back to normal.
Averaging these three back-to-normal percentages together, the market is now 42% of the way back to normal – up from 34% in July and 25% in August 2011. Remember, the past year has shown that most steps forward in the housing recovery are followed by some steps back, so the recovery from here on out won’t be fast or smooth. Still, the Housing Barometer is at its highest level since the recovery began.


