Tracking This Uneven Recovery
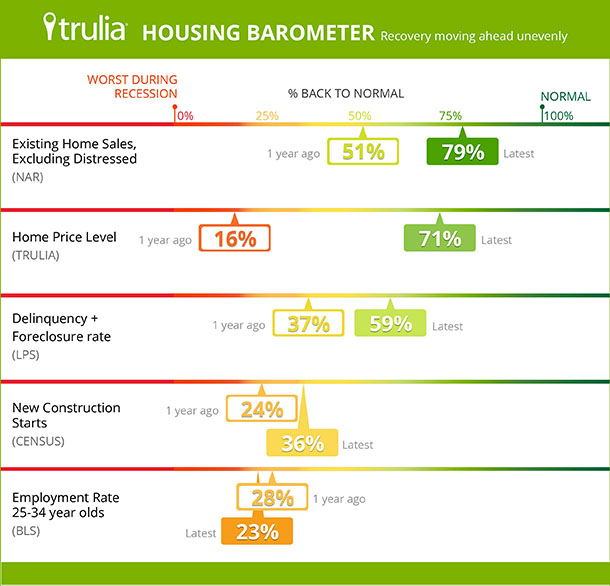
Since February 2012, Trulia’s Housing Barometer has charted how quickly the housing market is moving back to “normal” based on three indicators: construction starts (Census), existing home sales (NAR), and the delinquency + foreclosure rate (LPS). Today, we’re re-launching our Housing Barometer, which better tracks the uneven recovery with some recalibrations and two additional housing market indicators:
- The level of home prices relative to fundamentals, based on our own Bubble Watch report.
- The employment rate for 25-34 year-olds, a key age group for household formation and first-time homeownership, based on the Bureau of Labor Statistics’s (BLS) monthly employment report.
In addition to adding two new measures, we’re excluding distressed sales from existing-home sales because non-distressed sales are a better measure of healthy market activity than overall sales. We’re also using three-month moving averages for the indicators that are reported monthly (sales, delinquency + foreclosure rate, starts, and employment) to smooth out volatility.
For each indicator, we compare the latest available data to (1) the worst reading for that indicator during the housing bust and (2) its pre-bubble “normal” level. We’re also no longer averaging together the “back to normal” levels across different indicators because the average masks huge differences among these indicators. Instead, we are taking a closer look at the recovery of each indicator: three are most of the way back to normal and closing the gap quickly, while two others are stagnating near troublesome lows.
Back to Normal Or Left Behind: 3 in 5 Key Market Indicators Recovering
Of the Housing Barometer’s five indicators, prices and sales are getting close to normal. Delinquencies + foreclosures, while not as close to normal as prices and sales, have improved significantly in the past year. The other two measures – new home starts and jobs for young adults – still have a long way to go:
- Existing home sales (excluding distressed) were 79% back to normal in October, up from 51% one year earlier. While existing and pending home sales have slipped in recent months, distressed sales – foreclosures and short sales – account for much of the drop. The mix of sales continues to shift from distressed to non-distressed, which is a sign of market recovery.
- Prices have had an astounding recovery in the past year. Trulia’s Bubble Watch shows prices were 4% undervalued in Q4 2013, compared with 15% at the worst of the housing bust, which means that prices are almost three-quarters (71%) of the way back to the “normal” level of being neither over- nor under-valued. One year ago, prices looked 13% undervalued – just 16% of the way back to normal from their worst levels – leading home prices to win the “most improved” award over the past year.
- The delinquency + foreclosure rate fell to 8.92% in October after rising to more than 14% during the recession. This rate is now 59% back to normal. Rising prices and an improving economy have caused fewer borrowers to become seriously delinquent on their mortgages in the first place; at the other end of the pipeline, more foreclosures continue to get completed and sold. The remaining foreclosure inventory is increasingly concentrated in Florida and several other states with long legal foreclosure processes.
- New home starts are just 36% of the way back to normal. The latest three-month average (from August because more recent data have been delayed by the government shutdown) is 870,000 starts, well below the long-term norm of 1.5 million. Construction, however, is looking up: the latest permits data, for October, showed a jump to 1.03 million, which heralds an increase in starts in November or December.
- Employment for young adults is the recovery’s caboose. Just 74.9% of adults age 25-34 are employed, which is only 23% back to normal (79.3% employment rate) from the worst level of the recession (73.6%). Young adults need jobs in order to move out of their parents’ homes, form their own households, and eventually become homeowners. In turn, construction depends on household formation. The housing market cannot fully recover until young adults get back to work.
Which Local Markets are Back to Normal?
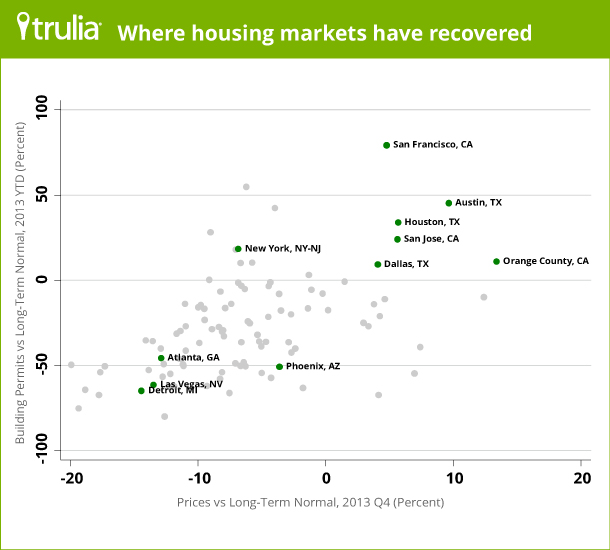
Not only are different housing market activities recovering at different rates, the housing recovery is uneven across local markets, too. To track local recoveries, we examine two of the above indicators at the metro level: prices relative to local norms, from Trulia’s Bubble Watch, and construction permits relative to local norms, from the Census. These two measures are strongly correlated: as the scatterplot below shows, in metros where prices are near or above normal, construction permits are also near or above normal.
Of the 100 largest metros, 10 are back to normal or nearly there for both prices and permits. (By “nearly there,” we mean that prices are undervalued by less than 2% and permits are less than 10% below normal.) These include Austin, Dallas, and Houston in Texas; Orange County, San Francisco, and San Jose in California; and Denver, Seattle, Nashville, and the Bethesda, MD, metro areas.
These 10 metros share a couple things in common: they weren’t among the worst-hit markets in the housing bust, and they’ve had relatively strong job growth in the recovery. However, these recovered metros are NOT the markets with the biggest price increases. Among the 10 recovered metros, only one – Orange County – is also in the top 10 for year-over-year price gains, according to the November Trulia Price Monitor. In contrast, some of the markets with the largest price increases, like Las Vegas and Detroit, are still far from fully recovered. Local price increases, by themselves, are a poor guide to whether local markets have recovered: instead, the markets with the biggest price increases in 2013 are those that suffered the biggest price declines after the housing bubble burst.
To sum it up: Trulia’s Housing Barometer shows that the recovery has progressed on most fronts. Non-distressed sales and home prices are approaching normal levels and could reach them in 2014. Delinquencies + foreclosures are also improving, though “normal” is still more than one year away. The red flags are construction starts and young-adult employment, both of which remain closer to recession levels than to normal. The recovery has gone a lot farther for homeowners, who benefit from rising home values, and real estate agents, whose commissions rise with both prices and sales, than for construction workers or young adults looking for jobs. The recovery also looks much better in the San Francisco Bay Area, Texas, and other markets that are back to normal than in wide swathes of the country where normal isn’t yet within reach. Even as the recovery progresses overall, it remains stubbornly uneven.
NOTE: Trulia’s Housing Barometer tracks five measures: existing home sales excluding distressed (NAR), home prices (Trulia Bubble Watch), delinquency + foreclosure rate (LPS), new home starts (Census), and the employment rate for 25-34 year-olds (BLS). Also, our estimate of the “normal” share of sales that are distressed is 5%; LPS reports that the share was in the 3-5% range during the bubble. For each measure, we compare the latest available data to (1) the worst reading for that indicator during the housing bust and (2) its pre-bubble “normal” level. We use a three-month average to smooth volatility for the four indicators that are reported monthly (all but home prices). The latest published data are November for the employment rate; October for existing home sales and delinquency + foreclosure rate; August for new home starts (September and October were delayed due to government shutdown); and Q4 for home prices.


