Three out of five Housing Barometer measures are getting close to normal. But the two measures that hitch housing to the broader economy are still struggling, so the job market and housing market aren’t helping each other as they should.
How We Track This Uneven Recovery
Since February 2012, Trulia’s Housing Barometer has charted how quickly the housing market is returning to “normal” based on multiple indicators. Because the recovery is uneven, with some housing activities improving faster than others, our Barometer highlights five measures:
- Existing home sales, excluding distressed sales (National Association of Realtors, NAR)
- Home-price levels relative to fundamentals (Trulia Bubble Watch)
- Delinquency + foreclosure rate (Black Knight, formerly LPS)
- New construction starts (Census)
- The employment rate for 25-34 year-olds, a key age group for household formation and first-time homeownership (Bureau of Labor Statistics, BLS)
Home prices from our Bubble Watch is a quarterly report. The other four measures are reported monthly. To reduce volatility, we use three-month moving averages for these measures. For each indicator, we compare the latest available data to (1) its worst reading during the housing bust and (2) its pre-bubble “normal” level.

All Five Measures Improved Year-Over-Year
Four of the five Housing Barometer indicators made good progress over the past year and the fifth – non-distressed existing home sales – eked out a slight increase. But, despite improvement, the employment rate for young adults still hasn’t gotten even half of the way back to normal.
Housing Indicators: How Far Back to Normal?
| Now | One quarter ago | One year ago | |
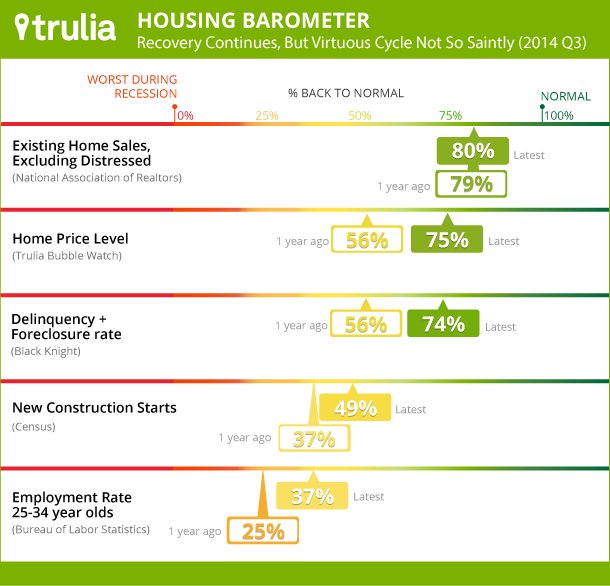
| Existing home sales, excl. distressed | 80% | 64% | 79% |
| Home price level | 75% | 66% | 56% |
| Delinquency + foreclosure rate | 74% | 74% | 56% |
| New construction starts | 49% | 49% | 37% |
| Employment rate, 25-34 year-olds | 37% | 35% | 25% |
| For each indicator, we compare the latest available data to (1) its worst reading for that indicator during the housing bust and (2) its pre-bubble “normal” level | |||
- Existing home sales (excluding distressed) were 80% back to normal in August, up from 64% one quarter earlier, after stumbling from 79% one year ago. Distressed sales keep falling. Increasingly, foreclosures are concentrated in states with a foreclosure laws that result in a longer legal process. Existing sales are in better shape than new home sales, dominating the market even more than usual. The ratio of existing to new home sales was 10:1 in August, compared with a long-term normal ratio of 6:1..
- Home prices continue to climb, though at a slower rate. Trulia’s Bubble Watch shows prices were 3.4% undervalued in 2014 Q3, compared with 13.5% undervalued at the worst of the housing bust. That means prices are three-fourths of the way back to their “normal” level at which they’re neither over- nor undervalued.
- The delinquency + foreclosure rate was 74% back to normal in August, the same as one quarter ago and up significantly from 56% one year ago. With the share of mortgage borrowers with negative or near-negative equity dropping, the default rate should continue to go down.
- New construction starts are 49% back to normal, the same as one quarter ago and up from 37% one year ago. Multi-unit starts continue to lead the construction recovery. Year-to-date multi-unit starts are up 23% year-over-year, versus just 3% for single-family starts. Even though single-family starts are far below normal levels, household formation looks too weak to support more single-family homebuilding.
- Employment for young adults brings up the rear. August’s three-month moving average shows that 75.7% of adults age 25-34 are employed, which is just 37% of the way back to normal. Because young adults need jobs in order to move out of their parents’ homes, form their own households, and eventually become homeowners, the housing recovery depends on millennials finding work. Among 25-34 year-olds, just 12% who have jobs live with their parents. By contrast, 21% without jobs do.
The Housing Market and the Broader Economy Aren’t Helping Each Other
The two lagging Housing Barometer measures – construction and young-adult employment – connect the housing market to the job market. First, housing should help jobs: construction adds to employment not only in homebuilding but also in related industries like furniture manufacturing and home-improvement retailing. Second, jobs should help housing: young adults are more likely to rent or buy, rather than live with others, if they have jobs. In this recovery, young-adult employment and construction are weak – so the virtuous cycle of housing and jobs isn’t looking quite so virtuous.
That’s not to say that housing isn’t doing anything for the economy. Rising home prices make homeowners wealthier, and the more wealth people have, the more they spend. And the decline in defaults and foreclosures have helped stabilize the financial system and hard-hit neighborhoods. As we’ve seen, home prices right themselves, as undervalued homes attract investors and other buyers, pushing prices back up. In turn, higher prices make defaults less likely.
But as the housing recovery continues, it depends less on the “rebound effect” – this tendency of the housing prices to right themselves – and more on such fundamentals as jobs, income growth, and household formation. These have been slow to improve in this recovery. In particular, the Housing Barometer shows that young-adult employment lags. What’s more, new Census data showed that median income has stagnated and household formation is far below normal levels. In this recovery, jobs and housing can’t get what they need from each other.
NOTE: Trulia’s Housing Barometer tracks five measures: existing home sales excluding distressed (NAR), home prices (Trulia Bubble Watch), delinquency + foreclosure rate (Black Knight), new home starts (Census), and the employment rate for 25-34 year-olds (BLS). Also, our estimate of the “normal” share of sales that are distressed is 5%; Black Knight reports that the share was in the 3-5% range during the bubble. For each measure, we compare the latest available data to (1) the worst reading for that indicator during the housing bust and (2) its pre-bubble “normal” level. We use a three-month average to smooth volatility for the four indicators that are reported monthly (all but home prices). The latest data are from August for the employment rate, existing home sales, new construction starts, and the delinquency + foreclosure rate; and Q3 for home prices.