Nationally, house flipping is on the rise. Las Vegas has hit a post-recession high, but investors are increasingly putting elbow grease into the homes they’re flipping.
House flipping made a comeback in 2016, increasing for the first time in three years. On top of that, the share of home sales made up by flips last year was the most in a decade, and the third most since 2000. Las Vegas led the country in flipping activity for the second year straight, but house flippers in Detroit picked up their game more than flippers in any other market.
Looking at all the flips between Jan 1, 2016 and Dec 31, 2016, we found:
- Nationally, home flipping has picked up for the first time in three years, increasing to 6.1% of all home sales in 2016 from 5.3% the year before.
- Las Vegas tops the list with the most flipping activity in 2016, increasing to 10.5% in 2016 from 9.6% in 2015. This marks the second year straight that Sin City has led the country in house flipping. Of these flips, 11.6% had permitted work done to them, signaling that investors are adding value rather than speculating.
- Detroit and Chicago saw the largest increase, jumping by 4.8 and 2.8 percentage points, respectively. In fact, both of these markets experienced peaks in flipping activity in 2016 – a telltale sign that investors are as active as they’ve ever been.
There are two reasons why house flipping trends matter. First, flipping is a speculative undertaking where investors are betting on turning a profit, and have historically occurred at high rates just before a market peaks. Second, flipping usually entails removing a home from a particular price point in the market and moving it to a higher price point through improvement. That movement creates competition for homebuyers who may be looking to build sweat-equity on their own, but it also provides improvements to the housing stock for buyers who don’t have time or cash to improve a home themselves.
Flipping Making a Comeback Across the US
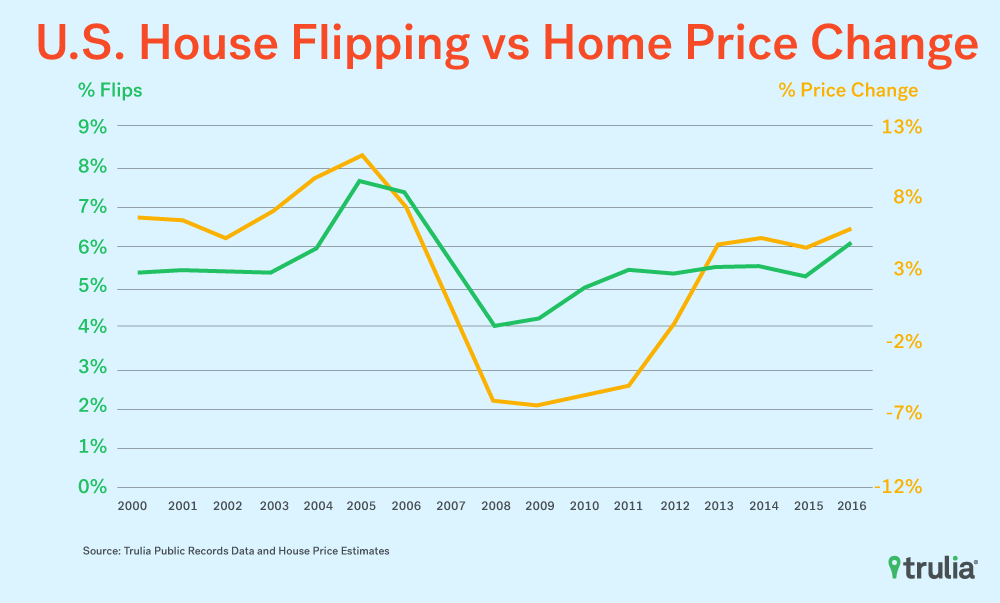
In 2016, national flipping activity increased for the first time in three years. Flipped homes made up 6.1% of all home sales last year, up from 5.3% in 2015. This is the highest level we’ve seen since 2006 when flips were at 7.3%. Furthermore, flipping activity in 2016 was the third highest since 2000 and the jump between 2015 and 2016 was the second largest increase since that year.
Why is flipping activity picking up again? While it’s tough to single out one particular cause, rapidly rising home prices have likely played a major role. Home price gains in 2016 were the most since 2006, and prices in many markets are now back to their pre-recession peaks.
In general, flipping homes requires at least some growth in prices in order to entice investors to pick up their game. Even though they can add value by improving the quality of a home, rising prices provide a safety net when taking on a project. When prices are rising faster, investors flipping homes have greater opportunity to come out ahead even if the project doesn’t go according to plan. Over the past year, price gains have jumped to their highest level since 2006, and so has flipping activity.
Flipping Most Common in Las Vegas, Least Common in Wichita
Though flipping is picking up nationally, flipping activity varies significantly across individual markets. Las Vegas, Nev. leads the pack for the second straight year with 10.5% flips, up from 9.6% last year. At the top of the flipping charts, Las Vegas is followed by two Florida markets with Daytona Beach and Tampa having 9% and 8.4% flips, respectively. On the other end of the flipping spectrum, Wichita, Kan., Gary, Ind., and Louisville, Ky., have the lowest share of flips at 2% or less.
| Housing Markets with Largest and Smallest Share of Flips | ||||
| Flipping Hot Spots | Flipping Cool Spots | |||
| Las Vegas, NV | 10.5% | Wichita, KS | 1.4% | |
| Deltona–Daytona Beach–Ormond Beach, FL | 9.0% | Gary, IN | 2.0% | |
| Tampa, FL | 8.4% | Louisville, KY | 2.0% | |
| Memphis, TN | 8.2% | Fort Worth, TX | 2.1% | |
| Fresno, CA | 8.2% | Dallas, TX | 2.8% | |
| Nashville, TN | 8.1% | Honolulu, HI | 2.8% | |
| Fort Lauderdale, FL | 8.0% | Pittsburgh, PA | 3.0% | |
| Atlanta, GA | 7.9% | Wilimington, DE | 3.1% | |
| Knoxville, TN | 7.6% | Omaha, NE | 3.1% | |
| Tacoma, WA | 7.6% | Albuquerque, NM | 3.2% | |
| NOTE:To see the full data set, click here. | ||||
Not only did Las Vegas lead the country in flipping activity last year, it’s also getting close to its 2004 pre-recession peak of 12.4%. Does this mean the housing market in Las Vegas is going to flip out in the coming year? Maybe, but there are signs that investors there are actually making improvements to the homes they’re flipping.
But were Las Vegas flippers improving the homes they flipped or were they just speculating on price gains? To find out, we used permitting data provided by BuildZoom to calculate the share of flipped properties with city-approved building permits issued in the 12 months prior to the flip. While not all improvements on a property require a permit, such as painting, replacing light fixtures or adding window coverings etc., permit activity is a broad indicator of whether investors are improving properties or merely holding out for price gains. The good news is that 11.6% of flipped properties in Las Vegas had permit-approved work done on them. This is the highest since at least 2000. So although flipping activity is nearing record highs, so is the improvement on flipped homes.
Detroit Leads Markets with Largest Flipping Gains
While Las Vegas leads the country in the share of home sales made up of flips, America’s heartland has seen the largest increase in flipping activity in the past two years. Of the 10 housing markets with the largest year-over-year increase in flips, seven are in the South and the other three in the Midwest. Surprisingly, Detroit, which has been the poster child for the dilapidated and abandoned properties left behind by the foreclosure crisis, leads the country in increased flipping activity with a 4.8 percentage points jump between 2015 and 2016.
Other markets where flipping activity has increased by two and three percentage points include Chicago, Knoxville, Tenn., Memphis, Tenn., and Fort Lauderdale, Fla. In fact, many of these markets experienced record-highs in flipping activity in 2016 – a telltale sign that investors there are as active as they’ve ever been.
| Housing Markets with Largest Increase in House Flippin | ||||||
| U.S. Metro | Percentage Point Change in Flips, 2015 -2016 | % Flips, 2016 | % Flips, 2015 | Peak year | Peak % Flips | |
| Detroit, MI | +4.8 points | 6.0% | 1.2% | 2016 | 6.0% | |
| Chicago, IL | +2.8 points | 7.5% | 4.7% | 2016 | 7.5% | |
| Knoxville, TN | +2.7 points | 7.6% | 4.9% | 2016 | 7.6% | |
| Memphis, TN | +2.5 points | 8.2% | 5.7% | 2016 | 8.2% | |
| Fort Lauderdale, FL | +2.2 points | 8.0% | 5.8% | 2005 | 11.4% | |
| Tampa, FL | +2.0 points | 8.4% | 6.4% | 2005 | 13.3% | |
| Dayton, OH | +2.0 points | 5.9% | 3.8% | 2006 | 7.0% | |
| Jacksonville, FL | +1.9 points | 7.4% | 5.4% | 2006 | 14.8% | |
| Deltona–Daytona Beach–Ormond Beach, FL | +1.9 points | 9.0% | 7.1% | 2005 | 12.0% | |
| New Orleans, LA | +1.9 points | 3.5% | 1.6% | 2016 | 3.5% | |
| NOTE:To see the full data set, click here. | ||||||
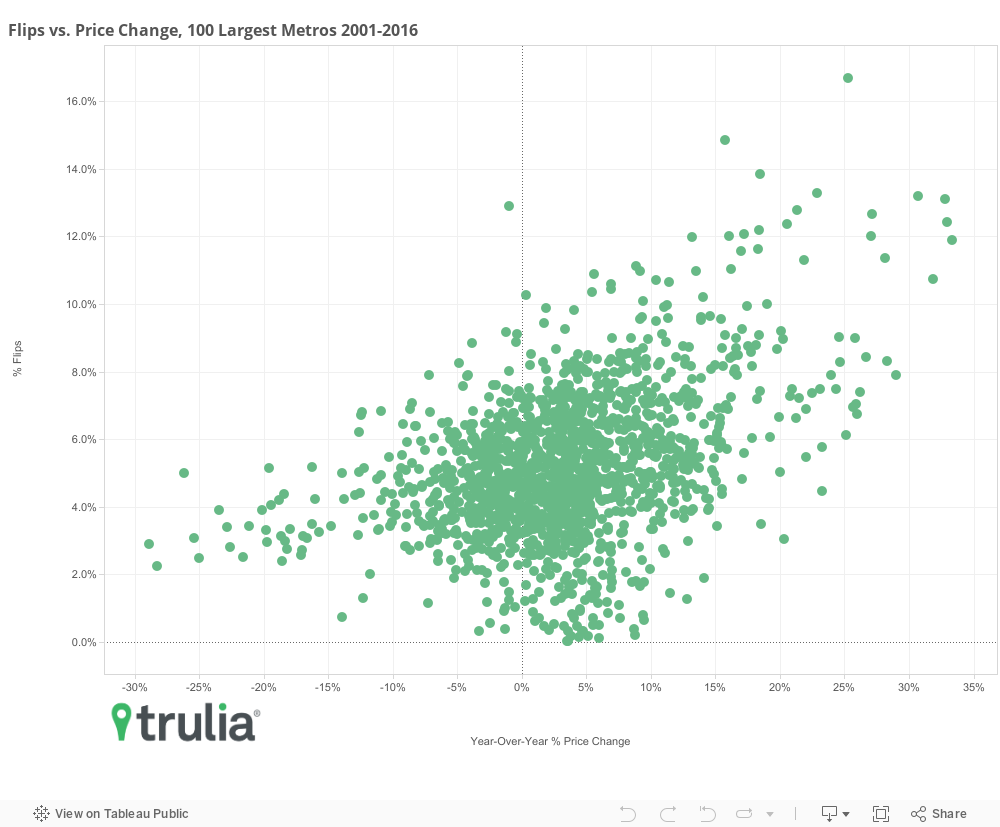
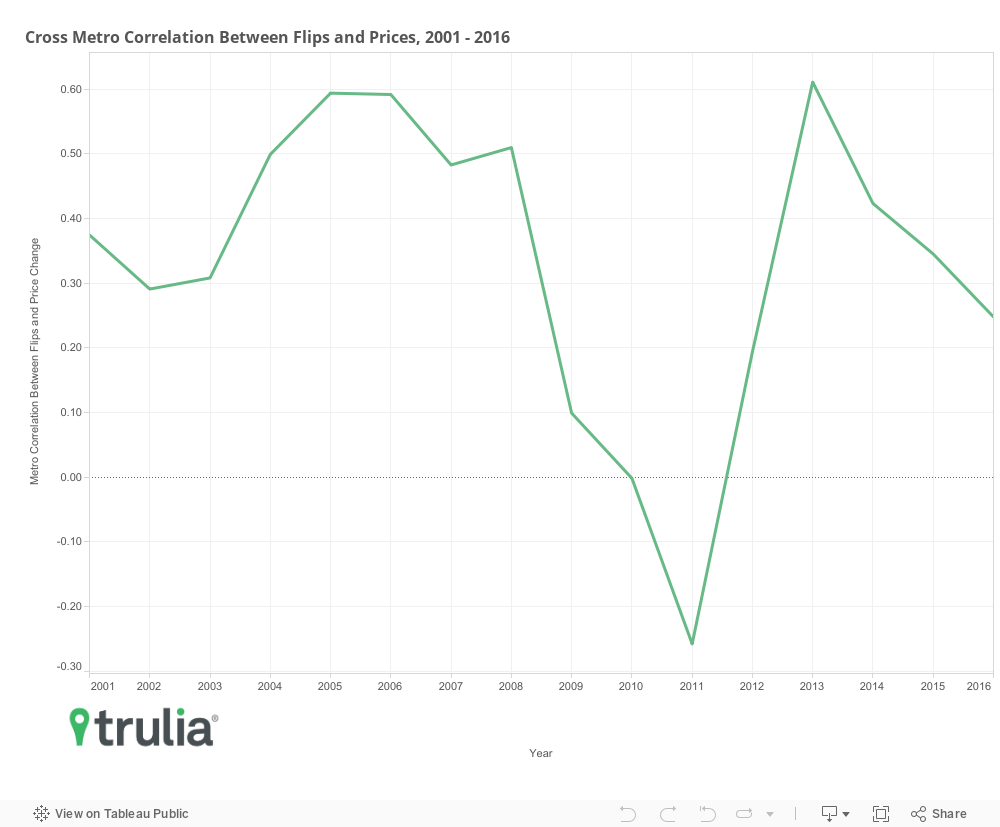
Last, flipping activity is still highly correlated with price gains across markets, but the relationship has fallen from previous years. The correlation between flipping and prices changes reached a peak of 0.60 (on a scale of -1 to 1 where either extreme means that the relationship is strongly correlated) a year after prices bottomed out in 2013. Since then, the correlation has dropped to a modest 0.25. During the bubbles years, the correlation consistently hovered between 0.5 and 0.6.
Is this a good thing? We can’t be sure, but we think so. As mentioned above, successful flipping can occur for two reasons: (1) investors add value to a home with deferred maintenance, which is a good thing, and/or (2) investors speculate that prices will rise and so they simply buy and sit on a home without doing any improvements, which is not so good. When the annual correlation between flipping activity and price change is as close to zero across metros as it is now, it’s much less likely that flippers are speculating on homes, and vice versa. Given the recent drop in correlation between flipping and price change, as well a steady increase in improvements in flipping hot spots like Las Vegas, there’s not much reason to flip out over the recent uptick in house flipping.
Methodology
We differentiate between two different types of property flips: a traditional flip, which is the purchase of a house at market rate and selling it at a higher market rate price, because of improvement to the property and/or rising prices; and a clearance flip, which is the purchase of a distressed house at a discount because of a forced sale, such as a foreclosure, followed by a resale at market rate. We do not include clearance flips in our measure of flipping since our goal is to estimate the relationship between prices and flipping in a relatively normal, non-distressed housing market. As a result, our definition of a flip is a property that sold twice in a twelve-month period, in which both transactions are considered arm’s length.
To calculate the share of flipped properties in Las Vegas that had approved work done during the flip, we used city-level building permit records provided to us by BuildZoom and matched them with records all properties that were flipped in Las Vegas in a given year. We dropped all properties from our analysis that were built within two calendar years of the flip to ensure that approved permits were not related in any way to the initial construction of that property. Note that this calculation was only conducted for the City of Las Vegas rather than the Las Vegas-Paradise Metropolitan Statistical Area as also reported.

