Construction activity is a fundamental measure of local housing market health. That’s because homebuilding is both a signal of where builders are betting on future housing demand as well as a creator of local jobs. In this housing recovery, construction might even be a better measure of local market health than home price changes, which have been driven in part by investors and others buying undervalued homes.
Census building permit data reveal which markets are breaking new ground. Based on permits for the first half of 2014, we projected the level of building permits for the full year of 2014 for each metro, compared with the metro’s own historical annual average level of building permits from 1990 to 2013. Of course, the historical average level of construction ranges from a lot in places like Las Vegas and Raleigh to very little in places like San Francisco and Detroit, but we’re looking at how far each metro’s 2014 construction activity is above or below its own historical average.
Where Construction is Booming
Construction activity is highest relative to the local norm in Boston, New York, San Jose, and Houston, which are on track to build at least 50% more new homes in 2014 than their local historical average. The rest of the top 10 are in California, Texas, or Oklahoma. Of course, the normal level of construction in many of these markets – particularly Boston, New York, Los Angeles, and San Francisco – is low relative to most other metros across the country, but in 2014 they’re outperforming their own historical norm.
| Top 10 Metros Where New Home Construction Is Highest Above Normal | ||||
| # | U.S. Metro | 2014 annualized permit activity relative to metro historical norm | Year-over-year asking home price change, July 2014 | Multi-unit building share of 2014 permits |
| 1 | Boston, MA | +73% | 6.0% | 71% |
| 2 | New York, NY-NJ | +70% | 5.6% | 92% |
| 3 | San Jose, CA | +69% | 9.1% | 75% |
| 4 | Houston, TX | +61% | 10.4% | 34% |
| 5 | Oklahoma City, OK | +42% | 3.4% | 23% |
| 6 | Orange County, CA | +40% | 6.6% | 57% |
| 7 | Austin, TX | +39% | 12.3% | 44% |
| 8 | Dallas, TX | +36% | 7.6% | 51% |
| 9 | San Francisco, CA | +36% | 12.1% | 84% |
| 10 | Los Angeles, CA | +34% | 9.3% | 73% |
| Note: among the 80 of the 100 largest metros for which sufficient local permit data are available. Sources: Census and Trulia. | ||||
Two more facts about these top-10 building-boom markets: First, price increases aren’t especially high, with asking home prices up less than the national average of 7.8% in five of those 10 metros. Second, multi-unit buildings account for the majority of new construction in seven of these 10 metros, and more than 80% of new units in metro New York and San Francisco.
In contrast, building activity is running at three-quarters below normal levels in Fort Lauderdale and Detroit, and below half of normal in Las Vegas, Sacramento, and several Midwest markets. In Chicago and Atlanta, too, construction is more than 40% below normal despite sharply rising prices.
| Top 10 Metros Where New Home Construction Is Lowest Below Normal | ||||
| # | U.S. Metro | 2014 annualized permit activity relative to metro historical norm | Year-over-year asking home price change, July 2014 | Multi-unit building share of 2014 permits |
| 1 | Fort Lauderdale, FL | -76% | 11.0% | 50% |
| 2 | Detroit, MI | -75% | 13.7% | 7% |
| 3 | Palm Bay–Melbourne–Titusville, FL | -69% | 12.3% | 0% |
| 4 | Las Vegas, NV | -62% | 11.3% | 28% |
| 5 | Lake County-Kenosha County, IL-WI | -62% | 12.7% | 41% |
| 6 | Sacramento, CA | -60% | 11.0% | 15% |
| 7 | Honolulu, HI | -57% | 6.2% | 22% |
| 8 | Grand Rapids, MI | -55% | 12.2% | 10% |
| 9 | Riverside–San Bernardino, CA | -55% | 15.0% | 26% |
| 10 | Cincinnati, OH-KY-IN | -51% | 12.2% | 34% |
| Note: among the 80 of the 100 largest metros for which sufficient local permit data are available. Sources: Census and Trulia. | ||||
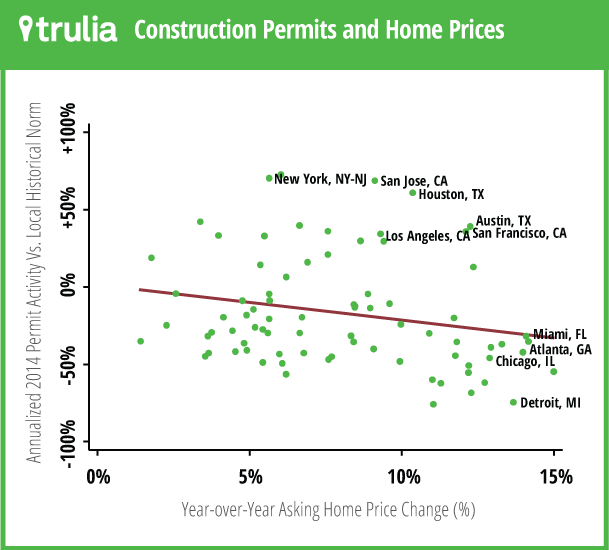
Looking across the 80 large metros for which permit data are available, construction booms tend to go hand-in-hand with smaller price gains. The correlation between permit activity relative to historical norms and the year-over-year price change is -0.22. (Remember that correlations range from 1 to -1, where zero means there is no linear relationship.) That’s a modest though statistically significant negative relationship. And, as the scatterplot below shows, there are only a few markets like Austin, Houston, San Francisco, and San Jose that have both construction booms and strong price gains. Why aren’t rising prices enough to get builders to build? Let’s answer that next.

Construction is from Mars, Home Prices are from Venus
You would think that home prices and construction activity should be recovering in the same markets where housing demand is strong, right? It’s true that metros with faster job growth in 2013 tend to have not only bigger price increases, but also more construction through mid-2014. Other local market conditions, though, play out differently for prices and construction – which explains why few markets are having both a local construction boom and sharply rising prices:
- Big, dense metros have more construction, but not larger price increases. The top-10 list for permit activity in 2014 versus the local norm includes New York and San Francisco, two of the metros with the highest population density. More broadly, urban density is correlated with construction activity (again, relative to local norms), but not with year-over-year price increases. What’s behind this is that multi-unit buildings – overwhelmingly built for renters — are an unusually high share of new construction in 2014, as the housing recovery is now creating more new renters than first-time homebuyers. That means the local construction booms of 2014 tend to be in big, dense metros where the vast majority of new construction is in multi-unit buildings.
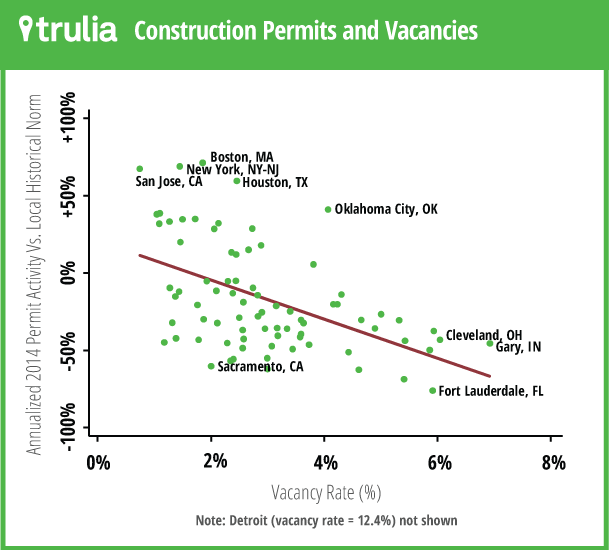
- Builders don’t build where there are lots of vacant homes. Nationally, the year-round vacancy rate for all homes – which includes homes being held off the market but excludes vacation homes – is still above pre-bubble levels. That holds back construction, though not price increases. At the local level, markets with a higher vacancy rate have less construction activity, as this scatterplot shows:
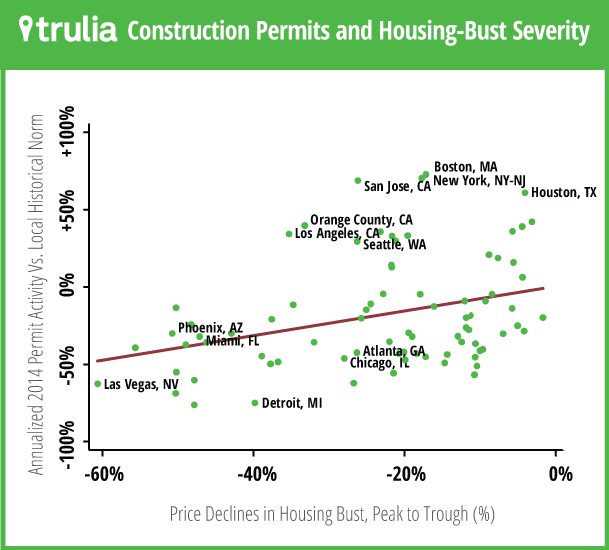
- There’s no “rebound effect” for construction, unlike for home prices. Home prices rose most during the housing recovery in the markets that were hit hardest during the bust, thanks to the rebound effect: Investors and other home buyers bought up relative bargains, helping prices recover. Although the rebound effect is now fading, it still matters for home prices. But for construction, the housing bust had the opposite effect. The hardest-hit markets during the bust are still lagging in homebuilding today. In fact, no market with more than a 40% drop in prices is now back to normal construction levels. And the only metros with at least a 25% drop in prices that are back to normal construction levels are Los Angeles, Orange County, Seattle, and San Jose – all west-coast markets where housing supply is perennially tight.
These local homebuilding trends show why construction nationally is still far below normal. Unlike home prices, which bounce back more quickly, construction recovers slowly. The hardest-hit markets in the housing bust remain behind in construction activity, despite strong price rebounds. A full recovery in construction depends on new households filling up some of the empty homes that are already out there.
Notes
Building permit data is based on county files from the Census, available here. The vacancy rate is based on U.S. Postal Service (USPS) Delivery Statistics data, explained here. Price declines during the bust are based on Federal Housing Finance Agency (FHFA) data, available here. Year-over-year price changes for July 2014 are from the Trulia Price Monitor.